Landscape Susceptibility to
Large Fires
by
Nicholas Gellie
Submitted in fulfilment of the requirements for the degree of Masters of Philosophy
Candidate's Declaration
This thesis contains no material that has been accepted for the award of any other degree or diploma in any university. To the best of the author’s knowledge, it contains no material previously published or written by another person, except where due reference is made in the text.
Acknowledgements
This study was made possible through support of a scholarship from the Australian National University.
I would like to thank my principal supervisor Dr. Geoffrey Cary at the Fenner School of Environment and Society for his overarching support of my research endeavour.
I would also like to thank my supervisors, Dr. Sandy Berry, Dr. Janette Lyndesay, and Mr. Ken Johnson, for their unwavering and enthusiastic direction, comments, and support. In particular, I acknowledge the support of Mr. Ken Johnson in the detail of time series analysis and classification, and more generally for his enthusiasm in encouraging inquiring discourse. Dr Sue Holzknecht provided advice on the earlier drafts of the manuscript and proofread the final version. Dr. Alan Wade undertook editing of the later drafts of the manuscript. Dr Kim Wells undertook detailed scientific editing of the penultimate draft. I am indebted to them for their patience and thoroughness in helping me to prepare the manuscript for publication.
Dr. Kevin Tu provided an advanced copy of a scientific paper containing a model of soil evaporation, which turned out to be invaluable in this study. Dr. Anthony Fowler of the University of Auckland provided the software to run his soil water balance model, as well as a background manual to help understand the model parameters. Dr. Michael Roderick and Mr. Michael Hobbins were exceedingly helpful with the supply of short-wave and long-wave radiation flux data obtained from the Research School of Biological Sciences weather station at Canberra Airport. Similarly, Mr. Norm Mueller of Ecowise Environmental provided me with weather data and streamflow records from the upper Cotter River and Queanbeyan River catchments that proved very useful in checking global irradiance estimates and the components of the daily soil water balance models, such as modelled evaporation and run-off. The Bureau of Meteorology freely provided the weather datasets for this study without which would not have made this study possible. Canadian Forest Service provided a spreadsheet for calculating the Canadian Fire Weather Index (FWI) and its components, which was invaluable for creating the time series of potential fire spread.
Abstract
The aim of my study is twofold: (1) to develop a methodology to investigate the temporal variation in susceptibility of a landscape to fire and (2) to identify possible critical thresholds at which landscapes becomes predisposed to large landscape fires. Critical thresholds are based on two key indicators: landscape dryness and potential fire spread. The study of these
susceptibility factors uses both medium and long-term weather datasets: 65 years of three-hourly and daily weather data from Canberra airport and 136 years of daily rainfall records from Queanbeyan. Landscape dryness and fire weather are examined in a medium-term study, whereas only landscape dryness is used in the long-term study.
Based on the soil dryness index (MSDI) derived by Mount (1972), a new version of a seasonal dryness index (RSDI) was derived from thermodynamic equations, using net radiation and rainfall as the two major pre-determinants of the soil water balance at any point in the landscape. The RSDI model is based on the heat and water balance concepts (Budyko, 1974; Oke, 1987), as well as more recent remote sensing studies of gross primary productivity and transpiration (Berry, 2001; Berry and Roderick, 2002; 2004) and soil evaporation (Priestley and Taylor, 1972; Fisher et al., 2008). The RSDI model requires a minimal number of input
weather parameters: daily rainfall, maximum and minimum temperature and relative humidity, as well as projective foliage cover of functional leaf types for any given vegetation (Berry, 2001; Berry and Roderick, 2004; Fisher et al., 2008).
When assessed by independent tests using comparable studies and streamflow data, the RSDI model performed as well as the original MSDI model. The RSDI model was selected to produce a medium-term landscape dryness using data from Canberra airport. The Fowler daily soil water balance model (Fowler, 1992) was employed for the long-term time series of
landscape dryness because it only requires rainfall data and an annual profile of average daily evaporation.
seven readily identifiable profiles respectively. For both indices, there is considerable heterogeneity in the profiles of fire seasons because of the variability of the synoptic weather patterns, producing rainfall in any given year. The long-term study provided an important set of fire susceptibility benchmarks for recently extreme fire seasons, 1982/83, 2002/03 and 2006/07. The analysis reaffirmed the need for calibrated and validated models of landscape dryness and potential fire spread because the results of the classification technique is dependent on the shape of the annual profiles produced by each index. The analysis also showed that these calibrated models could be used to identify the high-risk fire seasons since the 1870s.
A lightning ignition model, using a decision tree modelling approach, successfully modelled the temporal likelihood of lightning ignition using thunderstorm-days, precipitation, landscape dryness and fire weather. The model indicated that there have been 104 days in the 65 year record at Canberra Airport that have had the potential to start fires. Out of these, only three large landscape fires have occurred in 1951/52, 1982/83, and 2002/03 in the ACT region, which had the right combination of landscape dryness and potential fire spread conditions.
Finally, this study suggests possible relationships between the more severe patterns of landscape dryness and potential fire spread, and the broader continental and sub-global climatic factors important to the development of severe fire conditions.
Table of Contents
Candidate's Declaration ...ii
Acknowledgements...iii
Abstract ...iv
Table of Contents...vi
List of Figures ...x
List of Tables ...xii
List of Equations ...xiii
Acronyms, Symbols, and Indices...xv
Chapter 1: Introduction...19
1.1 Background ...19
1.2 Significance and relevance of the study...24
1.3 Thesis topic ...26
1.4 Research questions and organisation of the remainder of the thesis ...28
Chapter 2: Study Region...32
2.1 Description of study area and landscape ...32
2.2 Climate ...33
2.3 Topography ...37
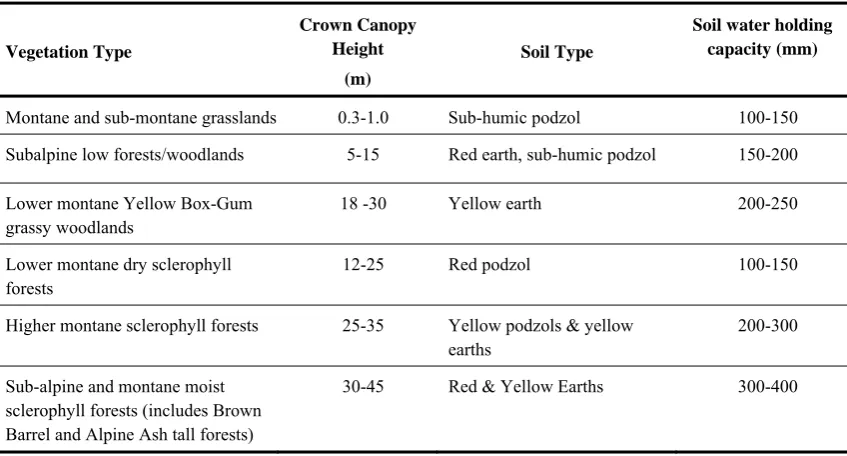
2.4 Vegetation and soils ...38
2.5 Fire history ...41
2.6 Findings...43
Chapter 3: Daily Soil Water Balance Models...44
3.1 Daily soil water balance models...44
3.2 Estimation of potential soil evaporation and plant transpiration...48
3.2.1 Estimation of extra-terrestrial and surface irradiance (RA) ...48
3.2.2 Estimation of all-wave net radiation (RN)...50
3.3 Derivation of soil evaporation (ES) and plant transpiration (ET) sub-models ...51
3.3.1 Potential evaporation (EP)...52
3.3.2 Soil evaporation (ES)...53
3.3.3 Plant transpiration (ET) ...55
3.3.3.1 Potential plant transpiration model for each TMS leaf surface ... 55
3.3.3.2 Actual plant transpiration models for each TMS leaf surface ... 56
3.4 Findings...59
Chapter 4: Datasets for the Landscape Susceptibility Models...60
4.1.1 Modelling plan ...60
4.1.2 Weather variables for the indices of landscape dryness and potential fire spread...62
4.2 The weather data ...65
4.2.1 Weather stations and data standards...65
4.2.2 Effects of weather data and modelling errors on fire susceptibility indices...66
4.2.3 Weather station data suitable for estimating medium and long-term indices of fire susceptibility ...70
4.3 Compilation of consistent and complete weather datasets ...76
4.3.1 Filling gaps and creating proxy weather datasets...76
4.3.2 Filling missing precipitation records...78
4.3.3 Construction of complete datasets for daily soil water balance models...79
4.3.4 Construction of complete datasets for potential fire spread indices...81
4.4 Findings...83
Chapter 5: Derivation and Verification of All-wave Net Radiation ...85
5.1 Estimation of surface irradiance...85
5.1.1 Evaluation method ...88
5.1.2 Comparative performance of surface irradiance attenuation models ...88
5.2 Estimation of surface albedo ...93
5.3 Estimation of downwelling long-wave radiation ...96
5.3.1 Evaluation method ...96
5.3.2 Comparative performance of downwelling long wave radiation models ...99
5.4 Compilation and comparison of all-wave net radiation models...102
5.4.1 Method ...102
5.4.2 Comparative results: time series estimations of all-wave net radiation...102
5.5 Findings in relation to estimation of all-wave net radiation...107
Chapter 6: Calculation, Verification and Testing of Landscape Dryness Models...109
6.1 Derivation of the landscape dryness time series ...109
6.1.1 Medium-term soil water deficit based on the MSDI model...110
6.1.2 Medium-term soil water deficit based on the RSDI model ...111
6.1.3 Long-term soil water deficit based on the Fowler daily soil water balance model...112
6.2 Validity of the estimated values of evaporation components from the RSDI model...117
6.2.1 Validity of soil evaporation estimates...117
6.3 Validity of plant transpiration estimates ...120
6.3.1 Comparison of annual and monthly values of plant transpiration ...120
6.4 Validity of the estimates of the components of the water balance ...125
6.4.2 Validity of annual runoff estimates ...129
6.5 Selection of preferred daily soil water balance models...131
6.6 Findings in relation to daily soil water balance models ...134
Chapter 7: Potential Fire Spread Indices and Thresholds of Landscape Dryness ...136
7.1 The relationship between soil water deficit and fuel availability in potential fire spread models ...136
7.2 Live vegetation flammability and potential fire spread...138
7.3 Relationship between live leaf moisture content, vegetation flammability, and the potential for LLFs...140
7.4 Evaluation of potential fire spread models...141
7.4.1 Forest Fire Danger Index ...142
7.4.2 Canadian Fire Weather Index...142
7.4.3 Comparison of PFSI models ...143
7.5 Derivation: potential fire spread time and landscape dryness datasets ...145
7.6 Findings...146
Chapter 8: Interpreting Medium-term Landscape Susceptibility to Large Fires ...147
8.1 The fire season calendar...148
8.1.1 The seasons in relation to temperature and all-wave net radiation ...149
8.1.2 The fire season calendar defined by fire susceptibility indices...151
8.2 Classification: medium-term landscape dryness ...154
8.2.1 Average seasonal variation in medium-term landscape dryness ...154
8.2.2 Results: classification of landscape dryness by cluster analysis ...156
8.2.3 Classification: medium-term potential fire spread ...160
8.2.4 Selection of the preferred potential fire spread model...160
8.2.5 Classification: annual profiles of medium-term potential fire spread index ...163
8.3 Temporal variability of potential fire spread...168
8.3.1 Year-to-year variation in the potential for large landscape fires based on potential fire spread index...168
8.4 Defining the thresholds and timing of extremes of fire susceptibility ...169
8.4.1 Seasonal monthly extremes of fire susceptibility ...171
8.4.2 Seasonal variability of daily potential fire spread...175
8.5 Potential lightning ignition...178
8.5.1 Temporal model of potential lightning ignition ...179
8.5.2 Atmospheric conditions relating to dry thunderstorms...181
8.6 Findings in relation to medium-term susceptibility to large landscape fires...183
8.6.1 Derivation of a new fire season calendar ...183
8.6.2 Classification of fire seasons using indices of landscape dryness and potential fire spread...183
Chapter 9: Interpreting Longer-term Landscape Susceptibility to Large Fires and
Contributing Climatic Factors ...186
9.1 Time series analysis of medium and long term landscape dryness ...186
9.1.1 Longer-term trends in medium-term landscape dryness...187
9.1.2 Underlying trends revealed: medium-term time series of landscape dryness...192
9.1.3 Long-term time series analysis of landscape dryness ...194
9.1.4 Sub-decadal, decadal, and inter-decadal variability in the long-term landscape dryness time series...196
9.2 Classification: long-term landscape dryness ...199
9.2.1 Temporal sequence of fire seasons based on classification group and sub-groups ...207
9.2.2 Fire seasons leading to landscapes being highly susceptible to large landscape fires...209
9.3 Climatic influences setting up conditions for large landscape fires ...213
9.3.1 Australian climatic factors and influences...214
9.3.2 The influence of the sub-tropical-temperate trough on landscape susceptibility to large landscape fires ...216
9.3.3 The effect of the sub-tropical ridge and other synoptic weather features on the potential for large landscape fires...218
9.3.4 Key synoptic factors influencing the potential for large landscape fires...220
9.4 Findings...221
9.4.1 Putting the medium-term results into a longer-term temporal context...222
9.4.2 Influence of background climatic factors and processes ...222
Chapter 10: Summary and Conclusions...224
10.1 Overview and major findings...224
10.2 Limitations of the study ...230
10.3 Directions for future research...232
10.4 Conclusions ...233
References ...237
Appendix 1: Calculations of All-wave Net Radiation, Evaporation, and their respective Components...249
Appendix 2: Calculations of Soil Water Deficit (SWD) for Canberra Airport and the upper Cotter River catchment ...250
Appendix 3: Method for Calibrating the Fowler daily soil water balance model...251
List of Figures
Figure 1.1 Key factors in landscape susceptibility to large fires... 20
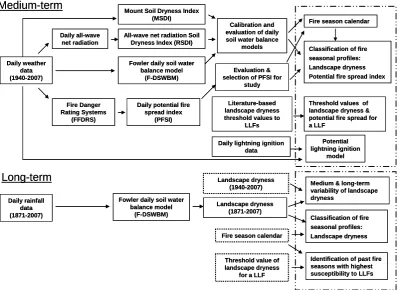
Figure 1.2 The methodology employed in this study to analyse and interpret landscape susceptibility to large fires... 27
Figure 2.1 The study area shown in inset (top left hand corner) and in relation to the ACT and surrounding land in New South Wales (main diagram)... 32
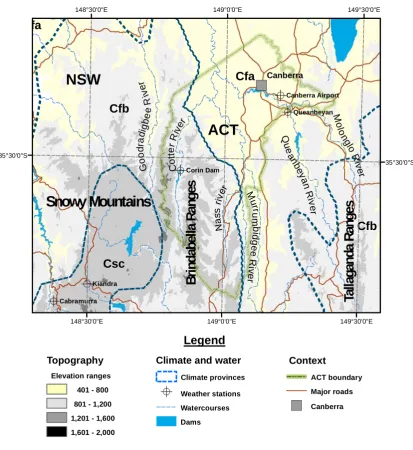
Figure 2.2 The ACT region, showing Gentilli climate zones, topography, dams, rivers, and important weather stations sites referred to in text ... 34
Figure 2.3 Mean monthly rainfall and mean daily temperature at (a) Canberra Airport (585 m ASL) and (b) Cabramurra (1485 m ASL)... 35
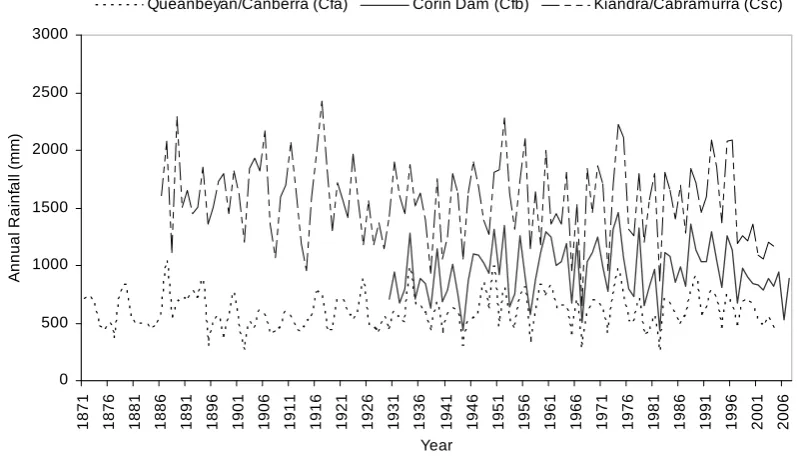
Figure 2.4 Trends in rainfall at rainfall stations representative of the three climate provinces in the study region... 37
Figure 2.5 Vegetation sub-formations in relation to Gentili’s climate zones... 39
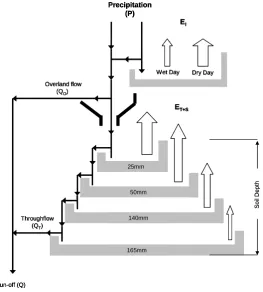
Figure 3.1 Elements of a daily soil water balance model (DSWBM) ... 45
Figure 3.2 The MSDI model and its components ... 46
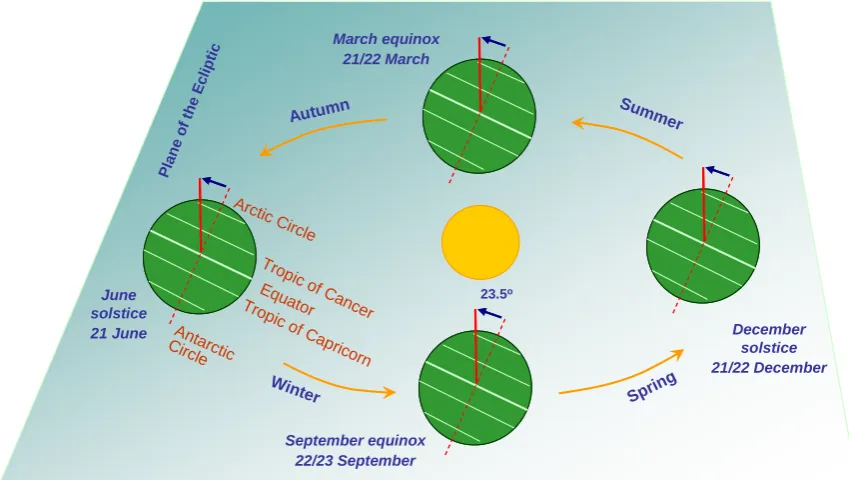
Figure 3.3 Orbit of the Earth around the sun on the plane of the ecliptic during the course of the annual cycle ... 49
Figure 3.4 P T E E ratios estimated using different soil water resistance models across the range of soil water deficit (0-165 mm) ... 58
Figure 4.1 Modelling plan for thesis ... 61
Figure 4.2 Weather variables and sub-models for estimating landscape dryness index... 62
Figure 4.3 Weather variables and sub-models for estimating potential fire spread ... 63
Figure 4.4 Estimation of TMAX at Corin Dam, from (a) Canberra Airport and (b) Cabramurra records (18 August 1996 to 30 July 2008)... 80
Figure 4.5 Estimation of (a) TMIN and (b) RH1500 at Corin Dam, based on Canberra Airport records (18 August 1996 to 18 August 2002) ... 81
Figure 4.6 Relationship between T1500 and TMAX... 82
Figure 5.1 Attenuation of extra-terrestrial short wave radiation (0.1 and 3.1 m) by ozone, carbon dioxide and water... 86
Figure 5.2 Performance of the six best relationships used to estimate surface irradiance... 91
Figure 5.3 Comparison of estimated and observed surface irradiance (RS) at (a) Googong and (b) Corin Dam in the upper Cotter River catchment... 93
Figure 5.4 Performance of the three best downwelling radiation equations in clear skies (a), (b), and (c) and cloudy skies (d), (e), and (f)... 101
Figure 5.5 Summary of (a) RN and its components (b) RS and (c) L* from weather data at Canberra Airport (1939-2007) ... 103
Figure 6.1 Daily calculation method in MSDI and RSDI spreadsheet... 111
Figure 6.2 Mean daily EP estimated using Budyko and Priestley-Taylor equations ... 113
Figure 6.3 Correlation between monthly rainfall at Canberra Airport and Queanbeyan (1939-2007)... 114
Figure 6.4 Correlation between annual canopy interception values from the SDI and F-DSWBM models (Canberra Airport - 1940 to 2007)... 115
Figure 6.5 Correlation between evapotranspiration valuesfrom the RSDI and F-DSWBM models (Canberra Airport - 1940 to 2007)... 115
Figure 6.6 Correlation between annual canopy interception values from the SDI and F-DSWBM models (Corin Dam - 1952 to 2007) ... 116
Figure 6.7 Correlation between evapotranspiration valuesfrom the RSDI and F-DSWBM models (Corin Dam - 1952 to 2007) ... 116
Figure 6.8 Annual soil evaporation estimated at the two weather stations (Canberra Airport, Corin Dam) representative of the two climate zones: Cfa and Cfb ... 118
Figure 6.9 Estimates of annual plant transpiration in two climate zones, Cfa and Cfb... 121
Figure 6.10 Comparison between estimated plant transpiration (ET) from MODIS and RSDI models close to Canberra Airport: (a) serial trend and (b) correlation plot ... 123
Figure 6.11 Comparison between plant transpiration from MODIS study and RSDI model, within the upper Cotter River catchment: (a) serial view and (b) correlation plot... 124
Figure 6.12 Annual trends in (a) evaporation of intercepted water (b) evapotranspiration and (c) total evaporation for 1952-2007 in the upper Cotter River catchment... 127
Figure 6.14 Comparison of modelled with observed runoff based on (a) RSDI, (b) MSDI, and (c)
F-DSWBM models ... 130
Figure 6.15 Comparison of SWD produced by RSDI (a), MSDI (b), and F-DSWBM (c) models using Canberra Airport data... 132
Figure 6.16 Comparison of SWD produced by the RSDI (a), MSDI (b), and F-DSWBM (c) models for the upper Cotter River catchment ... 133
Figure 7.1 Relationship between fuel availability and a theoretical drought index expressed by FFDI and FWI ... 137
Figure 8.1 Astronomical breaks in the annual cycle in relation to daily all-wave net radiation (RN) and mean daily temperature (TA) for Canberra Airport ... 150
Figure 8.2 Meteorological breaks in the annual cycle in relation to daily all-wave net radiation (RN) and mean daily temperature (TA) for Canberra Airport ... 151
Figure 8.3 Seasonal markers in the fire season, based on fire susceptibility criteria (mean daily SWD, FFMC, and SFWI) with seasonal breaks previously derived in section 8.1.1 ... 153
Figure 8.4 Daily SWD anomaly through the fire season (1951-2007)... 156
Figure 8.5 Hierarchical classification of fire seasons by annual profiles of soil water deficit (1951-2007) ... 158
Figure 8.6 Annual profile of (a) SFWI and (b) FFDI daily anomalies... 161
Figure 8.7 Comparison of classification trees of (a) SFWI and (b) FFDI... 163
Figure 8.8 Fire season classification based on SFWI index of potential fire spread (1951-2007) ... 165
Figure 8.9 Temporal sequence (a) and classification (b) view of fire seasons (1951-2007). ... 170
Figure 8.10 Thresholds of Monthly Daily Severity Rating juxtaposed against monthly severity rating values (1951/52-2006/07)... 171
Figure 8.11 Thresholds of fire susceptibility based on mean monthly values of landscape dryness and potential fire spread... 172
Figure 8.12 Frequency of occasions when thresholds of landscape dryness and potential fire spread have been exceeded (1951-2007) ... 173
Figure 8.13 Smoothed seasonality of daily potential fire spread (SFWI) (1951-2007) ... 177
Figure 8.14 Best performing potential lightning ignition model... 180
Figure 8.15 Aerosonde profiles taken at Wagga Wagga airport for days on which significant LLFs were started by lightning... 182
Figure 9.1 Trends in deviations of PDO and rainfall at Queanbeyan from their respective means .... 188
Figure 9.2 Cumulative deviation from mean Southern Oscillation Index 1876-2008... 189
Figure 9.3 Simplification of medium-term trends in soil water deficit (Canberra Airport 1939-2007)... 191
Figure 9.4 Trends in Southern Oscillation Index (a) compared with composite (b) and individual (c) sub-decadal, decadal, and inter-decadal individual trends in SWD from 1939 to 2007 ... 192
Figure 9.5 Shifting season of landscape dryness 1939-2007 ... 194
Figure 9.6 Long-term time series of soil water deficit for a hypothetical dry sclerophyll forest near Canberra Airport weather station (July 1871 to June 2007) ... 195
Figure 9.7 Simplification of inter-decadal, decadal, and sub-decadal trends in long-term soil water deficit at Canberra Airport (1871-2008) ... 197
Figure 9.8 Variation in annual seasonal profiles of Soil Water Deficit (1871-2007)... 199
Figure 9.9 Hierarchical classification tree of soil water deficit (1971-2007)... 201
Figure 9.10 Hierarchical classification of Soil Water Deficit viewed from a seasonal (x-axis) classification sequence (Y-axis) (1971-2007)... 205
Figure 9.11 Combined view of (a) classification tree, (b) long-term daily SWD anomaly, and (c) profiles of SWD in fire seaso... 206
Figure 9.12 Temporal sequence of groups and sub-groups of annual profiles of landscape dryness juxtaposed with original time series ... 208
Figure 9.13 (a) Original SWD data (b) SWD >120 mm in peak and later summer periods, and (c) SWD >120 mm only in the high summer period ... 211
Figure 9.14 Fire seasons with peak landscape dryness (SWD>120) falling in the high summer period... 212
Figure 9.15 Significant climatic influences across the Australian continent... 215
List of Tables
Table 1.1 Research questions dealt with in subsequent chapters... 29
Table 2.1 Vegetation, soils and soil water holding capacities in the study area ... 41
Table 3.1 List of soil moisture resistance models... 57
Table 4.1 Weather variables needed for modelling of all-wave net radiation, landscape dryness, and potential fire spread... 64
Table 4.2 Canberra Airport and Corin Dam input weather variables for F-DSWBM, MSDI and RSDI models... 64
Table 4.3 Weather variables needed to estimate potential fire spread (from Canberra Airport)... 65
Table 4.4 Contemporary standards for weather data collected at accredited reference climate stations in Australia ... 67
Table 4.5 Range in absolute and relative errors for weather variables at manned observing and automatic weather stations... 69
Table 4.6 Precipitation weather station attributes in the study region ... 73
Table 4.7 Completeness of fire weather variables at Canberra Airport to produce a potential fire spread index ... 75
Table 4.8 Completeness of records of key weather variables with proposed method for estimating missing records... 77
Table 4.9 Correlation of monthly precipitation at different weather stations ... 78
Table 5.1 Empirical models used to estimate surface irradiance on a daily basis... 89
Table 5.2 Performance of surface irradiance (RS) models ... 90
Table 5.3 Measured clear-sky albedo values ... 93
Table 5.4 Proportions of leaf functional types and estimated albedo for the principal vegetation types in the study region ... 95
Table 5.5 Empirical models used to estimate daily downwelling long wave radiation ... 98
Table 5.6 Summary statistics of clear sky transmissivity models... 99
Table 5.7 Summary statistics of cloudy sky transmissivity models... 100
Table 5.8 Estimated values of RS, L* and RN (W m-2) from this study and comparable studies at Canberra Airport... 105
Table 5.9 Estimated values of RS, L* and RN (W m-2) from this study and published findings for the Cotter River catchment ... 106
Table 6.1 Representative vegetation cover at the locations surrounding the weather stations... 110
Table 6.2 Additional background parameters to be set in the RSDI model... 112
Table 6.3 Mean daily values of soil evaporation produced by the RSDI model compared with data from other studies... 119
Table 6.4 Mean monthly values of plant transpiration calculated using the RSDI model at Canberra Airport and in the upper Cotter River catchment ... 121
Table 8.1 Fire season calendar based on long-term seasonal dryness and potential fire spread criteria... 152
Table 8.2 Fire season groups, based on daily SWD through solar year... 159
Table 8.3 Groups of Fire Seasons, based on annual SFWI profiles... 166
Table 8.4 MSWD and MDSR values corresponding to months exceeding threshold values by SFWI groups... 174
Table 8.5 Modelling variables used in potential lightning ignition model ... 179
Table 9.1 General description of the six SWD groups in the long-term landscape dryness record... 200
Table 9.2 Description of the sixteen SWD subgroups in the long-term landscape dryness record.... 202
Table 9.3 Fire seasons with landscapes highly susceptible to LLFs... 213
Table 9.4 Factors influencing key factors in landscape susceptibility to large fires... 223
List of Equations
Equation 1.1 ... 21
Equation 3.1 ... 47
Equation 3.2 ... 47
Equation 3.3 ... 47
Equation 3.4 ... 48
Equation 3.5 ... 49
Equation 3.6 ... 49
Equation 3.7 ... 49
Equation 3.8 ... 50
Equation 3.9 ... 50
Equation 3.10 ... 51
Equation 3.11 ... 51
Equation 3.12 ... 51
Equation 3.13 ... 52
Equation 3.14 ... 52
Equation 3.15 ... 52
Equation 3.16 ... 53
Equation 3.17 ... 53
Equation 3.18 ... 54
Equation 3.19 ... 54
Equation 3.20 ... 54
Equation 3.21 ... 54
Equation 3.22 ... 56
Equation 3.23 ... 56
Equation 3.24 ... 56
Equation 3.25 ... 57
Equation 3.26 ... 57
Equation 3.27 ... 57
Equation 3.28 ... 58
Equation 3.29 ... 58
Equation 4.1 ... 82
Equation 5.1 ... 86
Equation 5.2 ... 86
Equation 5.3 ... 87
Equation 5.4 ... 88
Equation 5.5 ... 88
Equation 5.6 ... 88
Equation 5.7 ... 88
Equation 5.8 ... 88
Equation 5.9 ... 88
Equation 5.10 ... 89
Equation 5.11 ... 89
Equation 5.12 ... 89
Equation 5.13 ... 89
Equation 5.14 ... 89
Equation 5.15 ... 89
Equation 5.16 ... 89
Equation 5.17 ... 89
Equation 5.18 ... 89
Equation 5.19 ... 90
Equation 5.20 ... 94
Equation 5.21 ... 94
Equation 5.22 ... 94
Equation 5.23 ... 96
Equation 5.24 ... 96
Equation 5.25 ... 98
Equation 5.26 ... 98
Equation 5.27 ... 98
Equation 5.29 ... 98
Equation 5.30 ... 98
Equation 5.31 ... 98
Equation 5.32 ... 104
Equation 6.1 ... 122
Equation 7.1 ... 139
Equation 7.2 ... 142
Equation 7.3 ... 142
Equation 7.4 ... 142
Equation 7.5 ... 143
Equation 7.6 ... 143
Equation 7.7 ... 143
Acronyms, Symbols, and Indices
Acronym Quantity Units
a year
A Priestley-Taylor coefficient
AWC available soil water capacity mm
AWS automatic weather station
Cpd specific heat of oven-dry dry wood kJ kg-1
Cpw specific heat of water kJ kg-1
CAV mean daily cloud cover Octas
CP heat capacity of water kJ kg-1
S change in soil moisture storage mm
DSR days since rain
DTR daily temperature range o C
dN day number of the year, starting on 1 January
1/d2 correction for the eccentricity of the earth’s orbit
D diffuse radiation Wm-2
DP1500 dew point at 1500 hr 0C
DSR days since rain Day
DY total number of days in a year Day
eS saturation vapour pressure HPa
eA actual vapour pressure HPa
eS (TMAX) water vapour pressure at TMAX HPa
eA (TMIN) water vapour pressure at TMIN HPa
EA actual total evaporation (ES +ET+ EI) or (ET+S+EI) mm
EI evaporation of water intercepted by vegetation mm
ET transpiration flux mm
EP potential evaporation mm
EPT potential transpiration of turgor leaf type (T) mm
EPM potential transpiration of mesophyllous leaf type (M) mm
EPS potential transpiration of sclerophyllous leaf type (S) mm
ES soil evaporation mm
ETT actual transpiration of turgor leaf type (T) mm
ETM actual transpiration of mesophyllous leaf type (M) mm
ETS actual transpiration of sclerophyllous leaf type (S) mm
ET+S evapotranspiration (=ES+ET) mm
FR flash run-off mm
FM the fraction of Mesophyllous leaf type as a proportion of total TMS cover
FS the fraction of Sclerophyllous leaf type as a proportion of total TMS cover
FT the fraction of Turgor leaf type as a proportion of total TMS cover
FV the fraction of photosynthetic radiation absorbed by vegetation (FPAR)
G soil heat flux Wm-2
H sensible heat flux Wm-2
HY heat yield of dry fuel J g-1
I heat output of fire line Wm-1
k light attenuation coefficient at a given wavelength
L downwelling long-wave radiation Wm-2
L upwelling long wave radiation Wm-2
L* net long wave radiation Wm-2
m distance m
mnth month of the year
MF fuel fractional moisture content
ME fuel moisture of extinction
MCS upper surface fuel moisture content
MCL lower surface fuel moisture content
Mf fractional fuel moisture content
MJ megajoules
n the number of daily hours of sunshine
N number of days in year day
P0900 precipitation measured at 0900 hours mm
PFC projective foliage cover %
QIG heat required for pre-ignition kJ kg-1
QD deep sub-surface flow mm d-1
QIG energy required to bring fuel up to ignition temperature Wm-2
Q total run-off mm d-1
QO overland water flow mm d-1
QT soil water through-flow mm d-1
RA Extra-terrestrial irradiance Wm-2
RH relative humidity
RH1500 relative humidity measured at 1500 hours oC
RN net all-wave radiation Wm-2
RN net irradiance for a given wavelength Wm-2
RNS net all wave radiation at the soil surface Wm-2
ROS rate of spread m sec-1
RS net surface irradiance for a given wavelength () Wm-2
SWD soil water deficit mm d-1
TA mean daily temperature atmospheric air temperature oC, K
TF fuel temperature oC, K
TIGW wood ignition temperature oC, K
T1500 temperature measured at 1500 hours oC
TMAX maximum daily temperature oC, K
TMEAN mean daily temperature oC, K
TMIN minimum daily temperature oC, K
TS surface temperature oC, K
VPD vapour pressure deficit HPa
W weight of available fuel per square metre kg m-2
WD1500 wind direction at 1500 hr
WS Wind speed km hr-1
WS1500 wind speed measured at 1500 hours km hr-1
a year
Symbol Quantity Units
surface reflectivity, surface albedo
declination angle in degrees
A emissivity of air
S emissivity of earth’s surface
day length decimal hr
k radiation attenuation coefficient at a given wavelength
latent heat of evaporation J kg-1
optical path length m
W is the density of water Kg m-3
CF atmospheric transmittance
D dust and aerosol atmospheric transmittance
G atmospheric gas transmittance
O atmospheric ozone transmittance
W atmospheric water vapour transmittance
Abbreviation Full name
BIAS Bias in the estimate
BUI Build-up Index
CFFDRS Canadian Forest Fire Danger Rating System
DC Drought Code
DMC Duff Moisture Code
DSR Daily severity rating estimated as a function of the FWI
DSWBM Daily Soil Water Balance Model
F-DSWBM Fowler Daily Soil Water Balance Model
FFDI Forest Fire Danger Index (0-100 scale)
FFMC Fine Fuel Moisture Code
FPAR Fraction PAR (Photosynthetically Active Radiation) absorbed by the plant
canopy
PFSI Potential Fire Spread Index
FWI Fire Weather Index
IOD Indian Ocean Dipole
ISI Initial Spread Index, a component of the FWI model
KBDI Keetch-Byram Drought Index
LLF Large Landscape Fire
LLMC Live Leaf Moisture Content
LOESS Locally weighted smoothing of values in a time series (LOWESS)
MAE Mean absolute error
MBE Mean bias error
MSDI Mount Soil Dryness Index
MDSR Monthly Total DSR
MSWD Monthly Mean SWD
NCEP National Centre for Environmental Prediction
Niño3 Sea surface temperature index in the central Pacific
Niño4 Sea surface temperature index in the western Pacific
PMRE Percent mean relative error
RMSE Root mean squared error
RSDI All-wave net radiation model of Mount Soil Dryness Index (MSDI)
SFWI Standardised FWI (scaled 0-100 to FFDI)
SAM Southern Annular Mode
SOI Southern Oscillation Index
SWD Soil Water Deficit
Chapter 1: Introduction
1.1 Background
The Black Saturday fires in Victoria in February 2009 were devastating in their impact upon life, property, vegetation and wildlife, occurring under extremes of landscape dryness and fire weather. A key issue is how the Victorian landscapes became so flammable and susceptible to fires burning at such extreme intensities, catching local communities and fire authorities off guard. These fires, together with those that preceded them in 1851, 1898, 1914, 1926, 1939, 1982, 2003 and 2006, can be regarded as large landscape fires (Council of Australian Governments, 2003; Foley, 1947). A LLF is defined here as a fire that burns a significant proportion of a regional landscape, somewhere between 20 and 100% of its area. The area burnt in an LLF is generally over 20,000 hectares in size and likely to be more than 100,000 hectares in size.
This study of landscape susceptibility to large fires is about the historical potential for large landscape fires (LLFs) to develop in the ACT study region, based on the seasonal
coincidence of fire susceptibility factors: seasonal landscape dryness, potential fire spread, and sources of ignition (Figure 1.1). Once the longer-term dry landscape conditions are established, the occurrence and potential size of a LLF depend on sources of fire ignition and the daily nature of fire weather. Causes of fire ignition can be from either lightning or human-caused ignitions. Daily weather encompasses diurnal variation in factors such as temperature,
atmospheric moisture, wind speed, and atmospheric instability. The synoptic weather processes that drive the extremes of daily weather, such as dry thunderstorms and the hot, dry and windy weather conditions are related to large-scale processes that are an order of magnitude larger in scale than a landscape.
In this study, the three fire susceptibility factors are viewed primarily in a temporal, rather than a spatio-temporal perspective. The first two factors of landscape dryness and potential fire spread predispose a landscape to a LLF while ignition in some form realises the risk of
occurrence of a LLF. As Malcolm Gill (2005:67) states: ‘The greatest chance of large and destructive fires occurs when the fuels have reached maximum quantity, are continuous over a large region, are in an extremely dry state, and are subject to a strong dry wind in an unstable atmosphere.’
terrain, vegetation, and climate. That is, even the damper and moister areas in the landscape, such as sheltered wet forests, become dry and available to burn as part of a LLF.
The first predisposing factor of landscape dryness is a seasonal process governed by the levels of dryness reached in vegetation and soil domains. The level of dryness attained in a year is a cumulative function of seasonal daily levels of solar radiation and rainfall. Whilst the drying out of soils and vegetation is a seasonal annual process, accumulated levels of dryness in the soils and underlying regolith can last for several years, generally termed extended drought. Landscape dryness encompasses two critical factors in fire susceptibility at the landscape scale: fuel combustibility and vegetation flammability. The first term ‘fuel combustibility’ refers to the ease at which dead forest fuels can catch fire and sustain flaming combustion. The second term ‘flammability’ refers to the ease with which live forest fuels, particularly leaves and small twigs, can ignite and burn, upon being heated from the flames produced by dead forest fuels (Anderson, 1970). Therefore, it is imperative to know when these highly combustible and flammable conditions exist in a landscape in order to anticipate when a LLF might occur. These fire-susceptible conditions take time to develop – usually over a season and occasionally across seasons and years.
Seasonal climate
and weather
Vegetation and soil domain
Daily all-wave net radiation
Evaporation
Daily weather
Potential fire spread
Vegetation
Daily rainfall
Potential human or lightning ignition
Fuel combustibility Vegetation
flammability
Soil
Large landscape fires
Fuel continuity across the landscape
Landscape dryness
Seasonal climate
and weather
Vegetation and soil domain
Daily all-wave net radiation
Evaporation
Daily weather
Potential fire spread
Vegetation
Daily rainfall
Potential human or lightning ignition
Fuel combustibility Vegetation
flammability
Soil
Large landscape fires
Fuel continuity across the landscape
[image:20.595.113.548.369.669.2]Landscape dryness
Figure 1.1 Key factors in landscape susceptibility to large fires
Notes: (1) Soil dryness is used as an indirect measure of fuel combustibility and vegetation flammability, given that these factors are not estimated directly.
The approach in this study necessitates monitoring the state of historical conditions of the seasonal factor in landscape susceptibility to large fires — landscape dryness. A daily soil water balance model (DSWBM) is one simple way to assess the state of historical soil dryness and hence vegetation and landscape dryness, based on weather data from one or more
representative weather stations.
The equation for a DSWBM takes the general form:
O TA Q Q
E -P
MS
(mm d-1). Equation 1.1
where MS is the change in soil moisture store, P is the daily precipitation, EA is actual
total evaporation; QO is the runoff via overland flow above the soil surface; and QT is
the runoff via through-flow within the soil and the immediate sub-soil.
Equation 1.1 represents the state of balance between the processes of rainfall, evaporation, and run-off at a landscape scale. This soil moisture balance can be monitored using a variety of drought or soil moisture indexes, such as the Keetch-Byram Drought Index (KBDI) (Keetch and Byram, 1968), the Palmer Drought Index (PDI) (Palmer, 1965), the Mount Soil Dryness Index (Mount, 1972) and the Fowler soil water balance model (F-SWDBM) (Fowler, 1992; 1994). These soil water balance models (DSWBMs) can be set up at a representative point in a catchment or a region to model hydrological processes using one set of model parameters (Fowler and Adams, 2004). The change of soil moisture conditions can be monitored through time using an index of soil moisture deficit, termed the Soil Dryness Index (SDI) in the MSDI model, or Soil Water Deficit (SWD) in the F-SWDBM model. In this study, the term SWD is used and is defined similarly to the SDI as ‘the amount of effective rainfall required to bring the soil back up to field capacity’ (Mount, 1972:4).
Daily interactions between atmospheric moisture, such as water vapour pressure and cloud cover, and extra-terrestrial radiation (RA), drive all-wave net radiation (RN) (Budyko, 1974;
Oke, 1987; Ward and Robinson, 2000). The fraction of the all-wave net radiation reaching the forest canopy and the soil surface governs potential evaporation (EP). EP is the maximum
evaporation that can take place from a surface fully saturated with water over a specified time (Lhomme, 1997). It is affected by: (1) the stage in the seasonal cycle, (2) the latitudinal position (Budyko, 1974; Iqbal, 1983; Oke, 1987; Roderick, 1993), (3) the position in the landscape such as topographic position, slope, and aspect (Iqbal, 1983), and (4) the vegetation and soil cover (Budyko, 1974; Berry, 2001; Berry and Roderick, 2004; Berry et al., 2006). The proportion of EP converted into actual evaporation (EA) is in turn influenced by the seasonal
patterns of rainfall that regulate soil moisture and vegetation conditions, such as vegetation canopy cover and plant vigour.
atmospheric instability, and wind speed. Day-to-day fire weather is generally difficult to forecast over periods longer than a week, although the weather patterns during the year conform to a natural range of means and expected variability based on our knowledge of historical climate in a region. The daily fire weather can be at times quite stable yet at other times quite chaotic and unpredictable. The influence of fire weather is considerable given that it can cause dry vegetation and fuels to dry out in the lead-up to the peak period of fire susceptibility and drive severe fires if ignited.
Monitoring the interactions between landscape dryness and daily fire weather is achieved using an index of potential fire spread, which functions at much shorter time scales than the seasonal landscape dryness factor. A potential fire spread index (PFSI) estimates rate of spread and potential fire intensity at a given place through time. A potential fire spread index
combines three factors: fuel availability, fuel moisture levels in fine and coarse fuels, and average wind speed (McArthur, 1967; Van Wagner, 1987).
A drought index, hereafter in this study referred to as a landscape dryness index, indirectly estimates the first factor in a PFSI: availability of both fine and coarse dead fuels for a
representative vegetation type. As there is no direct physical correlation between fuel
availability and a drought or soil moisture index, the relationship has to be created empirically. This necessity led McArthur to devise a simple drought factor based on the Keetch-Byram Drought Index (KBDI) and the number of days since rain (McArthur, 1967). The Soil Dryness Index model (SDI) was developed in 1972 in response to research concerns about the
applicability of the KBDI to Australian conditions (Mount, 1972). Judging by the absence of papers in the literature, the KBDI has never been formally calibrated in south eastern Australia. The Mount Soil Dryness (MSDI) model was calibrated first at Lidsdale near Lithgow in New South Wales, based on a comparison of soil moisture and run-off data, and then on a limited number of catchments in Tasmania (Mount, 1972).
The second factor in a PFSI, fuel moisture, is one measure of the ignitability and combustibility of the surface dead fuels on the forest floor. Ambient temperature, relative humidity, recent rainfall effects, and, to some extent, solar radiation and wind speed govern fuel moisture levels of the different fuel components on the forest floor (Byram and Jemison, 1943; Van Wagner, 1987).
The third factor in a PFSI is wind speed. Under extreme wind conditions, a PFSI indicates levels of extreme fire behaviour once soil, vegetation, and coarse fuels moisture content
(landscape dryness) as well as fine fuel moisture have fallen below critical levels. Knowing when in which part of the fire season, the extremes of fire weather might occur are thus fundamental for understanding the fire susceptibility of a given forested catchment or region.
and hence is potentially misleading. When estimating potential fire spread, a PFSI assumes a basic constant set of fuel conditions, such as fuel loads, fuel arrangement, and fuel compaction. Other factors affecting fire spread, such as elevation, slope, aspect, and topographic position, are kept constant.
The Forest Fire Danger Index (FFDI) has served as an index of fire danger in forest settings in Australia since the 1960s (McArthur, 1966; 1967). The FFDI is a simple numeric index, scaled from 0-100, representing the range of potential fire spread for a constant set of fuel conditions. Much of McArthur’s fire behaviour research was based on point observations of the relationships between fuel, fire weather and fire behaviour and then extrapolated to a range of forest environments in Australia (Dudley, 2003). Field-testing and verification of the Australian models of potential fire spread have not been undertaken in different regional and local
situations as would appear warranted.
A possible alternative to the FFDI is the Fire Weather Index (FWI) — a component of the Canadian Forest Fire Danger Rating System (CFFDRS) used in the boreal and wet temperate forests of Canada. The FWI was originally derived to assess fire behaviour potential in Canadian boreal pine forests (Van Wagner, 1987). It has since been adapted to forecast fire danger in a wide variety of environments in the world including: boreal forests in Alaska and Sweden, tropical rainforests in Indonesia and Malaysia; grasslands, shrublands and exotic pine plantations in New Zealand and Fiji; Mediterranean pine forests and shrublands in Portugal, Spain, Italy and Greece (Taylor and Alexander, 2006; Wotton, 2008). The FWI incorporates indices of landscape dryness, fuel moisture, fuel availability and fire weather as separate discrete modules (Van Wagner, 1987). This type of approach enables parts of the FWI system to be tested and validated independently and then combined later. While the CFFDRS system has been adapted to New Zealand conditions (Fogarty et al., 1998a), limited testing of the CFFDRS has been done for Australian pine plantations (Alexander, 1998), but not for
Australian eucalypt forests. The distinct advantage of the FWI in the CFFDRS over the FFDI model of fire weather is the simplicity, generality and transparency of the tightly integrated fuel moisture and fuel availability components of the FWI.
The basic shortcomings of soil water deficit and potential fire spread models used in Australia are:
(1) they have not been adequately tested in a range of spatial and temporal conditions; (2) these models have not been tested within a process-based framework and they should
not be extrapolated beyond known equations and observed data;
(3) the models have been applied in widely varying conditions without firstly being calibrated;
(5) an uncalibrated untested model may lead to false assumptions and decisions being made in field applications.
The errors associated with the use of models could lead to a failure to recognise severe fire conditions characteristic of LLFs, with potentially catastrophic consequences. This is an example of a type II error (errors of omission or false negative result) causing a failure to forecast a LLF (Taylor and Alexander, 2006). Thus, it is vital that the models of landscape dryness and potential fire spread are calibrated or checked before they are applied under operational conditions.
To overcome the above model limitations and shortcomings, this study selects models that represent the biophysical processes of landscape dryness and potential fire spread as closely as possible. For instance, landscape dryness models should be founded on tightly integrated eco-hydrological processes within vegetation ecosystems in a region. By relating the indices of fire susceptibility to biophysical processes in a landscape, critical values can be identified that mark significant changes in fuel combustibility and vegetation flammability. The critical thresholds of fire susceptibility then have some basis in reality. For instance, when a value of an index of landscape dryness has been surpassed, we can expect to find deeply dried soil profiles, cured grasses and herbs, recognisable plant stress in vegetation and negligible water flow in major streams. By monitoring and recognising these features in the landscape through simple landscape dryness indices, we should be better able to anticipate the tipping point in landscape susceptibility to large fires that lead to a high risk of LLFs. We can also anticipate when severe fire weather conditions, when combined with very dry landscape conditions, can lead to severe and destructive fires, as evidenced by the loss of life and property in the February 2009 fires in Victoria.
1.2 Significance and relevance of the study
The south eastern corner of Australia has been subject to large, if sometimes catastrophic, fires since European fires since European settlement. Most of the largest and most damaging fires have occurred in the dry and wet sclerophyll forests in the coastal and hinterland mountain ranges along the Great Dividing Range between Melbourne and Sydney. The two most severe fires have been the February 6th 1851 and January 13th 1939, mainly in Victoria but extending
into southern New South Wales. These fires are estimated to have burnt five and three million hectares respectively. The three factors involved were prolonged drought, followed by a searing prolonged heat wave, and culminating with a day of extremes temperatures (45-47 oC) and gale force winds. Just recently, the February 7th 2009 fires in Victoria had comparable fire weather
There have been other fire seasons in southern eastern Australia with LLFs but with not quite the severity and impact of the fire seasons of 1851/52, 1938/39, and 2008/09. In these cases, extensive droughts and short spells of severe to extreme fire weather resulted in LLFs in 1897/98, 1905/06, 1925/26, 1931/32, 1943/44, 1951/52, 1964/65, 1968/69, 1982/83 up until 1993.
Since 1994, there has been a run of relatively frequent fire seasons at intervals from two to four years in south eastern Australia. In the northern part, in the Sydney sandstone basin, between 500,000 and 1,000,000 ha of forest were burnt during the 1993/94, 1997/98, 2001/02, and 2002/03 fire seasons. Further south, in the Victorian and NSW Alps, between 1,200,000 and 1,300,000 ha of montane and sub-alpine forest were burnt on two occasions, in 2002/03 and 2006/07 , and most recently, 430,000 hectares were burnt on a single day on February 7th in
2008/09 (Australian Bureau of Statistics, 2003; Department of Sustainability and the
Environment, 2009). Because of the recent LLFs in the last decade, large areas of burnt-over forest are now in a highly vulnerable condition requiring decades of protection and management to facilitate their reversion to more mature forests. Their protection from future devastating LLFs will become increasingly important in the years to come. Otherwise, large areas of forest will remain in a permanent regrowth state that will facilitate future LLFs.
At a global scale, LLFs have become more widespread and more frequent in sub-tropical, temperate, and boreal forests in the last 20 years, compared with the last one hundred years. This trend is expected to continue with the most recent International Panel of Climate Change report concluding that forest fires are likely to become more frequent, larger and more intense in these regions (IPCC, 2007a; IPCC, 2007b). In the forests of Northern America and Canada a significant increase in the occurrence of LLFs has been reported in the last 25 years (Flannigan and Wotton, 2001; Westerling et al., 2003). The IPCC report also concluded that there could be an increase in frequency of droughts in many parts of the world, including SE Australia, with a likely increase in frequency and severity of LLFs.
A medium or long-term retrospective view of the full range of landscape dryness, potential fire spread, and lightning ignition in a regional landscape can increase our knowledge and understanding of the conditions under which LLFs have developed in the past. This long-term view could then assist in the anticipation and preparation of such events by:
(1) interpreting the potential for LLFs in any given fire season by comparing the present conditions of landscape dryness and fire spread potential with the historical seasonal profiles of these factors in past fire seasons;
(3) knowing when lightning ignition has coincided with very dry landscapes and runs of severe fire weather, and using this knowledge to predict when dry thunderstorms are likely to start fires on any given day during a fire season.
This study seeks to develop a deeper knowledge of the temporal variations in conditions of landscape dryness, fire weather and lightning ignition, which together shape the potential for a LLF in any given fire season, using locally calibrated indices. The study also uses the concepts of threshold values of landscape dryness and potential fire spread to find out in what part of a fire season the potential for a LLF exists. To derive these threshold values requires appropriate and accurate models of landscape dryness and potential fire spread.
The philosophy behind this study is that the concepts and methods can be applied to other regions in south eastern Australia to anticipate potential lethal combinations of highly
flammable landscapes with extremes of fire weather, which devastated Victoria and elsewhere in south eastern Australia in recent fire seasons: 2002/2003, 2006/07, and 2008/2009. The practical application to field management is via three key steps: first, the careful evaluation of the weather data and suitable models; second, the verification and validation of the outputs from the models; third, the analysis and interpretation of landscape susceptibility to fire, based on the models; and fourth, relating the results to the wider temporal and spatial context.
1.3 Thesis topic
This dissertation develops a method for analysing and interpreting reconstructed historic fire susceptibility of the ACT region’s forested landscape, using two daily indicators of fire susceptibility: landscape dryness and potential fire spread. The other factor in a landscape’s susceptibility to large fires, fire ignition, is considered briefly in terms of daily lightning ignition potential.
The thesis represents an exploration of the seasonal and longer-term temporal views of landscape susceptibility to large fires based on (1) landscape dryness and (2) potential fire spread, based on the most realistic models and data available within a region.
The approach taken and the philosophy underlying are to examine and then combine the different temporal views to assess:
(1) how landscape susceptibility to LLFs has varied through time;
(2) to find out specifically in which fire seasons and in what part of these seasons the highest potential for LLFs has existed; and
(3) to determine any discernible trends in year-to-year or decade-to-decade potential for LLFs in the fire season record.
The thesis sets out to model fire susceptibility using the most reliable and accurate weather records available locally. The yearly fire seasonal profiles, based on year-day number, serve as a standard basis for short, medium, and long-term comparison of the trends, sequences, and types of fire seasons. These annual profiles also support classification methods allowing classification of fire seasons into a small number of categories or types. Two views of the yearly profiles are developed: one is based on an index of landscape dryness and the other is based on an index of potential fire spread. These two factors are not independent – potential fire spread indices take into account landscape dryness, which is an indirect surrogate for fuel availability and continuity, and to a lesser extent vegetation flammability (McArthur, 1962a; McArthur, 1967; Deeming et al., 1978; Van Wagner, 1987).
Where possible, calibrated and validated models, used to evaluate landscape susceptibility to large fires, are employed. The approach is based on the selection and development of models of the indices that reflect biophysical processes as closely as possible. For instance, the process of daily evaporation equates to known or estimated evaporation from soil and vegetation, and this leads to levels of soil moisture in a catchment that produce known levels of water run-off.
This means testing the validity of hydrological processes within a daily soil water balance model such as soil evaporation, plant transpiration, and interception of rainfall. In the case of an index of potential fire spread, this has meant selecting one that best represents the state of seasonal fuel and fire weather in any given part of a fire season.
Daily weather data (1940-2007)
Daily all-wave net radiation
All-wave net radiation Soil Dryness Index (RSDI)
Fire Danger Rating Systems (FFDRS) Landscape dryness (1871-2007) Evaluation & selection of PFSI for
study
Daily lightning ignition data
Fire season calendar
Classification of fire seasonal profiles: Landscape dryness Potential fire spread index
Medium & long-term variability of landscape dryness
Threshold values of landscape dryness & potential fire spread for a LLF
Identification of past fire seasons with highest susceptibility to LLFs Literature-based
landscape dryness threshold values to
LLFs
Potential lightning ignition
model Calibration and
evaluation of daily soil water balance
models
Daily potential fire spread index
(PFSI)
Daily rainfall data (1871-2007)
Medium-term Mount Soil Dryness Index
(MSDI)
Fowler daily soil water balance model
(F-DSWBM)
Long-term
Classification of fire seasonal profiles: Landscape dryness Fowler daily soil water
balance model (F-DSWBM)
Threshold value of landscape dryness
for a LLF Fire season calendar Landscape dryness (1940-2007) Daily weather data (1940-2007) Daily all-wave net radiation
All-wave net radiation Soil Dryness Index (RSDI)
Fire Danger Rating Systems (FFDRS) Landscape dryness (1871-2007) Evaluation & selection of PFSI for
study
Daily lightning ignition data
Fire season calendar
Classification of fire seasonal profiles: Landscape dryness Potential fire spread index
Medium & long-term variability of landscape dryness
Threshold values of landscape dryness & potential fire spread for a LLF
Identification of past fire seasons with highest susceptibility to LLFs Literature-based
landscape dryness threshold values to
LLFs
Potential lightning ignition
model Calibration and
evaluation of daily soil water balance
models
Daily potential fire spread index
(PFSI)
Daily rainfall data (1871-2007)
Medium-term Mount Soil Dryness Index
(MSDI)
Fowler daily soil water balance model
(F-DSWBM)
Long-term
Classification of fire seasonal profiles: Landscape dryness Fowler daily soil water
balance model (F-DSWBM)
Threshold value of landscape dryness
for a LLF Fire season calendar Landscape dryness
[image:27.595.133.533.459.749.2](1940-2007)
1.4 Research questions and organisation of the
remainder of the thesis
The study is organised into 10 chapters that detail the steps and processes required to model and interpret the key indicators of landscape susceptibility to large fires. The organisation of the study is based on the approach shown in Figure 1.2 and the key research questions that relate to the development of the model of landscape susceptibility to large fires. Each chapter is based upon one or more key research questions that together provide the research framework for the topic (Table 1.1). Chapters 3-7 involve the selection of models and collation of the necessary data in order to prepare the time series of the fire susceptibility datasets for analysis. Chapters 8-9 involve the detailed interpretation of landscape susceptibility to large landscape fires in the medium and long-term perspectives.
In subsequent chapters, the topic of landscape susceptibility to large fires is dealt with as follows.
Chapter 2 describes the study setting in terms of local climate, topography, vegetation, and soils. Despite the heterogeneity of the ACT region’s landscapes, the study aims to model landscape dryness in at least two of its three climatic provinces (modified Koëppen provinces Cfa and Cfb) and potential fire spread in at least one (Cfa).
Chapter 3 first outlines which daily soil water balance models are best suited to the study of medium and long-term landscape dryness. Next, a net radiation-based daily soil water balance model is developed from the Mount Soil Dryness Index (MSDI), using equations for soil evaporation and plant transpiration sourced from the literature that best replicates real world processes and conditions. The models for these two evaporation processes are shown to
substitute successfully for the more general evaporation evapotranspiration model used in the MSDI model.
Chapter 4 outlines the ideal modelling framework and assesses which weather stations have the necessary data at the standard specified for this study. Based on those weather stations with suitable weather datasets, the modelling framework is modified to fit the best available weather data. The last part of the chapter focuses on (1) the standards of weather data standards, (2) the availability of weather datasets that meet those standards, (3) the
Table 1.1 Research questions dealt with in subsequent chapters
Chapter Research Question
Chapter 2 (1) How feasible is it to apply a simple temporal model of landscape susceptibility to large fires to a region with wide ranging climate, topography, vegetation, soils, and fire history?
(2) Which daily soil water balance model (DSWBM) is best suited to the study of landscape dryness over the medium and long term?
Chapter 3
(3) Can simple and elegant sub-models of soil evaporation and plant transpiration replace evapotranspiration models?
Chapter 4 (4) As part of the ideal modelling framework for this study, what datasets for medium and long-term indices of landscape dryness and potential fire spread can be constructed for each of the three climate zones?
Chapter 5 (5) Can all-wave net radiation (RN) and its components be estimated to sufficient levels of accuracy as a precursor to estimating potential evaporation (EP)?
Chapter 6 (6) Which daily soil water balance models best approximate the hydrological processes of evaporation, run-off, and soil water deficit and should be used for further analysis of landscape susceptibility to large fires?
(7) Can a threshold of soil water deficit (SWD) indicate a realistic threshold for fuel availability, combustibility, and vegetation flammability in a forested landscape?
Chapter 7
(8) Which of the PFSI models is the most transparent and explicit, and best integrates the factors involved in estimating potential fire spread?
(9) Does redefining the season and the periods within a fire season using fire susceptibility criteria, such as landscape dryness, fine fuel moisture, and potential fire spread, produces a more meaningful definition than previous definitions?
(10)What can classification and time series analysis of landscape dryness and potential for high fire spread reveal about landscape susceptibility to LLFs in the medium-term?
Chapter 8
(11)Can a model based on particular combinations of landscape dryness and weather predicts the potential for lightning ignition in the ACT region?
Chapter 9 (12)What does a broader temporal and spatial view of fire susceptibility tell us about its long-term history, climatic factors and influences contributing to it?
Chapter 6 first describes the methods used to calculate Soil Water Deficit (SWD) based on the three daily soil water balance models selected for this study. The validity of the estimates of soil evaporation and plant transpiration produced by the new radiation-based soil water balance model (RSDI) is then assessed. Finally, the daily soil water balance models are evaluated to determine which of these produce the most consistent and representative annual profiles of landscape dryness for a medium and long-term analyses in Chapters 8 and 9.
Chapter 7 first examines how daily soil water balance models are used to estimate
indirectly availability of fuels to burn in a forest, which is a critical component of a potential fire spread index. Thresholds for very dry to extreme levels of landscape dryness drawn from the literature are formulated from known studies from Australia and overseas. These studies demonstrate that availability of fuels to burn and vegetation flammability can suddenly change once critical moisture levels in vegetation and fuel are reached after extended dry periods. The last part of the chapter outlines the structure and variables of the two potential fire spread indices, FFDI and FWI, for interpreting landscape susceptibility to large fires based on medium-term time weather datasets.
The first part of Chapter 8 proposes a new fire season calendar for the ACT region based on average daily values of fire susceptibility criteria: landscape dryness, fine fuel moisture, and potential fire spread. The new definition of seasons within a fire season is then used to derive a seasonal marker for determining when extremes of landscape dryness and potential fire spread occur within a fire season. Hierarchical classification of the annual profiles in each fire season since 1951 is then applied to both medium-term datasets of landscape dryness and potential fire spread to investigate the number, type, and severity of groups and sub-groups of fire seasons. The sequence of the groups of fire seasons based on the preferred fire potential index was then analysed to determine two aspects of landscape susceptibility to large fires: (1) what has been the sequences of groups of fire seasons and (2) which fire seasons in what fire season groups have had the highest likelihood for LLFs. Threshold values for landscape dryness and potential fire spread are then identified for this region, and are used to determine which months in the fire calendar are most prone to LLFs and in which fire seasons there has been the highest likelihood for LLFs. The last part of the chapter investigates a model of the landscape and weather conditions conducive to lightning ignition, as well as other concurrent indicative information about the state of the atmosphere, such as vertical profiles of temperature and air moisture content. Detailed conclusions derived from the medium-term interpretation of landscape susceptibility to fire are provided at the end of the chapter.
the Fowler daily soil water balance model and rainfall records from Queanbeyan weather station, which is closely correlated to the Canberra Airport medium-term rainfall dataset. This chapter presents the findings of the longer-term classification of fire seasons and compares the major fire seasons extracted from the analysis to those found in historical fire chronologies in and adjoining the ACT region. Finally, this chapter discusses the results of the medium-term and long-term time series of landscape dryness and potential fire spread in relation to the climatic and weather processes that produce dry landscapes, potential for high fire spread, and lightning ignition.
Chapter 10 first summarises the principal findings from each of the chapters (Chapters 2-9). Limitations of the research method, as wells as the models and data, are reviewed.
Chapter 2: Study Region
This chapter describes the study region at a continental and regional scale, and discusses other factors such as the recent climate, topography, dominant vegetation and soil types, and fire history. Apart from providing a context, these contextual factors show why the ACT region is well suited to a study of fire susceptibility, even though its landscapes, vegetation, and fire history are highly heterogeneous.
2.1 Description of study area and landscape
The study area (1,518,000 hectares within a rectangle with sides 110 km wide and 138 km long) is centred on the city of Canberra (longitude: 149.130; latitude: 35.276 south) in the Australian Capital Territory (ACT) (Figure 2.1). The ACT is located in south eastern Australia about 100 km from the coast and located on a peneplain with a belt of mountain ranges to the west and east ranging in elevation between 600 and 2000 m.
!
149°30'0"E 149°30'0"E
149°0'0"E 149°0'0"E
148°30'0"E 148°30'0"E
148°0'0"E 148°0'0"E
147°30'0"E 147°30'0"E
35°0'0"S 35°0'0"S
35°30'0"S 35°30'0"S
36°0'0"S 36°0'0"S
New South Wales
Victoria
Study Area
"
Australian Capital Territory
Canberra
[image:32.595.129.538.369.647.2]Extant Native Forest
Figure 2.1 The study area shown in inset (top left hand corner) and in relation to the ACT and surrounding land in New South Wales (main