Int. J. Electrochem. Sci., 9 (2014) 2589 - 2602
International Journal of
ELECTROCHEMICAL
SCIENCE
www.electrochemsci.orgThe Mathematical Modelling of the Palladium Deposition/
Dissolution Process by Cyclic Voltammetry Method
Piotr M. Skitał*
Faculty of Chemistry, Rzeszów University of Technology, Powstańców Warszawy 12, 35-959 Rzeszów, Poland
*
E-mail: [email protected]
Received: 27 December 2013 / Accepted: 4 February 2014 / Published: 2 March 2014
The electroreduction of Pd2+ process in 1 M KCl at pH=1 solution by means of cyclic voltammetry and chronoamperometry methods on glassy carbon electrode was investigated. The mathematical modelling of deposition/dissolution of palladium was carried out with the use of the advanced two-plate model. The kinetic parameters of investigated process were evaluated. A change of electrode properties during investigated process, as an essence of applied model, was extensively discussed.
Keywords: Electrochemistry, Mathematical modelling, Palladium electroreduction, Voltammetry.
1. INTRODUCTION
Investigation of deposition/dissolution processes is the topic related to microscopic films, surfaces and coatings. The electrocrystalization processes are very interesting for surfaces structuring and modification in modern micro and nanotechnologies [1,2]. From classical electrodics point of view, preparation of modified electrodes and a change of electrode properties during electrode potential scan are also of importance. Due to theoretical and practical significance of pallad deposition, the process was a subject of many original [3-9], as well as review papers [10,11]. The papers [5,6] describe codeposition of Pd and Cu. A number of papers deal with hydrogen absorption in Pd [7,8,11].
results presented in this paper indicate a large change of electrode properties during the evaluation of electrode process.
The problem of metal deposition/dissolution process at solid electrodes has been investigated by several authors, namely Brainina [12,13], Chevalier and co-authors [14], Mouhandes [15-17], Golgovici and Buda [18] and Grygar [19,20]for metal oxide electro-dissolution. All of these presents experimental data and theories. Advanced mathematical models of respective stripping analysis are described in papers by Compton and co-authors [21-23] and Brainina [24]. In deposition of metals, a characteristic type of experimental CV response is often present: the response in which the reverse current line crosses over the forward deposition line in two points and, as a result, forms a loop on its cathodic part [25,26].
The rigorous general theory, coherently describing the system regarding cathodic-diffusion /anodic-adsorption peaks of different properties at solid electrode has been presented in previous papers [27,28]. The model describes different scan rate experimental responses with the loop on its cathodic parts including description of a change of electrode reaction rate constant during a scan time interval with growing coverage of electrode. The latter problem is connected with under- and over-potential deposition of metals. The model covers not only a range of scan rate values but also different concentrations of reactant.
Mathematical models of deposition/dissolution systems are useful in modelling actual problems which occur in stripping analysis, such as data processing and prediction of current response of multi-component systems and deposits at solid electrodes, including alloys. Actually, there is a need to extend the deposition of metals modelling area on further metals of scientific and technological importance.
2. NUMERICAL PROCEDURES AND EXPERIMENTAL PART
The CV experiments were carried out with the use of PGSTAT100 voltammetric analyzer (Autolab Eco-Chemie). The glassy carbon electrode (GCE) of 2 mm diameter was used. Measurements were carried out at 298 ± 0.1 K. The reference electrode was an aqueous saturated calomel electrode (SCE) separated from the sample solution by a transition vessel with glass sinter. Auxiliary electrode was platinum wire. Chemicals of analytical grade were used. Solutions were deairated with the use of high purity argon.
All errors for determined parameters were expressed by a standard deviation (SD). The nonlinear regression significance was evaluated with the use of the standard deviation mean value ( SD ) which was calculated from formula:
) /( ) -( SD
1
2 i
i yˆ n k
y
n
i
, (1)
where yi – experimental and ŷi – estimated value of current, n – number of points, k – number
of estimated parameters. To enable the comparison and averaging of different scan rate data, the SD values were standardized by dividing by v1/2 factor to obtain SD values. After standardization, the st
data for different scan rate were averaged to obtain the grand average values SDst,ga.
3. RESULTS AND DISCUSSION
3.1. The mathematical model
The two-plate deposition-BET adsorption/dissolution model applied here takes into account the fact that during electrode process a change of electrode properties takes place [27,28]. Generally, as indicated in Introduction, (at least) two different electrode processes are being dealt with: Pd deposition on foreign surface (e.g. GCE) where the potential has to be more negative than on parent metal surface (e.g. GCE/Pd surface) in order to start nucleation process. In other words, the overpotential for the two processes is different.
In considered two-electron electrode reaction runs in consecutive-parallel way on two plates i.e. on two different but mutually dependent parts of electrode surface. The same electrode reaction runs with different rate constant on the two plates:
Pd
Pd
Pd
21
2 1 1
1
1 1
2
kk k
k
e
e
(2)Pd
Pd
Pd
22
2 2 1
2
1 2
2
kk k
k
e
e
(3)where electrochemical (cm s–1) rate constants 1k1 = 1k–1, 1k2 = 1k–2 concern first plate reaction, 2
k1 = 2k–1, 2k2 = 2k–2 concern second plate reaction (the left superscripts denote the number of plate: (1) or (2)).
Mass balance for all species in solution consists of the following set of differential equations written for planar electrode:
2 Pd 2 Pd Pd 2 2 2 x c D t c 2 Pd 2 Pd Pd x c D t c (4) 2 Pd 2 Pd Pd x c D t c
with the following conditions: 1). Initial conditions:
for t = 0 and x > 0: cPd2cPd0 2, cPd0, cPd 0;
for t = 0 and x = 0: ΓPd 0. 2). Boundary conditions:
a). for t > 0 and x = 0 (on electrode surface):
forfor 1 1 s Pd Pd 1 2 1 2 Pd 1 2 1 2 Pd 1 s Pd Pd 1 2 1 2 Pd 1 2 1 2 Pd s Pd Pd 1 1 1 1 Pd 1 1 1 1 Pd 1 s Pd Pd Pd Pd 2 2 2 2 2 , , , , Γ Γ b exp k c a exp k c Γ Γ b exp k c a exp k c Γ / Γ b exp k c a exp k c Γ / Γ x c D (5)
forfor 1 1 s Pd Pd 2 2 2 2 Pd 2 2 2 2 Pd 1 2 1 2 Pd 1 2 1 2 Pd 1 s Pd Pd 2 2 2 2 Pd 2 2 2 2 Pd 1 2 1 2 Pd 1 2 1 2 Pd s1 Pd Pd 2 1 2 1 Pd 2 1 2 1 Pd 1 1 1 1 Pd 1 1 1 1 Pd 1 s Pd Pd Pd Pd 2 2 2 , , , , Γ Γ b exp k c a exp k c b exp k c a exp k c Γ Γ b exp k c a exp k c b exp k c a exp k c Γ / Γ b exp k c a exp k c b exp k c a exp k c Γ / Γ x c
D (6)
forfor 1 1 s Pd Pd 2 2 2 2 Pd 2 2 2 2 Pd Pd 1 s Pd Pd 2 2 2 2 Pd 2 2 2 2 Pd 1 s Pd Pd 2 1 2 1 Pd 2 1 2 1 Pd s1 Pd, Pd Pd Pd Pd , , , Γ Γ b exp k c a exp k c t Γ Γ Γ b exp k c a exp k c Γ / Γ b exp k c a exp k c Γ / Γ t Γ x c
D (7)
F E E RT a i, j i j ij 0
,
F E E RT b i, j i j ij 0
takes place, α and β – cathodic and anodic transfer coefficient, E0 – equilibrium potential of redox couple.
b). For t > 0 and x (in bulk solution):
0 Pd Pd2c 2
c , cPd0, cPd 0 (9)
This condition corresponds to concentrations of species (substrate and products) in the bulk solution. The position of this point from electrode surface depends on diffusion coefficient and experiment time and is considered to be diffusion layer thickness (δ =6 Dt ).
The introduced concept of "two plates model" assumes that electrode process runs with two different rates on two different electrodes i.e. GC (foreign) and Pd (own). That part of the model was mathematically described by two different kinetic equations included into boundary conditions regarding to electrode surface. The surface concentration of Pd (ΓPd) is a decisive parameter here. ΓPd,s1 is surface concentration corresponding to totally Pd covered electrode. When ΓPd < ΓPd,s1 there are two parallel electrode reactions (reduction Pd2+ on GC electrode and reduction Pd2+ on Pd electrode) with gradually increasing reduction of Pd2+ on Pd electrode. When ΓPd ≥ ΓPd,s1 there is only one electrode reaction with reduction Pd2+ on Pd electrode (ΓPd = ΓPd,s1 the degree of deposition achieved monolayer; ΓPd > ΓPd,s1 the degree of deposition achieved more than monolayer (multilayer)). In other words, the diffusion flux is directed to two parallel electrode reactions but the system is dynamic i.e. contribution of the first and second plate in the total flux is time dependent.
In the model, diffusion of species Pd2+, Pd+, Pd (Pd appears in double layer limit only) is considered (set of Eq. (4)). For species Pd, a metal of a very low solubility value, D = 10–20 cm2s–1 was assumed. The value of D for Pd was arbitrary assumed as close to zero what is justified by its physical sense i.e. with the fact that Pd does not move in solution and undergoes very strong adsorption.
Furthermore, adsorption on electrode surface can be described by respective isotherm equation, namely BET model:
) c K c K )( c K (
c K Γ Γ
Pd d Pd 1 Pd
d
Pd 1 s Pd, Pd
1
1
(10)
where the symbols ΓPd,s, K1, Kd correspond to maximum surface concentration of Pd in mol/cm2, adsorption equilibrium constants in BET isotherm, respectively.
The amount of deposited metal is equal to excess surface concentration ΓPd in mol/cm2. It is assumed that ΓPd does not affect any step of electrochemical reaction (2) – (3). A solution of equation set (4) with respective boundary conditions (5) – (10) provides time dependent concentrations of species Pd2+ and Pd+ in solution and species Pd concentration on electrode surface in mol/cm2.
The total current is calculated as the algebraic sum of currents for the two charge transfer reactions and expressed by the equation:
x c FAD x
c FAD I
I I
+
+ +
2 + 2
Pd Pd Pd
Pd 2
1 2 (11)
3.2. Experimental results
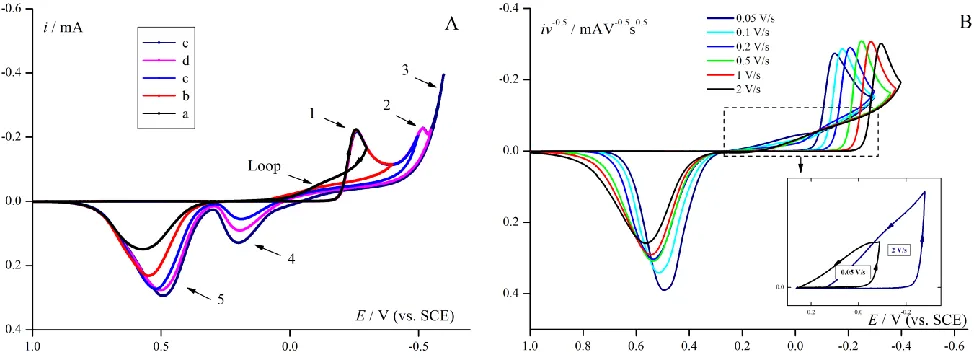
[image:6.596.58.545.331.510.2]In a case of electrochemical deposition/dissolution of palladium in acid solution [3], additionally hydrogen evolution/adsorption processes take place. In order to identify the particular experimental peaks, the five different reverse potentials for CV scans at fixed scan rate were applied (Fig. 1A). The shape of CV response is characteristic for electrodeposition Pd2+ and dissolution Pd layer in acidic solution (scan a,b), furthermore, the hydrogen evolution appears in wider potential scans (scan c,d,e). The Pd2+ ions reduction to metallic Pd starts at about 0.2 V potential and maximum current at – 0.255 V is completed (peak 1). The second small peak (2) is observed close to – 0.516 V potential due to formation of PdHx [56]. Simultaneously, from – 0.4 V hydrogen evolution (wave 3) takes place. On the reverse scan the two peaks appear: the first one (peak 4) is due to the hydrogen anodically stripped from the palladium hydride and the second one (peak 5) corresponds to the palladium dissolution. A characteristic large loop as the intersection effect of the forward deposition and the reverse current lines in two points should be also noticed (Fig. 1 A and B).
Figure 1. (A) Experimental CV responses for electroreduction Pd2+ ions (5 mM solution in 1M KCl at pH=1 on GCE electrode) with different reverse potential. Scan rate 0.5 V/s. (B) Normalized experimental CV curves for Pd2+ reduction for series scan rates from 0.05 to 2 V/s. Inset: selected response for 0.05 and 2 V/s to show the characteristic loop.
For precise determination of kinetic parameters for palladium ions electroreduction, solution composition and potential range were optimized in order to obtain clear response for deposition/dissolution process of palladium (Fig. 1A, peaks 1 and 5). Reduction of hydrogen ions, as well as sorption and desorption of hydrogen into deposited palladium, is a consecutive process here (Fig. 1A peaks 2, 3 and 4). Therefore, shortened CV responses reveal two peaks of Pd2+/Pd system (Fig. 1B) for the series after scan rate normalization. The series of curves does not suggest existence of slow chemical step.
0.4)×10-6
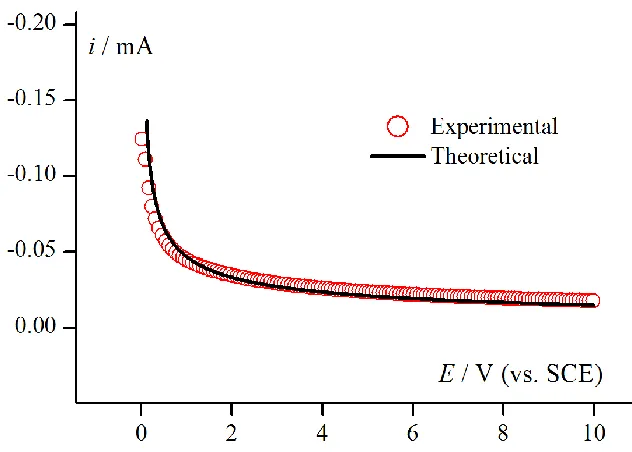
cm s–1, was obtained from scan rate data in the range 0.05 –10 V/s. The second method applies the chronoamperometric (CA) technique [57]. D value (7.51 ± 0.1)×10-6 cm s–1 was obtained by the estimation method with the use of ESTYM_PDE program. Theoretical parameters like k, α and E0 were assumed to keep the process in diffusion controlled area. The comparison between the experiment and the model is presented in Fig. 2. Therefore, for modelling of Pd2+ CV process the value (7.5 ±0.1)×10-6
[image:7.596.135.451.199.425.2]cm s–1 was applied.
Figure 2. Determination of D by CA method. Experimental responses (red points) for electroreduction of Pd2+ (5 mM solution in 1M KCl at pH=1 on GCE electrode) at E1 = – 0.15 V potential and for step time t1 = 10 s. Theoretical response (black line) was obtained for: k1 = k2 = 1 cm s–1, α1 = α2 = 0.5, E0,1= E0,2= 0 V, A = 0.0314 cm2. Estimated value: D = (7.51 ± 0.1)×10-6 cm s–1.
3.3. The comparison of experimental results and evolution of theoretical models
Model I [26] takes into consideration two-electron reaction with adsorption process described with the use mass balance equation on the electrode surface.
Results of modelling were presented in Fig. 3A. Model I, analogous to one applied in literature, does not reproduce characteristic loop on CV responses. Location and height of the cathodic and anodic peaks is different from experimental ones.
Figure 3. Comparison of experimental CV curves (red lines and points) for electroreduction Pd2+ ions (5 mM solution in 1M KCl at pH=1 on GCE electrode) and theoretical curves (black lines and points). Scan rates are from 0.05 to 2V/s. (A): The theoretical curves were calculated according to ModelI. Estimated parameters: k1= (4.1 ± 0.6)×10-5 cm s–1, k2= (2.1 ± 2)×10-3 cm s–1, α1 =α2 = 0.62 ± 0.04, E0,1 = E0,2 = 0.011 ± 0.053 V, SDst=(3.0 ± 0.4)×10–5. (B): The theoretical curves
were calculated according to Model II. Estimated parameters: k1= (6.5 ± 1)×10-6 cm s –1
, k2= (2.0 ± 0.06)×10-4
cm s–1, α1 =α2 = 0.40 ± 0.01, E0,1 = E0,2 = 0.250 ± 0.001 V. BET isotherm parameters: K1 = (1.0 ± 0.7)×105 cm3 mol-1, Kd = (4.4 ± 8)×103 cm3 mol-1, ΓPd,s (mol cm–2) for various scan rate: 0.05 Vs–1 – (4.8 ± 0.2)×10–7; 0.1 Vs–1 – (3.1 ± 0.1)×10–7; 0.2 Vs–1 – (2.1 ± 0.1)×10–7; 0.5 Vs–1 – (1.2 ± 0.05)×10–7; 1 Vs–1 – (7.2 ± 0.3)×10–8; 2 Vs–1 – (4.5 ± 0.3)×10–8,
st
SD =(3.8 ± 0.4)×10–5.
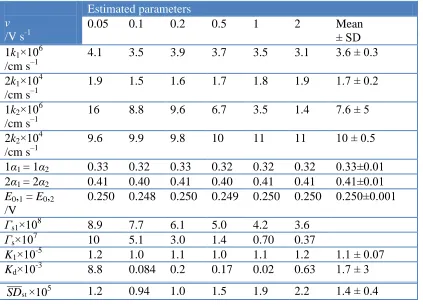
Table 1. Estimated kinetic parameters calculated with the use of Model III fitted to experimental data.
v
/V s-1
Estimated parameters
0.05 0.1 0.2 0.5 1 2 Mean
± SD 1k1×106
/cm s–1
4.1 3.5 3.9 3.7 3.5 3.1 3.6 ± 0.3
2k1×104 /cm s–1
1.9 1.5 1.6 1.7 1.8 1.9 1.7 ± 0.2
1k2×106 /cm s–1
16 8.8 9.6 6.7 3.5 1.4 7.6 ± 5
2k2×104 /cm s–1
9.6 9.9 9.8 10 11 11 10 ± 0.5
1α1 = 1α2 0.33 0.32 0.33 0.32 0.32 0.32 0.33±0.01 2α1 = 2α2 0.41 0.40 0.41 0.40 0.41 0.41 0.41±0.01 E0,1 = E0,2
/V
0.250 0.248 0.250 0.249 0.250 0.250 0.250±0.001 Γs1×108 8.9 7.7 6.1 5.0 4.2 3.6
Γs×107 10 5.1 3.0 1.4 0.70 0.37
K1×10-5 1.2 1.0 1.1 1.0 1.1 1.2 1.1 ± 0.07
Kd×10-3 8.8 0.084 0.2 0.17 0.02 0.63 1.7 ± 3
st
[image:8.596.90.513.469.774.2]
More advanced two-plate Model III takes into account two identical electrode reactions running at two different surfaces of GCE electrode i.e. uncovered and covered with Pd layer.
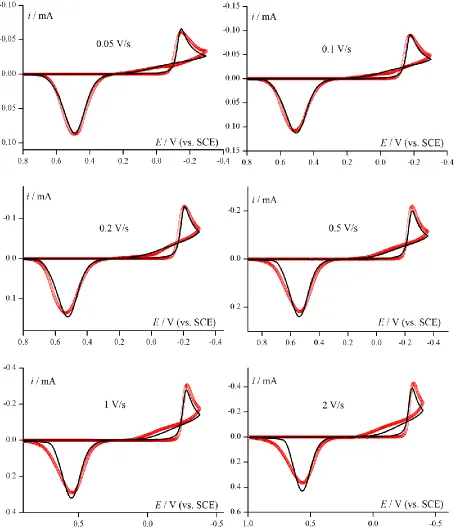
The estimated parameters for Model III were presented in Table 1. The sets of kinetic parameters estimated for particular scan rates from 0.05 to 2 V/s were averaged. On the basis of the obtained mean values of kinetic parameters (Table 1), theoretical CV responses were determined and compared with respective experimental data (Fig. 4 and 6). Additionally, the results of the fits were quantitative expressed by normalized standard deviation SDst presented in Table 1.
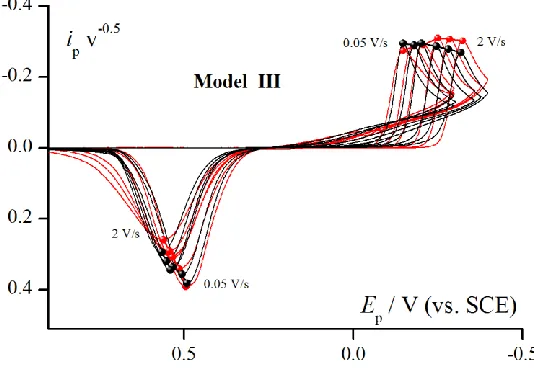
[image:9.596.164.431.258.443.2]The qualitative comparison of experimental and theoretical data was shown in short form in Fig. 4. It enables to compare Models I and II with Model III.
Figure 4. Comparison of experimental CV curves (red lines and points) for electroreduction Pd2+ ions (5 mM solution in 1M KCl at pH=1 on GCE electrode) and theoretical curves (black lines and points) obtained for Model III. Scan rate range: from 0.05 to 2V/s. Estimated parameters are presented in Table 1.
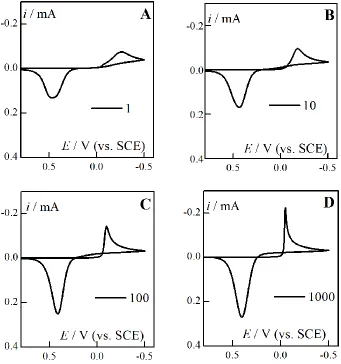
The application of Model III indicates that the two plate reduction approach (5) – (8) is the decisive step in modelling, responsible for creating the characteristic loop (e.g. Fig. 1). In the approach, the two processes with different rate constants are considered, where the ratio of 2k1/1k1 = 47 and 2k2/1k2 = 131 (on the basis of Table. 1). It is easy to show by means of simulation that the higher value of the rate constant ratio corresponds to the greater loop (Fig. 5).
of a metal are decisive at what potential the nucleation starts. The effect may be described by actual E0, η and k value.
The experimental verification of the Model III (Fig. 6) indicates a good fit for complete set of experimental data with one set of kinetic parameters for different scan rates. The model correctly retraces the loop on experimental response.
Figure 5. Theoretical CV responses with the use of Model III. Scan rate 0.2 V/s. The influence of value (2k1)/(1k1) and (2k2)/(1k2) on the shape of the loop (high, width and area) obtained for theoretical CV curves. Kinetic parameters except 2k1, 1k1, 2k2, 1k2 are taken from Table 1. 1k1 = 1
k2 =1×10⁻⁵; 2k2/1k2 = 1000; 2k1/1k1= 1 (A), 10 (B), 100 (C), 1000 (D).
[image:10.596.129.470.185.549.2]
Figure 6. The CV electroreduction of Pd2+ ions (5mM) in 1M KClat pH=1 on GCE (red points). The comparison of experimental (red points) and theoretical (black lines) kinetic runs calculated according to Model III. Kinetic parameters for theoretical CV curves were taken from Table 1. Characteristic loop is visible on both experimental and theoretical responses.
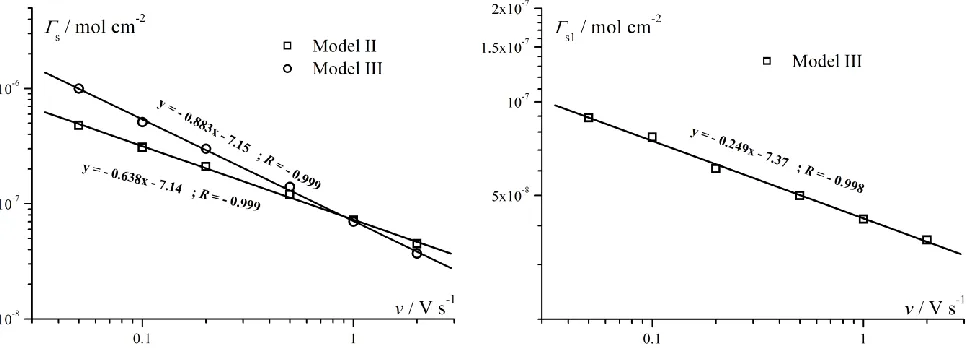
Figure 7. The dependence of determined adsorption parameter Γs and Γs1 vs. scan rate v for Model II and III as well as for Model III, respectively.
Generally, at low scan rate values the morphology of metal deposit is compact and arrayed, whereas at high scan rates incoherent dendrite type structures are possible. Scan rate parameter is not used in electrochemical deposition of metals but in programmed deposition e.g. with changing potential, may extend the scope of metal layer properties control [1,2].
The experimental verification of the three presented models indicates that Models I and II can be treated as the preliminary stage of modelling process. The final Model III allows to fit an extended set of experimental data with one set of kinetic parameters for different scan rates, as well as allows to create loop in the theoretical model.
The proposed model can be successfully applied to other significant deposition/dissolution processes investigated by stripping voltammetry (SV). A mathematical processing of SV analytical data and prediction of the stripping responses for multicomponent systems, significant from practical analysis point of view, will be possible. Besides, the proposed Model III may be useful in modelling of deposition of metals and alloys.
SYMBOLS AND ABBREVIATIONS:
BET Brunauer, Emmett and Teller adsorption model; CA chronoamperometry;
CV cyclic voltammetry; GCE glassy carbon electrode; A electrode surface;
cA, cB, cC actual concentration of species A, B and C in solution; E0 equilibrium potential of redox couple;
Ii, I current of i step, summary current of steps; 1
k, 2k left superscript means reduction on first and second plate, respectively; k electrochemical rate constant;
v scan rate;
α cathodic transfer coefficient;
ΓPd, ΓPd,s actual and maximum surface concentration of species Pd in mol/cm2;
ΓPd,s1 surface concentration at which total passing of reduction on second plate takes place.
ACKNOWLEDGEMENTS
The author is grateful to Professor P. Sanecki for helpful discussions.
References
1. Electrocrystalization in Nanotechnology, G. Staikov, Editor, Wiley-VCH Verlag GMbH & Co. KGAa, Veinheim 2007.
2. Modern Electroplating, M. Schlesinger and M. Paunovic, Editors, John Wiley & Sons, Inc., New York 2000.
3. T. R. Soreta, J. Strutwolf and C. K. O'Sullivan, Langmuir 23 (2007) 10823-10830.
4. H. Scholl, T. Błaszczyk, A. Leniart and K. Polanki, J. Solid State Elektrochem. 8 (2004) 308-315. 5. D. Reyter, D. Bélanger and L. Roué, J. Phys. Chem. C 113 (2009) 290-297.
6. C. Milhano and D. Pletcher, J. Electronal. Chem. 614 (2008) 24-30.
7. A. Czerwiński, I. Kiersztyn, M. Grdeń and J. Czapla, J. Electronal. Chem. 471 (1999) 190-195. 8. A. Czerwiński, I. Kiersztyn and M. Grdeń, J. Electronal. Chem. 492 (1999) 128-136.
9. V. I. Kravtsov and T. G. Nikiforova, Russ. J. Electrochem. 38 (2002) 972-980. 10.Ch. R. K. Rao and D. C. Trivedi, Coord. Chem. Rev. 249 (2005) 613-631.
11.M. Łukaszewski and A. Czerwiński, J. Solid State Electrochem. 15 (2011) 2489-2522. 12.K. Z. Brainina and R. P. Lesunova, Zh. Anal. Khim. 29 (1974) 1302-1308.
13.K. Z. Brainina and M. B. Vydrevich, J. Electroanal. Chem. 121 (1981) 1-28.
14.F. G. Chevallier, A. Goodwin, C. E. Banks, L. Jiang, T. G. J. Jones and R. G. Compton, J. Solid State Electrochem. 10 (2006) 857-864.
15.M. T. Mouhandess, F. Chassagneux, O. Vittori, A. Accary and R. M. Reeves, J. Electroanal. Chem. 181 9(1984) 3-105.
16.M. T. Mouhandess, F. Chassagneux and O. Vittori, J. Electroanal. Chem. 131 (1982) 367-371. 17.M. T. Mouhandess, F. Chassagneux, B. Durand, Z. Z. Sharara and O. Vittori, J. Mater. Sci. 20
(1985) 3289-3299.
18.Golgovici, F., Buda, M., Chalcogenide Lett. 10 (2013) 325 - 334. 19.T. Grygar, J. Solid State Electrochem., 2 (1998) 127-136.
20.T. Grygar, F. Marken, U. Schröder and F. Scholz, Collect. Czech. Chem. Commun. 67 (2002)163-208.
21.S. E. Ward-Jones, F. G. Chevallier, Ch. A. Paddon and R. G. Compton, Anal. Chem. 79 (2007) 4110-4119.
22.S. E. Ward-Jones, S. H. Zheng, C. A. Jeffrey, S. Seretis, S. Morin and R. G. Compton, J. Electroanal. Chem. 616 (2008) 38-44.
23.S. E. Ward-Jones, F. W. Campbell, R. Baron, L. Xiao and R. G. Compton, J. Phys. Chem. C 112 (2008) 17820–17827.
24.K. Z. Brainina, L. G. Galperin and A. L. Galperin, J Solid State Electrochem. 14 (2010) 981-988. 25.R. Greef, R. Peat, L. M. Peter, D. Pletcher and J. Robinson, Instrumental Methods in
Electrochemistry, J. Wiley& Sons, Chichester 1985, p. 211.
27.P. T. Sanecki, P. M. Skitał and K. Kaczmarski, Electrochim. Acta 55 (2010) 1598-1604. 28.P. Skitał and P. Sanecki, Russ. J. Electrochem. 48 (2012) 797-803.
29.P. Sanecki and P. Skitał, Comput. Chem. 26 (2002) 297-311.
30.P. Sanecki, C. Amatore and P. Skitał, J. Electroanal. Chem. 546 (2003) 109-121. 31.P. Sanecki, P. Skitał and K. Kaczmarski, Electroanalysis 18 (2006) 595-604. 32.P. Sanecki, P. Skitał and K. Kaczmarski, Electroanalysis 18 (2006) 981-991. 33.P. Sanecki and P. Skitał, J. Electrochem. Soc. 154 (2007) F152-F158.
34.P. Sanecki and P. Skitał, Electrochim. Acta 52 (2007) 4675-4684. 35.P. Sanecki and P. Skitał, Electrochim. Acta 53 (2008) 7711-7719. 36.P. M. Skitał and P. T. Sanecki, Polish J. Chem. 83 (2009) 1127-1138.
37.P. M. Skitał, P. T. Sanecki and K. Kaczmarski, Electrochim. Acta 55 (2010) 5604-5609.
38.P. Sanecki and P. Skitał, Mathematical Modeling of Electrode Processes - Potential Dependent Transfer Coefficient in Electrochemical Kinetics, in: Recent Trend in Electrochemical Science and Technology, U. K. Sur, Editor, InTech, Croatia 2012, p. 53-90.
39.D. Britz, Digital Simulation in Electrochemistry, Springer, Berlin 2005.
40.D. K. J. Gosser, Cyclic Voltammetry: Simulation and Analysis of Reaction Mechanisms, VCH Publishers Inc., New York 1993.
41.B. Speiser, Numerical Simulation of Electroanalytical Experiments: Recent Advance in
Methodology, in: Electroanalytical Chemistry, A Series of Advances, A. J. Bard and I. Rubinstein, Editors, vol. 19, Marcel Dekker, Inc., New York 1996.
42.A. J. Bard and L. R. Faulkner, Electrochemical Methods, Fundamentals and Applications, Wiley, New York 2001.
43.L. K. Bieniasz and D. Britz, Polish J. Chem. 78 (2004) 1195-1219. 44.L. K. Bieniasz and H. Rabitz, Anal. Chem. 78 (2006) 8430-8437.
45.S. W. Feldberg, in: Electroanal. Chem., A. J. Bard, Editor, vol. 3, p. 199, Marcel Dekker, New York 1969.
46.A. W. Bott, S. W. Feldberg and M. Rudolph, Curr. Seps. 15 (1996) 67-71. 47.A. W. Bott, Curr. Seps. 19 (2000) 45-48.
48.L. K. Bieniasz, Comput. Chem. 21 (1997) 1-12.
49.J. Villadsen and M. L. Michelsen, Solutions of Differential Equation Models by Polynomial Approximation, PrenticeHall, New York 1978.
50.K. Kaczmarski, M. Mazzotti, G. Storti and M. Morbidelli, Comput. Chem. Eng. 21 (1997) 641-660. 51.H. Kim, K. Kaczmarski and G. Guichon, Chem. Eng. Sci. 60 (2005) 5425-5444.
52.H. Kim, K. Kaczmarski and G. Guichon, Chem. Eng. Sci. 61 (2006) 1118-1121. 53.H. Kim, K. Kaczmarski and G. Guichon, Chem. Eng. Sci. 61 (2006) 5249-5267. 54.D. W. Marquardt, J. Soc. Indust. Appl. Math. 11 (1963) 431-441.
55.R. Fletcher, A modified Marquardt sub-routine for nonlinear least squares, AERE-R6799-Harwell 1971.
56.J. A. Abys and C. A. Dullaghan, in: Modern Electroplating, M. Schlesinger and M. Paunovic, Editors, fourth ed., p. 483-553, John Wiley and Sons, New York2000.
57.O. V. Klymenko, R. G. Evans, Ch. Hardacre, I. B. Svir and R. G. Compton, J. Electroanal. Chem. 571 (2004) 211–221.