Apparent dryland salinity on the uplands
of southeastern Australia:
quantification of biotic and abiotic
indicators, causes, mechanisms,
processes and effects
by
Glen Bann
Submitted in fulfilment of the requirements for the degree of Doctor of Philosophy
Candidate's Declaration
This thesis contains no material which has been accepted for the award of any other degree or diploma in any university. To the best of the author’s knowledge, it contains no material previously published or written by another person, except where due reference is made in the text.
ACKNOWLEDGEMENTS and THANK-YOUS
Due to the multidisciplinary nature of the research, many people assisted...
Richard Arculus for supporting my scholarship application and continued encouragement, David Hilhorst for guided tours around the dryland salinity sites near Boorowa; Brian Cumberland for initial site
suggestions and ideas; Kevin Baker and Peter Brown for providing information and ongoing access to my sites; Don Stazic for attaining difficult to get government reports; Dean (Carrot) Wheeler and Ken
England for expert training in fox detection pre thesis times; David Tongway for initial soily discussions, a training day in the field for his LFA procedure and ideas as to how to construct the respirometers; Nico Marcar for initial discussions re salinity and plants; Theo Evans for termite discussions and insect/spider identification; Brian Tunstall for a number of initial useful discussions that helped congeal observations and ongoing advice and encouragement; Geoff Baker for worm identification and ecology discussions; Ann Cowling, Emlyn Williams and Colin Matheson for statistical analyses assistance; Rex Wagner for a couple of interesting and useful discussions on the bigger picture; Nik Henry and John Spring for the loan of the EM38 and EM31 respectively; Rachel Nanson for editing many early papers and help in the field; Gerald Nanson for useful discussions and encouragement; Bill Semple for editing early papers and plant identification assistance; John (and Susan) Rowntree for assistance, support and encouragement; Mauro Davanzo for cutting up the hundreds of log discs, on two occasions; ACT Forests and ACT Urban Services for providing the pine and red gum logs for the log discs; Adam Smiarowski and Jim Macnae for
producing the EM inversion analyses; Richard Hobbs for an early discussion; John Williams for attending an exclusive extended seminar and providing useful feedback; Marcus Hardie for providing an
interesting route of Tasmanian salinity sites; Clive Malcolm for providing an enlightening salinity route through the WA Wheatbelt; Willem Vervoort for a number of useful discussions regarding soils and the EM; Clive Hilliker for producing countless conference posters over the years, many at the last minute; Sarah O’Callaghan for efficient attention to equipment and administration requests; Lorna Fitzsimmons for the soil and water analyses; Cathy Grey and Amy Chen for administration assistance, Karl Nissen and Steve Leahy for prompt IT assistance during IT panic attacks; Steve Dovers for a topup scholarship and editing some papers, Barbara Triggs for scat identification, Dad and brother Chris for their support; my first supervisor, John Field, especially for attaining topup funds and keeping my office for the duration, second supervisor, Ian White, and to assist with thesis restructuring and completion, final supervisor, David Freudenberger.
And last but not least, my gorgeous and ever so tolerant wife, Kiki - and not so tolerant but just as loveable, son Banjo “Have you finished your fesis yet Dad? Can we please go and play now?”
Apparent dryland salinity on the uplands of southeastern Australia: quantification of biotic and abiotic indicators, causes, mechanisms, processes and effects.
Secondary dryland salinity in Australia has been a major environmental concern for a number of decades, yet aspects remain controversial. These include the processes which induce salinised soils, the environmental impacts of salinity, and the way in which it is mapped and managed. Dryland salinity has been almost universally attributed to rising saline groundwater caused by excess water accumulation in the landscape following European settlement and tree clearing. However, there is a body of evidence that instead suggests increased soil salinisation in SE Australia is attributable to localized surface water problems associated with soil and vegetation degradation.
The ‘Rising Groundwater Model’ has been widely accepted as the paradigm for understanding, mapping and monitoring dryland salinity. However, little quantitative research has been
undertaken to understand the mechanisms and processes that cause secondary dryland salinity in the uplands of south eastern Australia. Further, there is little research that demonstrates adverse impacts of secondary salinity on terrestrial endemic biota even though it is listed as a threatening process to biodiversity. This research tested the applicability of an alternative
‘Surface Water Model’ to explain outbreaks of salinity or soil surface degradation in this region. This research investigated the effects of the joint phenomenon of soil and vegetation
degradation and elevated salinity levels on soil biotic and abiotic parameters. Field research was conducted at ten box/gum grassy woodland sites in the agricultural zone of the Southern Tablelands of NSW. A holistic suite of metrics, including soil physical, chemical, hydrological and biological attributes, were assessed in the field and laboratory; geophysical surveys (EM31/EM38) and various fauna and flora surveys were performed.
Results indicated that degraded soil surfaces were generally small in area and localized. These surfaces had highly variable soil EC levels (often very low), and were associated with in situ
synergistic factors related to in situ soil and vegetation degradation. Some surfaces had accumulated NaCl, but many also had other, both toxic and low cation and anion levels particularly reduced levels of Ca, Fe, N, SOM and SOC. Extreme pH levels and other soil physical, chemical and biological impacts were also common. It is concluded that elevated soil salinity levels are a symptom of soil and vegetation degradation, not the cause. It was found that the predominant water movement in these landscapes occurred as overland runoff and surficial lateral interflow above the clay-dominant B horizon. There was no biological, pedological, geophysical or hydrological evidence of groundwater being a major factor for elevated soil surface salinity levels.
problematical to directly link soil salinity per se with ecological stress, as many other synergistic factors are involved and are more significant for degraded soils.
THESIS CONTENTS
CHAPTER 1. INTRODUCTION 1.
1:1 Overview: Dryland salinity; causes and consequent loss of biodiversity 1.1.1 Secondary dryland salinity in Australia
1.1.2 Dryland salinity and terrestrial biodiversity 1.2 Thesis focus
1:3 Problems and paradigms 1:4 Thesis Questions
1:5 Research Aims and Hypotheses 1:6 Research Outcomes and Implications 1.7 Research steps
1.8 Thesis structure
CHAPTER 2. LITERATURE REVIEW 9.
2.1. Problem definition: Secondary soil salinity in Australia 2.2. History and sources of dryland salinity in Australia
2.2.1. Salt origin
2.2.2. Primary and secondary salinity 2.3. Causes of dryland salinity in Australia
2.3.1. Model 1: The ‘Rising Groundwater Model’
2.3.2. Model 2: ‘Transient Salinity’ or the ‘Surface Water Model’
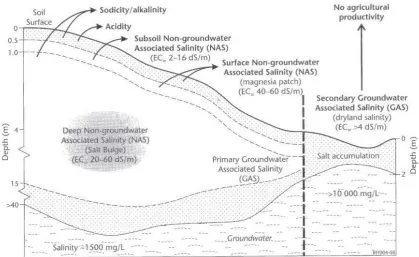
2.3.4. The Groundwater Associated Salinity (GAS) and Non-groundwater Associated Salinity (NAS) models.
2.7. Thesis questions and hypotheses 2.8. Dryland salinity and biodiversity
2.8.1. Terrestrial biodiversity
2.8.2. Implications and problems identified 2.8.2. Dryland salinity, degradation and biota. 2.8.3. Salinity and plants
2.9. Confounding factors to salinity impacts 2.9.1. Drought and climate
2.9.2. Dieback
2.9.3. Stock grazing and salinity 2.10. Ecosystem functioning
2.11. Thesis questions and hypotheses 2.12. Current management practices 2.13. Thesis questions and hypotheses 2.14. Summary
CHAPTER 3. STUDY REGION and RESEARCH SITES 59.
3.1. Study area
3.1.1. Regional geology 3.1.2. Soils
3.1.3. Salinity on the Southern Tablelands 3.1.4. Climate
3.1.5. Yellow Box/Red Gum Grassy Woodlands 3.1.6. Travelling Stock Reserves
3.1.7. Crown Land, Nature Parks and cemeteries 3.1.8. Private Land
3.2.1. Site selection criteria 3.2.2. Site locations
3.1.3. Catchments 3.2.4. Site geology 3.2.5. Scalds
CHAPTER 4. METHODS 79.
4.1 Sampling design and data collection 4.2 Transects
4.3 Sampling within transects
4.4 Quantitative and qualitative indicators 4.5 Methods summarised
4.6 Data analyses
4.7 Methodology and results presentation 4.8 LFA Patch Type introduction
CHAPTER 5: ELECTRICAL CONDUCTIVITY, pH, CATIONS & ANIONS 90.
5.1. Introduction.
5.2. Electrical Conductivity Measurements 5.2.1. EC methodology
5.2.2. EC Results 5.3. EC and Patch Type
5.3.1. EC and Patch Type Results 5.4. EC Vertical variation
5.5. EC Temporal variation
5.7. Scalds 5.8. Soil pH
5.8.1. Methodology 5.8.2. Results 5.9. pH & EC
5.10. pH & Patch Type
5.11. Association of pH with degradation 5.12. Hydrochloric acid and pH
5.13. Cations and Anions
5.13.1. Soil subsample method 5.13.2. Cation Results
5.13.3. EC and cation results
5.13.4. Patch Type and cation results 5.13.5. Anion results
5.13.6. EC and Anions
5.13.7. Anions and Patch Type
5.13.8. Correlations of pH with the soil subsamples 5.13.9. Summary: Soil cations and anions
5.14. Discussion pH 5.15. CEC, ESP and SAR
5.16.1. Introduction and methodologies 5.16.2. CEC, ESP and SAR results 5.16. Summary
CHAPTER 6. ELECTROMAGNETIC INDUCTION 140.
6.2. Electromagnetic Induction (EM) 6.2.1. Methodology
6.3. Results
6.3.1. Apparent electrical conductivity (ECa) 6.3.2. Association between EC(1:5) and ECa 6.3.3. ECa and Patch Type
6.3.4. Associations with degradation 6.4. EM depth weighted ratios
6.4.1. Depth weighted ratio results
6.4.2. Differences between scalds and non-scalds 6.5. Discussion
6.5.1. EM Depth Ratios
6.5.2. Electromagnetic Induction 6.6. Summary
CHAPTER 7: LANDSCAPE HYDROLOGY 175.
7.1. Landscape Hydrology 7.1.1. Surface water
7.1.2. Infiltration (sorptivity) 7.1.3. Soil Moisture
7.1.4. Subsurface water 7.2. Methods
7.2.4. Subsurface water – Slug tests and Piezometers
7.3. Results
7.3.1. Surface water 7.3.2. Infiltration 7.3.3. Soil Moisture 7.3.4. Subsurface Water
7.3.4.1. Slug tests 7.3.4.2. Piezometers 7.4. Discussion
7.4.1. Surface water 7.4.2. Infiltration 7.4.3. Soil moisture 7.4.4. Subsurface water 7.5. Summary
CHAPTER 8: FAUNA 194.
8.1. Introduction 8.2. Biotic surveys
8.2.1. Macro invertebrates
Ants, termites, earthworms, beetles and spiders 8.3. Methods
i) Pitfall traps methodology ii) Log discs methodology iii) Toilet rolls - methodology 8.3.2. Vertebrates
8.4. Results:
8.4.1. Pitfall traps
i) Pitfall Total animals (biomass) ii) Pitfall trap total animals and EC iii) Pitfall Taxa number (diversity) 8.4.2. Log Discs
Taxa number (diversity) 8.5. Total Taxa (Pitfall traps and Log discs) 8.6. Associations with degradation
8.7. Individual taxa –
i) Termites ii) Earthworms iii) Ants
iv) Beetles and Spiders v) Centipedes
vi) Wasps
vii) Vertebrates - Frogs, lizards and geckos viii) Mammals
8.8. Fauna and soil pH 8.9. Fauna and Patch Type
8.10. Discussion
8.10.1. Termites 8.10.2. Ants
8.10.3. Earthworms 8.10.4. Predators
8.10.5. Salinity stress and disturbance 8.10.6. Edge effects of scalds
8.11. Summary
CHAPTER 9: FLORA 236.
9.1. Introduction 9.2. Flora surveys
9.2.1. Leaf Analysis 9.3. Methodology
9.3.1. Flora surveys 9.3.2. PEAmeter 9.4. Results
9.4.1. Grasses 9.4.2. Trees
9.4.3. Exotic species 9.4.4. Tree Dieback 9.4.5. PEAmeter 9.5. Discussion
9.5.1. Flora
9.5.4. Summary
CHAPTER 10: SOIL MICROBIOTA and ORGANIC MATTER 254.
10.1. Introduction
10.2. Soil biota and bulk soil microbial respiration 10.3. Soil organic matter and carbon
10.4. Methods
10.4.1. Measuring bulk soil respiration
10.4.2. The ‘Inverted box’ soil respirometer methodology. 10.4.3. Solvita Soil Life Kit
10.4.4. Fungi and bacteria 10.4.5. SOM and SOC 10.5. Results
10.5.1. Inverted Box – soil respiration and EC 10.5.2. Soil respiration and Patch Type
10.5.3. Soil respiration and scalds. 10.5.4. Soil respiration and pH
10.5.5. Temporal changes in respiration – results and discussion 10.5.7. Solvita
10.5.8. Associations between soil respiration and degradation. 10.5.9. Fungi and bacteria
10.5.10. SOM
10.5.10.1. EC and Patch Type 10.5.10.2. SOM and soil respiration 10.5.11. Organic Carbon
10.6.1. Bulk soil microbial respiration 10.6.2. Solvita
10.6.3. Fungi and bacteria 10.6.4. Soil Organic Matter 10.6.5. SOC
10.7. Summary
CHAPTER 11: LANDSCAPE FUNCTION ANALYSIS 280.
11.1. Introduction
11.2. Landscape Function
11.3. Landscape Function Analysis 11.4. LFA methodology
11.5. Results
11.5.1. LFA Indices - Stability Index 11.5.2. LFA Infiltration and Runoff Index
11.5.3. LFA Nutrient Retention and Cycling Index 11.5.4. Results: Individual indicators
11.5.4.1. Rainsplash Protection (RP) 11.5.4.2. Perennial Vegetation Cover (PV)
11.5.4.3. Litter Cover, Origin and Incorporation (Litter) 11.5.4.4. Patch
11.5.4.5. Soil Slaking
11.5.4.6. Soil dispersibility (ASWAT) 11.5.4.7. Surface penetration (compaction) 11.5.5. Soil Nutrients
11.6. Discussion
11.6.1. Landscape Function Analysis 11.6.2. LFA indicators
11.6.2.1. Rainsplash Protection and Perennial Vegetation 11.6.2.2. Litter
11.6.2.3. Slake, ASWAT and dispersibility 11.6.2.4. Surface compaction
11.6.2.5. Nitrogen 11.6.2.6. Phosphorus 11.6.2.7. Other nutrients 11.7. Summary
CHAPTER 12. GENERAL DISCUSSION 319.
12.1. Introduction
12.2. Soil Degradation and dryland salinity
12.3. Soil Evaporation Potential – measuring and monitoring degradation and salinity 12.3.1. A Soil Evaporation Potential Index
12.4. Stock grazing – soil and vegetation degradation
12.5. Salinity Formation Models (Question 6, Hypotheses 1, 2)
12.6. Management: surface attributes and degradation (Hypotheses 5 and 6) 12.6.1. Farm Forestry
12.6.2. Long-stem tubestock 12.7. Salinity Mapping
CHAPTER 13. CONCLUSIONS 362.
REFERENCES 369.
CHAPTER 1.
1.1. OVERVIEW: DRYLAND SALINITY, CAUSES AND THE CONSEQUENT LOSS OF BIODIVERSITY?
1.1.1. Secondary dryland salinity in Australia
Secondary dryland salinity, or areas with elevated soil salinity outside of irrigated districts, is considered to be one of Australia’s paramount environmental problems as it can adversely impact agricultural land, water supplies, infrastructure, and biodiversity. ‘Secondary dryland salinity’ is a term used for salinity that appears to have been induced anthropogenically, rather than ‘primary salinity’, which is natural. Secondary soil salinity is typically recognized as patches of scalded soil apparently supporting little biota and little primary productivity useful to agriculture. Consequently secondary soil salinity has received a high priority in political agenda and associated government programs (e.g. SEAC 1996; PMSEIC 1999; NLWRA 2001, 2007; ANZECC 2002; ABS 2002; SRDCC 2002; HRSCSI 2004; Senate 2005; ISF 2008).
The primary cause for soil salinity has been claimed to be rising saline groundwater tables that create water logged and salinized surface soils. This model predicts that rising saline water tables are caused by the clearing of deep rooted perennial growing plants and replacing with shallow rooted annuals during post European settlement of Australia (e.g. Clarke et al. 2002, Peck and Hatton 2003; SEAC 1996; PMSEIC 1999; NLWRA 2001; etc). However, a growing body of research disputes the rising ground water model for upland landscapes and the understanding of dryland salinity processes has become controversial in SE Australia. An alternative perspective, reviewed in Chapter 2, suggests that localized soil and vegetation degradation has altered surface and soil water processes leading to the accumulation of salts in the top soil. Rengasamy (2002, 2006) and Fitzpatrick et al. (2003) call this ‘transient salinity’, Bann and Field (2006a,d) call it ‘surface water salinity’ (or the
‘surface water model’ – SWM) and Thomas (2007) and Fitzpatrick (2008) termed it ‘
non-groundwater associated salinity’ (NAS). In this thesis, the alternative to the rising
groundwater model is termed the ‘surface water model’.
Rengasamy (2002, 2006) describes transient salinity and localized scalding in upland agricultural landscapes of southern Australia, pointing out that it has little or nothing to do with rising groundwater. He indicates that approximately two thirds of the outbreaks should be classified as ‘transient salinity’. Despite this, the reports that deal with biota claim that elevated salinity levels from shallow toxic watertables are life-threatening, referring only to the rising groundwater model to explain any apparent adverse impacts on biota (e.g. Zeppel
et al. 2003, Briggs and Taws 2003; EA 2001; NLWRA 2002; ANZECC 2002). Other reports
claim similar with regards to impacts to agriculture and productivity (PMSEIC 1999; NLWRA 2001; Clarke et al. 2002).
based on the Surface Water Model are succeeding (e.g. Wagner, 2002, 2005, Paulin 2002; Bann and Field 2006b; Andrews 2006, 2008; Marsh 2009).
However, recent research claims that dryland salinity arises from higher rainfall and that land clearing has little to do with the situation (Rancic et al. 2009; DECC 2009; Summerell et al. 2009). These reports lead to media articles inferring that previous models are wrong and that
“textbooks will have to be rewritten” (SMH 2009). It is therefore apparent that the
fundamental processes that cause dryland salinity in upland landscapes are in dispute. The implications are serious, as the planning, management and financial repercussions are paramount.
1.1.2. Dryland salinity and terrestrial biodiversity
Biodiversity loss in Australia is also a major problem and secondary soil salinisation is reported to threaten endemic terrestrial and aquatic biodiversity in southern Australia (e.g. EA 2001; NLWRA 2002; ANZECC 2002; SRDCC 2002; Zeppel et al. 2003; Lambers 2003; NPAJ 2002; Briggs and Taws 2003; NPWS 2004; Seddon et al. 2007). These reports identify the urgency of investigating the effects of secondary soil salinity on terrestrial ecosystems and processes, particularly threatened and near threatened species and ecological communities. As a result secondary dryland salinity has been classified as a “threatening process” to endemic biodiversity (EA 2001) and the salinity problem is considered to be enduring and predicted to worsen before things improve (PMSEIC 1999; NLWRA 2000).
Despite this, very little research has been undertaken to investigate the effects of increasing soil salinisation on terrestrial biodiversity, particularly in the productive dryland areas of southeastern Australia. This limited research performed concludes that elevated soil salinity levels cause the death of endemic trees and grasses. In addition dryland soil salinity is claimed to favour the presence of weeds and severely impact ecosystems, particularly already stressed fauna (Taws 2003; Briggs and Taws 2003; Zeppel et al. 2003; Thompson and Briggs 2005; Seddon et al. 2007).
Conversely, a growing body of research indicates that soil salinity per se is not such a threatening process to terrestrial biota. A review of this literature is provided in Chapter 2. In addition, some researchers identify the importance of primary or natural salinity in the landscape, which is difficult to distinguish from secondary salinity (e.g. Dahlhaus et al. 2008; Nathan 1999) and common across southern Australia. They point out that salinity should be managed as such, rather than attempting to eradicate it, which clearly creates a management conundrum.
1.2. THESIS FOCUS
This thesis investigates and quantifies biotic and abiotic parameters associated with increasing soil and vegetation degradation and salinization. It also examines the effects of this degradation on terrestrial biodiversity in Eucalyptus melliodora (yellow box) and E.
blakelyi (Blakelys red gum) Grassy Woodlands on the uplands of SE Australia. This
chosen due to its proximity to the ANU facilities and because Yellow Box-Red gum Grassy Woodlands are common in this region and ultimately, dryland salinity is regarded as a major problem in the region and is considered to threaten its existence.
As the problem is multifaceted and complex, a holistic, multidisciplinary approach is adopted to investigate inter-relationships, using a suite of both biotic and abiotic survey methods that focus on fundamental regolith and ecosystem processes. The investigation of abiotic parameters in association with biotic variants will assist identifying processes that not only cause dryland salinity in these landscapes but also its effects and ultimately, recommend strategies for future salinity management priorities and activities. It is therefore anticipated that the results will contribute to the knowledge and understanding of the processes controlling dryland salinity on upland landscapes and the associated ecological responses and ultimately, be useful for remediation and management activities.
Additionally, it is anticipated that the metrics, or indicators, that identify relationships between increasing salinity levels and abiotic/biotic processes will be integrated into an efficient and practical survey technique, or ‘tool box’, applicable to upland sites affected by, or at risk of, increased degradation and salinisation. This information will be useful for land managers, policy makers and national regulatory agencies that are increasingly asking for assessments of current and potential soil degradation, including salinity, to use as inputs for landuse and resource management decisions and regulation. Lastly, the research will identify potential endemic grass and tree species that exhibit tolerance of elevated salinity levels and other associated factors, to be used with the suggested remediation activities identified with the indicators.
1.3. PROBLEMS AND PARADIGMS
A number of problems have been identified regarding dryland salinity and its presumed impacts on biota in Australia. These problems arise due to associated prevailing paradigms, which are interlinked;
1) All salinity is considered to be secondary, despite primary salinity being natural and salinity affected areas are often sporadic; dependent on seasons and climate.
2) All salinity affected areas are considered to be caused by unusual shallow and rising saline groundwater tables, despite field research from most states suggesting otherwise.
3) Therefore, there is a poor understanding of the causal mechanisms associated with dryland salinity.
4) Salinity is consequently considered to be the cause of soil and vegetation degradation rather than a symptom of it.
6) Any trees appearing to be unhealthy or are indeed dead, wherever there are scalds or simply elevated soil salinity levels, are blamed on salinity and toxic conditions.
7) All management activities are based on the rising groundwater model
8) All mapping activities are based on the rising groundwater model (i.e. the use of EM and AEM)
9) All modeling activities are based on the rising groundwater model
10) Salinity is reported to be expanding, often at alarming rates, in most states, including NSW and the Southern Tablelands, due to regional rising groundwater
11) All remediation and research funding opportunities are based on the rising groundwater model, hence research funds have been directed to groundwater monitoring, hydrologists etc., rather than pedologists
12) Species used for remediation are commonly exotic or hybrids
These problems and paradigms are more fully developed in Chapter 2.
1.4. THESIS QUESTIONS
Six thesis questions were derived to address these problems and paradigms;
1) What are the dominant mechanisms for the formation of dryland salinity on the uplands of SE NSW, or, what are the likely causes?
2) Are these mechanisms predominantly ‘top down’, associated with degradation, or ‘bottom up’ associated with rising saline groundwater?
3) Are salinity affected areas linked to endemic fauna and flora mortality? In other words, is dryland salinity a threatening process and are these areas biological deserts?
4) As salinity is natural in Australian soils, do endemic flora species show tolerance of the conditions and can they be recommended for remediation and management for such conditions?
5) What is the most applicable conceptual causation model to explain dryland salinity in upland landscapes?
1.5. RESEARCH AIMS AND HYPOTHESES
The aim of this research is to rigorously test four hypotheses and alternative hypotheses devised to test previous process and causation knowledge and understanding;
1) Abiotic and biotic attributes at sites affected by dryland salinity at grassy woodland upland sites of SE NSW are associated with surficial, ‘top down’ degradation processes
2) Alternative hypothesis: Salt affected areas in upland landscapes are universally caused by rising saline groundwater tables, in other words, a ‘bottom up’ process
3) Elevated soil salinity levels adversely impact all terrestrial fauna and flora – scalds are biological deserts (i.e. dryland salinity is a threatening process)
4) Degraded salt affected areas are highly dysfunctional, they have low rates of water infiltration, have unstable soil surfaces and low rates of nutrient retention and cycling
5) Degraded salt affected areas should be managed so as to remediate and ameliorate in situ soil and vegetation, addressing soil structure and vitality (health), surface water flows and groundcover, thus reducing the surface evaporation
6) Alternative hypothesis: Degraded salt affected areas should all be managed so as to reduce recharge to the groundwater table and Increase the depth to the groundwater at the ‘discharge zone’.
1.6. RESEARCH OUTCOMES AND IMPLICATIONS
A number of desired outcomes were expected from this research, including;
1) A better understanding of processes that may cause dryland salinity and soil degradation on the uplands of south eastern (SE) Australia;
2) Development of a more appropriate salinity model for upland landscapes;
3) A better understanding of the effects of severe degradation and elevated salinity levels on terrestrial biota and ecosystem function in Yellow Box Red Gum Grassy Woodlands of SE Australia;
4) Development of a robust suite of indicators for a monitoring and evaluation methodology for farmers, land managers and researchers to use for salinity and land management activities in upland landscapes;
6) Development of a more sustainable management approach and future conservation for the Yellow Box Red Gum Grassy Woodlands, particularly those associated with degraded areas associated with elevated salinity levels on the Southern Tablelands.
1.7. RESEARCH STEPS
The following steps were conducted to achieve the research aim:
1) Review applicable research and reports and visit or contact relevant experts to discuss research ideas,
2) Use systematic selection criteria to identify a representative subset of study sites
3) Investigate relevant metrics to enable qualitative and quantitative biotic and abiotic surveys of sites with scalded and non-scalded areas be conducted. Relevant metrics are chosen which focus on identifying the fundamental mechanisms of the regolith, or system.
4) Use the results from the field surveys and laboratory analyses to test the above hypotheses,
5) Develop a more applicable conceptual model of dryland salinity cause, formation, and management,
6) Identify useful indicators from step 3 applicable for assessment and monitoring activities designed to investigate effects of salinity and soil degradation on terrestrial biodiversity,
7) Suggest appropriate salinity management strategies for upland sites based on an understanding of the system gained in step 4, 5 and 6.
1.8. THESIS STRUCTURE
The thesis is structured as follows:
Chapter 1: a brief overview of the rationale and focus for this research
Chapter 2: a review of the literature relevant to explain the basis for the paradigms challenged, and the six questions and six hypotheses stated above. The review is divided into four broad sections;
Problem definition: Recognition of secondary soil salinity in Australia
Evidence and models of secondary soil salinity development and maintenance, The impact of dryland salinity on biodiversity and landscape function, and Existing management strategies to reduce the impact of soil salinity.
Chapter 4: describes the overall methodology rationale used to answer the questions and test the hypotheses, and the reason for using the method. In order to identify the biotic and abiotic processes operating at the surface, it was necessary to identify the causes of any responses to enable explaining the relationship of any effects. Methodology was therefore focused on collecting metrics likely associated with alterations to soil chemical, physical, hydrological and biological attributes. The methods are divided into abiotic and biotic indicators, involving both qualitative and quantitative data collection. Statistical analyses methodology is also reported.
Chapters 5, 6, and 7. Contains the abiotic metric results which focus on testing hypotheses 1 & 2 – ‘causation processes – surficial or groundwater?’
These three and the following four chapters are structured as introduction, technical methods, results and discussion for each.
5. EC(1:5), pH and soil cations and anions. This chapter examines weather soil surface degradation is consistently related to elevated levels of salinity at both the surface and at depth. Lateral, vertical and temporal measurements are reported and associations between indicators with degradation
6. EM (ECa and depth ratios). This chapter investigates the apparent electrical conductivity of the sites and relationship to surface soil EC(1:5) measurements, in addition to examining lateral, vertical and temporal variation. It also investigates where in the soil profile the predominant changes occur between 2 surveys at different seasons with different
moisture regimes.
7. Landscape hydrology; overland flow, infiltration, piezometers and soil moisture. This chapter investigates where in the landscape the predominant movement of water is, and what affects this may have on causation of the degraded areas. It provides vital information to support the conclusions derived from chapters 5 and 6, that causation is surficially driven, associated with soil and vegetation degradation.
Chapters 8, 9, 10. Contains the biotic metrics that focus on answering Hypothesis 3 – ‘are
scalds biotic deserts?’:
8. Fauna; contains the biotic data and provides the results that disprove that scalds are a biological desert, are indeed islands of elevated disturbance providing habitat for a number of taxa, many which thrive in the disturbed and degraded conditions. This effectively, may increase the gamma biodiversity of the grassy woodlands. The results also negate deep groundwater issues.
9. Flora: contains the floral component of the biotic data and provides the results that endemic flora species are tolerant of elevated salinity levels. No evidence was found that suggests that the endemic grass or tree species are impacted by elevated salinity levels.
10. Microbes, respiration and SOM; contains the subsurface information that
why microbial activity is low. It is apparent that SOM is urgently required in remedial activities at these degraded sites.
Chapter 11. Landscape Function Analysis (Hypothesis 4 – ‘are scalds functional?’): reports
the results of the Landscape Function Analysis that quantifies links between species diversity, vegetative structure and fundamental processes of soil stability, water infiltration and nutrient cycling. Important LFA indicators are presented separately which focus on both important abiotc and biotic attributes. Nutrients, N and P, are also presented.
Chapter 12: General Discussion: Section 1 summarises the results and describes an
alternative model (Question 5), called the ‘Surface Water Model’, which is based on elevated soil surface evaporation potential associated with soil and vegetation degradation, for the development and maintenance of scalds found on the Southern Tablelands of NSW and other upland environments across southern Australia.
Section 2 focuses on the management implications of the results. It concludes that reducing ground water recharge (Hypothesis 6 – ‘best management practices’) is an overly simplistic approach to managing scalded areas in the Southern Tablelands of NSW. Focusing on soil hydrology and remediation and vegetation regeneration with endemic species is the more coherent approach.
Further research questions and ideas for future research are also included.
Chapter 13: draws conclusions from the research, and addresses the six research questions and four hypotheses and 2 null hypotheses.
CHAPTER 2
LITERATURE REVIEW
2.1. Problem definition: Secondary soil salinity in Australia
Secondary soil salinity is salinity which is considered to have been induced by human activity as opposed to primary salinity which is natural. In Australia, secondary soil salinity is basically divided into two types, dryland and irrigation salinity. Although irrigation salinity is common in SE Australia, irrigation is rare on the uplands of the Southern Tablelands of NSW (STNSW), hence it is not the focus of this research.
Dryland salinity in southern Australia is seen as a paramount environmental concern and has consequently received high priority in political agenda over the past one and a half decades (e.g. PMSEIC 1999; MDBCMC 1999; NLWRA 2000, 2001, 2002, 2007a,b,c; NSWSS 2000; EA 2001; SCS 2002; AAS 2002, 2006; NDSP 2002, 2003, 2004, 2006; ABS 2002; ANZECC 2002; SRDCC 2002; Senate 2006; NCCSI 2006; Henschke et al. 2008; Rancic et al. 2009; DECC 2009; Steffen et al. 2009: ACF 2009).
Dryland salinity is reported to impact roads, towns, infrastructure, agriculture, land, water, and biodiversity (e.g. Walker 1995; Martin and Metcalfe 1998; PMSEIC 1999; Jolly et al. 2002; SRDCC 2002; NLWRA 2000, 2002; ANZECC 2002; Lambers 2003; NAPSWQ 2004). Former Australian Prime Minister, the Hon. John Howard, stated that salinisation is ‘The
most serious environmental problem facing the Australian continent’ (ABC Radio National
26-03-01). According to the NLWRA (2001) 5.7 million hectares are at risk to dryland salinity in Australia and this was predicted to triple to 17 million ha by 2050. In NSW, 161,000 ha in 2000 is predicted to increase to 526,570 ha by 2050 and Victoria 555,000 ha to 1,170,000 ha (NLWRA 2001). The total amount of remnant vegetation at risk was reported to be 630,000 ha, which was predicted to increase to 2,000,000 ha by 2050. Salinity has been emotively described as “The great white beast that lurks below” (AAS 2004, 2006), which has been “unleashed”, “The creeping silent death”, “The awakening monster from the deep”,
“The white death”, “Our silent disaster”, “The silent flood” (Sexton 2003), and “The salinity
crisis” (Beresford et al. 2004). State agencies (in Beresford 2004; NAPSWQ 2004) estimate
that in Western Australia one hectare (football field) in area per hour was being lost to salinity.
Moreover, dryland salinity has even been linked to public health and disease, following a number of cases of Ross River Virus near a dryland salinity expression in Queensland, the salinity expressions considered a breeding zone for mosquitoes, vector species of virus (Biggs and Mottram 2008). Lindsay et al. (2007) also discuss this link, suggesting that as dryland salinity expressions in Western Australia expand in area, habitat for saltwater mosquito species increases, implicating an increased likelihood of the virus transmission due to the salinity.
causes, and impacts to biota and ecosystems hence, the way in which it is mapped, modeled and managed This will be reviewed below. Of all the environmental problems facing Australia, secondary dryland salinisation is probably the least understood. The ongoing and reported escalating nature of salinity across southern Australia indicates that the present understanding of the fundamental processes are lacking. Indeed, relatively recent reports by Professor Ian Acworth (SMH 2009) from the UNSW claim that Australia’s understanding of salinisation processes are wrong, land clearing is not the problem after all, rainfall is, hence, “Textbooks on the subject will have to be rewritten”. Most recently, Pannell and Roberts (2010) report that A$1.4 billion of public funds spent on the National Action Plan for Salinity on 1700 projects over seven years (2000-2007) was a waste of money, and was
“readily foreseeable”. It is therefore apparent that the situation requires urgent investigation.
2.2. History and sources of dryland salinity in Australia
High soil and waterway salinity in south eastern Australia was identified early during European colonisation (Cunningham 1827, Clarke 1868, Morrison 1898). Cunningham (1827) noted (p46) that streams north west of Sydney often had water too salty for cattle to drink (i.e. ~16.5 dS/m, or 16,500µS/cm; Taylor 1996) and wrote, “There is certainly a considerable portion of saline matter in most lands throughout the colony. You will see it often, in dry weather, lying like hoar frost upon the ground in the vicinity of ponds; while in the burning of
the stumps, it covers the outside of the earth-kiln with a thin powdery efflorescence” (p47).
Clarke (1868) reported that an earthquake in 1809 caused the water to change from fresh to salty in William Lawson’s well at Prospect, west of Sydney. He commented that the soil on which Lawson’s house was built was naturally saline with dense stands of Juncus sp. lining the valley floor below (Mitchell 2000). Sturt reported on his 1828 expedition to western New South Wales, prior to any agricultural impacts in the area, that the Darling River was salty (Close 1990) and that the creeks and rivers were often too salty for his stock to drink. This is considerable, as thirsty sheep will drink ~23 dS/m (23,000 µS/cm), or about half that of seawater (Taylor 1996).
Increasing salinity was first recognised in the Western Australian landscape during the late 1800’s (Lefroy 1863 and O’Brien 1912 [cited in Cunningham 2005]; Morrison 1898; Wood 1924). Wood (1924) is commonly cited as being the first to suggest a link between vegetation clearing and secondary salinity in Australia, although his evidence is considered to be qualitative being based on observations. Numerous articles by Teakle (1938) during the 1920’s and 1930’s identified serious problems of soil salinity, informing government, fellow scientists and farmers that the problems are caused by low rainfall, soil type, topography, and the removal of native vegetation.
to a far lesser degree, the Northern Territory (Tickell 1994a,b,c) and the Australian Capital Territory (MDBCS 2006). Although, the NLWRA (2000) suggest that dryland salinity is not present in the ACT.
Logan (1958) noted that the salt affected soils throughout the NSW tablelands and slopes were rapidly increasing in area, although quantitative data for the increase was not provided. A number of others have claimed the same, including Dyson (1990), Powell (1993), MDBCMC (1999) and NLWRA (2001), with figures of up to 17% increase per year reported. However, no objective evidence is supplied and the claims appear to be unsubstantiated. Wagner (1987, 2001) however, with data for 96 sites, some of which spanned the 50 years of his work, provided irrefutable evidence that the majority of salinity outbreaks on the Southern Tablelands of NSW are not expanding and particularly disputes the claims of Powell (1993).
Dryland salinity predominantly occurs in landscapes where evaporation rates exceed precipitation, causing soluble salts (evaporites) to accumulate in the soil surface (Walker 1995; NLWRA 2000). In humid regions leaching readily removes surface soil salts, particularly sodium, because of its high solubility and the weak attraction for sodium for cation sites, however, in arid and semi-arid regions, sodium may accumulate and occupy more of the exchange positions than the other cations (Szabolcs 1989; 1998). These increased soil salts are in concentrations considered high enough to adversely affect biota, particularly crops (Northcote and Skene 1972; Szabolcs 1989; 1998; Rengasamy et al. 2003) and according to Taws (2003), Briggs and Taws (2003) and Zeppel et al. (2003), endemic species. This will be investigated in this thesis.
2.2.1. Salt origin
Soil salt originates from a combination of sources. Meteoric salts from the sea and land surface are deposited from rainfall (Blackburn and McLeod 1983; Simpson and Herczeg 1994; Poulsen et al. 2006) and dust (Nicoll 1993; Kiefert and McTainish 1996; Walker 1995; Acworth et al. 1997; Summerell et al. 2000). The amount deposited from rainfall depends on the distance from the coast, with inputs decreasing as one moves inland (Ruprecht and Schofield 1989, 1991; Williamson 1990; Biggs 2006) and total annual rainfall, with figures of up to 350kg/Ha/year in southwest Western Australia (Walker 1995). Bettenay (1964) concluded that most of the salt contained in the landscape of a catchment in the Western Australian Wheatbelt was from long term accumulation of atmospheric inputs (cyclic). Downes (1954) also found that cyclic salts were the dominant factor in the genesis of saline soils in SE Australia. Poulsen et al. (2006) indicate that 75% of salts in the Mount Lofty Ranges region of South Australia are of marine origin. Indeed, the majority of oceanic salts originally came from the weathering and erosion of rocks (Bresler et al. 1982). The weathering of minerals in the rocks and regolith (innate), in addition to (fossil) salts emplaced in the rocks during marine deposition (connate), also contribute to salinity (Gunn and Richardson 1979; Gunn 1985; Bresler et al. 1982; Walker 1995). In regions where irrigation occurs, salt can be added to the landscape due to salts contained in the irrigation water (Bresler et al. 1982; DPI 2005), however, irrigation is uncommon on the uplands of the Southern Tablelands.
the predominant source of salts on the Southern Tablelands of NSW is from aeolian deposition, particularly during dryer (and windier) glacial periods (Broughton 1992; Nicoll 1993; Acworth et al. 1997; Kiefert 1997; Munday et al. 2000; Melis and Acworth 2001; Acworth and Jankowski 2001). Many researchers have indicated that northwesterly and westerly winds have been transporting and depositing significant amounts of dust across eastern Australia during the Pleistocene, including that derived from inland playas, and this process continues to the present day (Butler 1956; Walker and Costin 1971; Bowler 1976, 1986; Bowler and Wasson 1984, 1989; Chartres et al. 1988; Wasson and Donnelly 1991; Crowley 1994a; Kiefert 1997; Chen et al. 2002; Melis and Acworth 2001; Cattle et al. 2005). Chartres et al. (1988) investigated soil development in SE Australia and suggested that up to 20% of the surface soil horizons may have originated as aeolian deposits, with up to 70% by weight aeolian material added to the soils near Young (approximately 100km northeast of the study area). However, the amount contributed to the source of dryland salinity by aeolian processes has been questioned (Campbell and Hesse 2004). Using isotopic evidence, Morgan et al. (2006) suggested that the saline groundwater in a catchment near Dubbo on the Central Western Slopes was from various proximal and distal sources although they found that the salt was of meteoric origin.
It is therefore apparent that the predominant origin of salts on the Southern Tablelands of NSW is both complex and undetermined. The issue is of importance to this research as the origin of salts is likely to play an important role as to the frequency of addition (accumulation rates), where in the regolith the salts are presently (and historically) stored and whether they are derived from surficial or subterranean sources. A relatively constant meteoric source suggests that much salt is likely to be accumulated and stored in surface material, or soils, and shallow watertables and is also likely to be transported laterally and surficially as interflow as described by Cope (1958), Conacher (1975, 1983) and Murray (1996).
2.2.2. Primary and secondary salinity
Bettenay (1962) and Clarke and Alley (1993) indicate that there are widespread and extensive primary (natural) networks of valley and palaeovalley fills in the Western Australian Wheatbelt, with complex architectures and relationships to the present landscape, the result of a long evolutionary history dating back to the Jurassic. Most of these fills are apparently currently inactive, acting as sumps for surface drainage, hence the numerous natural saline playas seen across the Wheatbelt today (Clarke 2005).
[image:30.595.76.217.295.475.2]Dryland salinity is therefore not a recent phenomenon in southern Australia, hence the biota has had considerable time to adapt to (co-evolve) and possibly even exploit these naturally saline environments. As salinity is a primary feature across southern Australia, it is essential to identify that which is likely to be primary and that which is secondary. The differences between naturally saline systems and those that are subject to change through increasing and/or fluctuating salinity levels must be understood. However, identifying primary and secondary salinity is generally problematic.
Figure 2.1 Saltwater Creek, Boorowa. Creeks with high salinity levels are a natural phenomenon in southern Australia. As historical records are usually anecdotal, and levels fluctuate temporally and spatially, the question remains, are they any saltier than usual?
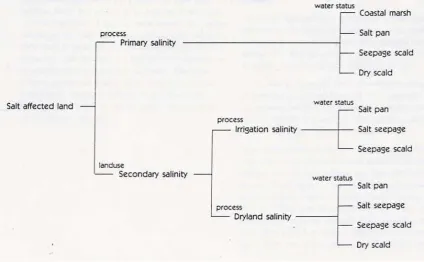
Williams and Bullock (1989) discuss the causal and morphological classification of saline sites and divide salt affected land into primary and secondary salinity, two distinct groups as shown in Figure 2.2. However, all primary salinity derivatives, except for ‘coastal marsh’ are
contained under both irrigation salinity and dryland salinity, (i.e. salt pan, salt seepage,
seepage scald, dry scald) which prevents identification between the three types. Additionally,
Figure 2.2. Classification of scalds based on causes, site morphology and water status; from Williams and Bullock (1989). Note that primary salinity and dryland salinity are considered to be different and the primary and secondary salinity subdivisions are the same (except for the primary coastal marsh).
The following points summarise important considerations discussed in regarding classification of saline expressions as either primary or secondary.
a) The terminology and definitions used for primary and secondary salinity make identification difficult;
b) Primary salinity, or natural occurrences of areas in the landscape that are subject to elevated salinity levels, is common across the low-medium average annual rainfall regions of southern Australia;
c) Many of these primary situations have been modified (such as swamps, chains of ponds and ephemeral drainage lines) for productivity, and are often not recognised as such for clarification;
d) Salinity expressions fluctuate temporally and are spatially heterogeneous;
e) Salinity information generally relies on relatively recent (subjective) observations; f) Primary salinity has never been mapped;
g) For most situations, the problem is identified as secondary (i.e. economic benefits); h) It is likely that for most situations where geology (i.e. hydrogeology or groundwater flow
systems) plays an important role, the problem will be primary;
i) Managing something which is natural to the landscape (primary) will inherently require a different management regime to a situation which has arisen consequent to management activities (secondary);
Salinity terminology
The general terminology for salinity in SE Australia is also varied and confusing, further making identification and subsequent management decisions difficult. Table 2.1 summarises terminology used for salinity expressions in SE Australia. Beadle (1948) classified dry scalds of western NSW and Figure 2.2 illustrates the causal and morphological classification of saline sites proposed by Williams and Bullock (1989), Semple and Williams (2002) and Fitzpatrick (2008). For the purpose of this thesis, a scald is considered to be a bare, unproductive area produced from the removal of the surface soil by wind and/or water erosion, with the result being the exposure of the subsoil which is relatively impermeable to water in addition to being unfavourable for seed germination and plant growth (Beadle 1948; Jones 1966; Houghton and Charman 1986; Abraham1987; Cunningham 1987).
Table 2.1. Summary of terminology used in the literature for salinity identification in SE Australia * Primary (natural) and/or secondary (induced) salinity
* Irrigation salinity
* Dryland salinity / Seepage salinity (also termed ‘secondary’) * Transient salinity (2 types - subsoil and soil surface)
* Dry saline land (also termed ‘primary’) * Magnesia patches
* Localised salinity (as compared to regional rising groundwater salinity) * Seepage scalds and dry scalds
* Acid sulfate saline soils (acid sulphate soil scalds – ASS) * Urban salinity
* Stream salinity
* Surface water salinity / Groundwater salinity
* GAS (Groundwater Associated Salinity) and NAS (Non-groundwater Associated Salinity) with numerous subdivisions.
Lastly, to add to the confusion, the terminology for measuring salinity is also highly variable, often dependent upon the discipline, and includes mS/cm, dS/m, µS/cm, mS/m, g/L and ppt. Although the international standard for soil salinity is dS/m (Tanji 1990), µS/cm is used in this thesis due to its common usage in Australia, especially for low to high soil salinity measurements, unless stating results from previous work that uses dS/m.
2.3. Causes of dryland salinity in Australia
Identification and an understanding of the causes of dryland salinity is fundamental for assessment, management and policy decisions. In southern Australia, dryland salinity usually occurs in low-medium average annual rainfall regions on upland landscapes where evapotranspiration exceeds precipitation (Walker 1995; NLWRA 2000), whereas irrigation salinity usually results from irrigation practices (agriculture) in lowland landscapes (NLWRA 2000; DPI 2005).
However, identifying and clarifying the cause of dryland salinity expressions is confusing, as there are two alternative models postulated to explain secondary dryland salinity in Australia;
the Rising Groundwater Model (RGM) or Groundwater Associated Salinity (GAS). For clarity
Alternative models, which are slight variations on each other, are the Transient Salinity,
Surface Water Models (SWM), or Non-groundwater Associated Salinity (NAS). These will be
discussed further in the following sections. The mapping and management activities, and most previous research undertaken that investigates relationships between salinity and terrestrial biota in southern Australia, is based on the Rising Groundwater Model.
Most recently, Pannell and Roberts (2010), assessed the performance of the National Action Plan for Salinity and Water Quality, $1.4 billion of public funds to 1700 projects during ~2000 to 2007. They found “serious weaknesses in the program” and most projects generated “few
worthwhile salinity mitigation benefits and will have little enduring benefit”. They indicated
that this was “readily foreseeable given the attention to the scientific and economic
knowledge of salinity available at the time the program was developed”. They basically
report that the program was a waste of money, although one of the possible reasons they suggest is “in large areas of eastern Australia, there has been below-average rainfall for several years, so that water tables have fallen, and the apparent threat from salinity has
abated, at least temporarily”. The possibility of failure due to focusing all funds on
hypothetical shallow groundwater rather than surface degradation is not mentioned, once. All discussion and conclusions are therefore based on the rising groundwater model.
A summary of both processes, or models, are therefore provided.
2.3.1. Model 1: The Rising Groundwater Model
The model that has been nationally adopted to explain the cause of secondary dryland salinity in Australia, the Rising Groundwater Model is depicted in Figure 2.3. This model invokes an excess of water movement in the landscape, induced from extensive vegetation clearing post European settlement. This is the model that dominates Australian google searches regarding “dryland salinity causes”, indeed, all of the first 4 or 5 pages of the
50,900 results (7/01/11). It is also the model that Wikipedia refers to as the general cause of; i) dryland salinity (http://en.wikipedia.org/wiki/Dryland_salinity),
ii) soil salinity (http://en.wikipedia.org/wiki/Soil_salinity) and
iii) Australian salinity (http://en.wikipedia.org/wiki/Salinity_in_Australia),
and is depicted in all major Australian salinity websites as the general cause of dryland salinity, the majority of all previous government reports and scientific journal articles, magazines, books, television documentaries etc.
mobilization and elevated salinity surface salinity levels. The consequences to the soil and biota (both plants and animals) from these unusual toxic rising shallow groundwater systems (unusual both as shallow depths and elevated salinity levels), is reported as severe. This process relies upon a “bottom up” scenario, that is, all impacts derive at depth but manifest at the surface.
[image:34.595.75.411.178.635.2]presumption for the model to work), which then kills the endemic vegetation (due to the unusual elevated and toxic salinity levels). (From Australian Geographic, No 85, 2003).
This model, arguably first documented by Wood (1924) in Western Australia (e.g. see Reynoldson 1909; Bleazby 1917; Harris 1920 – cited in Tassell 1995), is mentioned in most Australian scientific and non-scientific literature from Western Australia (e.g. Peck and Williamson 1987; Conacher 1990; Hodgson et al. 2002; McFarlane and George 1992; George et al. 1997; Salama et al. 1999; Pannell 2001) and eastern Australia (e.g. Jenkins 1981; Barnett 1990; Wylie et al. 1993; Barnett et al. 2001; Cook 1989; Allison et al. 1990; Crowley 1994b; Baker et al. 2001; Salama et al. 1999; Coram et al. 2001; Clarke et al. 2002; Please et al. 2002; Walker et al. 2002; Anderies 2005), to mention just a selection. The Rising Groundwater Model is therefore promoted by all the major state and federal government scientific agencies and departments, including the Australian Academy of Science (AAS 2004, 2006), CSIRO, Land and Water, NDSP, NAPSWQ, MDBC, CRC Salinity, NSW DNR, NSW DPI, NSW CMA’s, NSW DECC and state Departments of Agriculture.
Dragovich and Dominis (2008) discuss the importance of rainfall (and drought) on scald formation in Central West NSW, and ascribe this to groundwater levels. The following year, Professor Ian Acworth at UNSW and hydrologists from the NSW DECC, following separate correlations between rainfall and bore water levels and the extent of dryland salinity, claimed that dryland salinity is mainly due to change in climate (i.e. rainfall - c.f. Dragovich and Dominis 2008) rather than landuse. However, the validity of this conclusion is questionable, especially in upland environments, as will be highlighted in the following sections.
Moreover, Campbell (2008) suggests that dryland salinity problems will recede with ongoing climate change, stating “It is likely that a warming, drying climate across southern Australia
will reduce the symptoms of secondary salinisation and its impacts on dryland agriculture”.
However, this is arguable as once again, it is based on the assumption that all dryland salinity is caused from shallow groundwater systems (rising groundwater model). It also disagrees with many other recent government reports suggesting that the salinity problem is continuing to get worse.
Flaws in the rising groundwater model
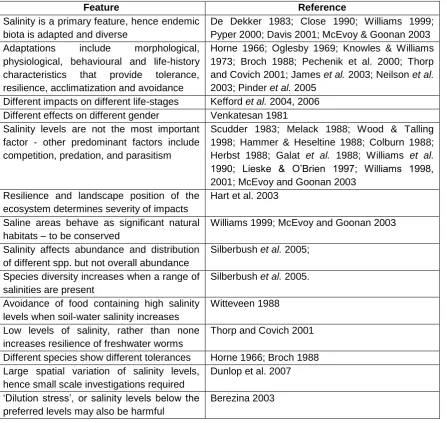
The rising groundwater model has been challenged by many researchers and land managers, who consider it to be a simplistic view of a complex, and multifaceted process that involves many landscape variables (see Table 2.2). This is especially the case on the upland areas of SE Australia, as will be explained in the following sections.
The Channel Nine Sunday Program, ‘Australian Salinity Crisis – what crisis?’ broadcast on the 28th May 2006 (Coulthart 2006) interviewed a number of prominent scientists and farmers who challenged the rising groundwater model and associated so-called ‘salinity crisis’ at the time, pointing out that the rising groundwater model and the salinity issue in general, is both highly exaggerated and controversial.
Table 2.2. A summary of the main influences and considerations when researching dryland salinity in box/gum woodlands on the Southern Tablelands of NSW. All influences are expanded on in the chapter (modified from Bann and Field 2005).
Influence Considerations
Is the problem secondary (human induced) or primary (natural)?
Primary salinity is a common natural feature across parts of southern Australia, hence, should be acknowledged and managed as such.
Climate and distance from the coast Affects rainfall amount and salt content
Geology/regolith Includes rock type, faults, joints, cleavage, dip, dykes, contacts and lithology changes, permeability, porosity, and groundwater flow systems - all of which are heterogeneous. Salt source, movement and storage
locations
Includes palaeodrainage channels, flow pathways, ephemeral drainages; blockage and accession, perched water tables, sump (or swampy) areas, infiltration and leaching,
recharge/discharge?, salinity depth, watertable depth, and aquifer depth, all of which are heterogeneous.
Soils/regolith Includes chemical, physical, hydrological and biological properties.
Size and scale of the problem, site severity and stage/succession
Site size may be associated with the stage of degradation, such as the onset/ recovery/ climax. Both scale and stage are likely to be important.
Significant spatial variation over small distances (landscape heterogeneity)
This includes many parameters, both biotic and abiotic, but particularly EC (and pH).
Temporal variability Includes seasonal/annual/long term changes, such as soil moisture, temperature and evaporation.
Topographic setting Affects surface and subsurface flows and runoff.
Salt type and concentration Numerous salts may be present and in various concentrations (toxicities).
Anthropogenic disturbances (historical and present)
Domestic livestock grazing (i.e. sheep, horses, cattle, goats) and also native animals, such as macropods.
Sheep are the main pastoral activity and when allowed to graze intensively, or for long time periods, degradation pursues. Native animals may exacerbate the situation once the problem occurs.
Rabbits Rabbits are present, although not in such large numbers as historical times, causing cumulative soil and vegetation degradation.
Vegetation clearing and modification
Includes vegetation degradation across the entire landscape, of both trees and grasses (groundcover). This also includes tree ringbarking.
Landscape modification Examples include filling of swamps, ephemeral drainages and chains of ponds.
Soil degradation and erosion This often exposes the dispersible sodic subsoil and effectively reduces the depth to the watertable, when seasonally present.
Revegetation plantings This includes hybrid tree species and exotic grass species Soil works such as contour banks,
fallowing, tillage, dams, swales, drainage
Affects surface hydrology, such as runoff during storms and infiltration of rainwater.
Roads and tracks Can cause compaction of surface layers and impede drainage, also usually exposes dispersible A2 horizon.
Table 2.3. Assumptions made for the excess water dryland salinity ‘rising groundwater model’. (Modified from Bann and Field 2006c). The 3rd assumption is discussed further in Appendix 2.1.
Assumption Comment / implication
The one model applies to all situations Infers that the cause is general, that is, all landscape processes are the same Landscapes were hydrologically ‘balanced’
or in ‘equilibrium’ prior to European settlement
There is no evidence for this and the assumption is illogical.
Most landscapes were covered by healthy continuous forest or dense woodland
No evidence for this, it is incorrect, it does not agree with early explorers/ settlers accounts
All landscapes were extensively cleared of deep rooted perennial vegetation, especially trees on the hills
This is incorrect, most hills have poor residual, skeletal soils, unsuitable for agricultural activities and productivity. Many hills contain the original remnant vegetation
Most rainfall was evapotranspired prior to European settlement, even during winter
There is no evidence for this and the assumption is illogical
Geology is simple and uniform and does not influence processes
Geology of the Lachlan Fold Belt is complex. Groundwater Flow Systems and more recently Hydro Geological Landscapes attempt to address this concern in some situations
Groundwater and surface water readily mix, despite having different densities
Saline groundwater and fresh surface water apparently perform acts of inversion and in many cases, they appear to be considered the same thing Although rainwater is less dense than salty
groundwater (i.e. it floats), the salty
groundwater always ends up at the surface, on top, and the freshwater is ignored
The physics required for this assumption is illogical. It also requires that the hills receive considerably more rainfall than the lower areas, both annually and longer term, of which there is no evidence. Lower areas are regarded as ‘discharge’
zones (for deep groundwater) rather than recharge zones, despite the considerable amount of surface water ponding in these areas.
Most water accumulates in the lower areas following large storm events or significant rainfall events, such as extended wet periods. This water either flows away as runoff, evaporates or infiltrates the soil, all being controlled by gravity.
There is excess (vertically up) water movement in the landscape,
The physics required for this assumption is illogical. Recent droughts & storage effects of dams and indeed gravity, are ignored. Any vertically upwards moving moisture/salts has to penetrate the semi impermeable B horizon.
Discharge is ‘rising groundwater’ and is always considered to be secondary and unusual.
Discharge is likely to be primary, that is, a natural situation, at least when considered temporally (or seasonally)
Natural drainage in discharge zones (and drainage lines) is not considered
See point above
Most recharge (percolation) occurs on the hills and is homogeneous (uniform) across them
There is no evidence for this and it is more logical that most rainfall flows downslope to lower areas, either where it accumulates to infiltrate the soil or evaporate, or, flows into a drainage line (or creek) Landuse activities such as vegetation
modification, universally influences groundwater.
There is no evidence that indicates that this is general.
Native trees have the ability to ‘contain’ large amounts of salt in the soil root zone.
There is no evidence for this.
[image:37.595.71.527.95.778.2]“dormant” for millennia. present, there is no evidence of dormancy and becoming active.
The excess water has recharged the groundwater on the hills, flowed through the landscape (or aquifer) then discharged elsewhere, all post European modification (which is often within <60 years).
Travel time for the water to travel through the regolith and geology beneath and back up through the regolith (subsoil and topsoil) is not considered.
Primary salinity occurrences that may be derived from a primary situation are not considered.
All areas with elevated salinity levels are considered to be secondary and anthropogenically induced, despite salinity being a natural phenomenon. Soil surface processes are not involved and
are therefore ignored, despite NaCl being an evaporite.
Research indicating that surface processes are the dominant cause of salinity in upland environments is ignored. The claim that salinity is a hydrology problem, by hydrologists and hydrogeologists, confirms this.
Elevated soil salinity and water levels are new and unusual. Landscapes were apparently non saline prior to European settlement.
There is no long term monitoring to confirm this, indeed the opposite, that salinity in southern Australia is natural and common.
Shallow watertables are new and unusual and considered to have toxic salinity levels, which kills the native flora (rather than causing mortality from anoxia such as drowning of the roots from waterlogging).
Shallow watertables during wet periods, especially during winter, are common. No long term monitoring indicates that they are rare and unusual. Evidence indicating that they are toxic is also lacking.
Endemic flora and fauna is not adapted to elevated salinity levels (i.e. it is listed as a ‘Threatening Process’).
No evidence confirms this and considering saline and sodic soils are common and natural across the study region, it is illogical.
The vertical upwards movement of salinity through diffusion (salt ‘capillary rise’) is greater than the vertical downward
movement from leaching, despite gravity and the semi-impermeable clay rich B horizon.
There is no evidence to support the idea of salts ‘rising’ through the B horizon, then A horizons if they are present, against the force of gravity and periodic downward flow events during storms and wet periods.
That water movement equates to salt transport.
Peck (1978) indicates that water/salt movement are not directly coupled, reinforced by Blackmore (1984) describing salt sieving by clays. Water movement can therefore occur without salt being transported.
2.3.2. Model 2: ‘Transient Salinity’ or the ‘Surface Water Model’
A body of research has been published, particularly over the past decade, which indicates that much of the salinity problem in SE Australia is associated with, or due to, changes to overland flow and soil surface water (interflow). This literature is summarized below.