doi: 10.20964/11048
Int. J. Electrochem. Sci., 11 (2016) 3376 - 3382
International Journal of
ELECTROCHEMICAL
SCIENCE
www.electrochemsci.org
Short Communication
Cu
2O/RGO Composite as Anode Materials for Lithium Ion
Batteries
Hongdong Liu1, Zhongli Hu1, Rong Hu1, Haibo Ruan1, Yongyao Su1, Lei Zhang2,*
1
Research institute for new materials technology, Chongqing university of arts and sciences, Chongqing 402160, PR China
2
College of life science, Chongqing normal university, Chongqing 401331, PR China
*
E-mail: leizhang0215@126.com
Received: 25 January 2016 / Accepted: 3 March 2016 / Published: 1 April 2016
In this work, cuprous oxide/reduced graphene oxide (Cu2O/RGO) composite was successfully
synthesized by a low-cost, facile, green, solution-based chemical method. The as-synthesized products were characterized by X-ray powder diffraction (XRD). As anode materials for lithium ion batteries, the results show RGO can enhance the conductivity of Cu2O, as well as relieve the volume
expansion/contraction. Therefore, Cu2O/RGO composite shows high capacity retention, high
reversible capacity and excellent cycling stability.
Keywords: Cuprous oxide (Cu2O), lithium ion batteries, reduced graphene oxide (RGO),
electrochemical performance
1. INTRODUCTION
Rechargeable batteries have been considered as a fascinating power source for a series of modern electronic devices. Among the secondary batteries, lithium ion batteries have been extensively used in response to the fast advance of modern society due to their high energy density and long cycling life[1]. For lithium ion batteries, electrode materials are a critical factor for the electrochemical property of a certain battery. In several decades, many efforts have been devoted in search of alternative anode materials to construct high performance lithium ion batteries to improve the energy density, cycling stability and rate capability. Graphite is generally used anode material in lithium ion batteries. But unluckily, the theoretical capacity of the graphite is limited to be 372 mA h/g. To seek other materials for the replacement of graphite is appealing.
potential anode materials, cuprous oxide (Cu2O) as a p-type semiconductor with a band gap of 2.17
eV, has attracted considerable attention as an anode material because of its attractive advantages, such as reversible mechanism of electrode reaction, low cost, and easy production[6-8]. Moreover, Cu2O
exhibits better safety performance than graphite. However, like other conversion-based metal oxides anode materials, its implementation to lithium ion batteries is greatly hindered by its rate performances and poor cycling[9, 10]. To circumvent these problems, nanosized carbonaceous materials are generally chosen as matrices to improve the electrochemical properties of lithium ion batteries[11-13]. Especially graphene nano-sheet which is often prepared by reducing graphene oxide (RGO), is becoming one of the most attractive matrices in lithium ion batteries due to its unique properties, including high surface area, superior electrical conductivity, flexibility, and excellent mechanical intensity[14-17].
Herein, we prepared pure Cu2O and Cu2O/RGO composite through a low-cost facile, green,
solution-based chemical method. When evaluated as anode materials for lithium ion batteries, Cu2O/RGO composite exhibits high capacity retention, excellent cycling stability and reversibility.
2. EXPERIMENTAL
2.1 Synthesis of Cu2O/RGO
GO was synthesized from the natural graphite via modified Hummers method. RGO was obtained from GO by microwave irradiation. Cu2O/RGO was prepared by a solution-based chemical
reaction. In a typical synthetic procedure, 0.1 g RGO was dispersed in 500 mL of de-ionized water by ultrasonic dispersion for 1 h, and followed by addition of 0.85 g of CuCl2·2H2O, which was then being
stirred for 20 min at 60 oC. When the addition was completely dissolved, 50 mL of NaOH (2 M) was introduced to the solution. After this solution being stirred for 30 min, 50 ml of L-Ascorbic acid (0.6 M) was added slowly into the above solution under stirring. Then, the mixed solution was stirred for 3 h at 60 oC. Once being cooled to the room temperature naturally, the collected precipitates were centrifuged with de-ionized water and ethanol in several times, and the resulting product was dried in vacuum at 60 oC for 24 h. The pure Cu2O was prepared under the same condition but without RGO.
2.2 Materials characterization
The crystal structure of the as-synthesized samples was evaluated by means of X-ray powder diffraction (XRD) using a TD-3500X X-ray diffractometer with Cu Ka radiation at a scanning rate of 0.07 o s-1 between 10o and 80o.
2.3 Electrochemical measurements
form a homogeneous slurry. Subsequently, the slurry was uniformly coated onto the Cu foil and dried at 120 oC for 8 h under a vacuum condition. The electrolyte was 1 M LiPF6 with the mixture of
ethylene carbonate (EC) and dimethyl carbonate (DMC) (1:1 v/v). Lithium foil was used as the counter electrode and reference electrode. The cells were assembled in an Ar-filled glove box with both the oxygen and the moisture concentrations below 1ppm.
The charge/discharge measurements were carried out at the current density of 100 mA g-1 in the voltage range of 0-3 V using Battery Testing System (Neware BTS-610) at room temperature. Cyclic voltammetry (CV) measurements and electrochemical impedance spectroscopy (EIS) experiments were carried out on a CHI760E electrochemical workstation at the room temperature. CV measurements were measured at a scan rate of 0.2 mV/s. EIS experiments were measured in the frequency range from 0.1 Hz to 10000 Hz and the amplitude was 5 mV.
3. RESULTS AND DISCUSSION
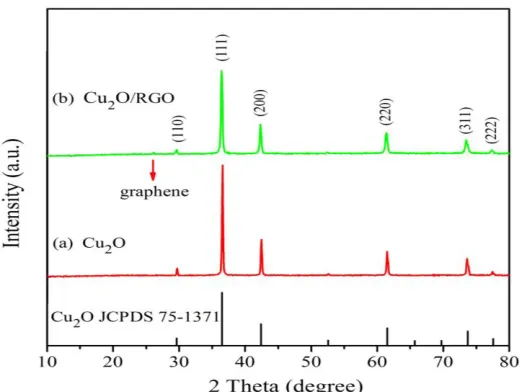
The crystal structure and phase impurity of pure Cu2O and Cu2O/RGO composite were
calculated by using XRD, and they were compared in Fig.1. As seen in Fig.1, for pure Cu2O samples
without addition RGO, all the diffraction peaks of 2θ values at 29.67°, 36.52°, 42.41°, 61.42°, 73.58° and 77.50° can be well attributed to (110), (111), (200), (220), (311) and (222) planes of the cubic phase of Cu2O (JCPDS 75-1531) without only impurities, respectively. The XRD pattern of
Cu2O/RGO sample matches well with the standard pattern known as cubic phase of Cu2O (JCPDS
75-1531), except for a no obvious diffraction peak at 26.17° belongs to RGO, indicating that Cu2O/RGO
[image:3.596.171.431.481.677.2]sample has been successfully prepared.
Figure 1. XRD patterns of pure Cu2O and Cu2O/RGO composite.
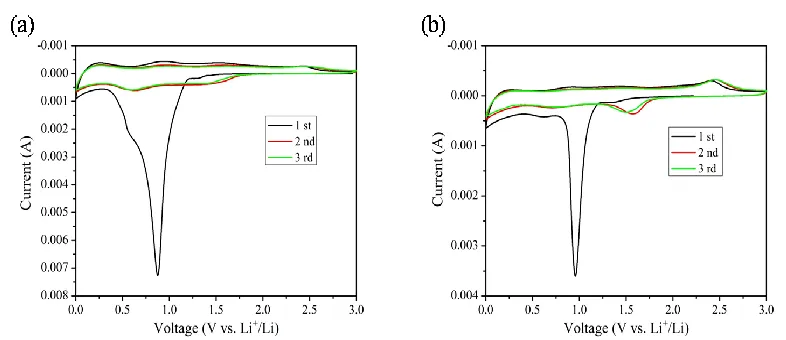
composite, respectively. For the Cu2O sample, it can be observed that there are three cathodic peaks, at
0.52 V, 0.88 V and 1.30 V in the first cathodic scan, which could respectively be attributed to the lithium insertion to the Cu2O, the formation of solid electrolyte interface (SEI) layer, and the reduction
of Cu2O to Cu[6, 18], and the cathodic peak at 0.88 V disappeared in the following scans. On the other
hand, two anodic peaks are observed at 0.93 V and 2.42 V, which may assigned to Cu2O oxidized from
Cu[18]. In the subsequent cycles, two cathodic/anodic couples around 0.55/0.90 V and 1.38/2.46 V are observed. And the curves remained steady, indicating that the electrode become more reversible. Compared with the Cu2O sample, the CV curves of Cu2O/RGO composite are mainly similar, but the
peaks shifted, the narrowed separation (ΔE) and intensities between the redox couples decreased. For Cu2O/RGO composite, there is no only peaks related to the graphene, which is due to the content of
graphene is too low. The main electrochemical reaction can be written as the following eqs (1). Cu2O + 2 Li+ + 2 e-⇄ 2 Cu + Li2O (1)
Figure 2. Cyclic voltammetry of (a) pure Cu2O, (b) Cu2O/RGO electrodes between 0 and 3.0 V at a
scan rate of 0.2 mV s-1 for the first three cycles.
Fig.3 displays the initial three galvanostatic discharge-charge curves of pure Cu2O, as well as
Cu2O/RGO sample. The initial discharge and charge capacities of pure Cu2O and Cu2O/RGO
composite are 473.2 and 148.8 mAh g-1, 731.1 and 356.6 mAh g-1, respectively. The high irreversible capacity loss is attributed to the irreversible formation of solid electrolyte interface (SEI) layer and electrolyte decomposition, which is commonly reported as anode materials[19-21]. The SEI layer is a passivation film of electrical insulation and ion conduction on the sample surface caused by the electrolyte decomposition, which can consume limited Li+ and increase the interface resistance between electrode and electrolyte. Besides, it is noted that the discharge and charge capacities are increased of Cu2O/RGO composites, which is due to the RGO could relief of the SEI formation and
electrolyte decomposition. In the first discharge process, all the samples show a similar potential plateaus at about 1.2 V and 0.8 V, which can be ascribed to the formation of a SEI layer and reduction of Cu2O to Cu, respectively. In the first charge process, the weak plateaus around 1.7 V and 2.5 V
correspond to the oxidation of Cu to Cu2O. To the subsequent cycles, the discharge curves show two
[image:4.596.101.494.292.462.2]
Figure 3. The discharge-charge profiles at the current density of 100 mA g-1 are plotted in (a) pure Cu2O, (b) Cu2O/RGO electrodes.
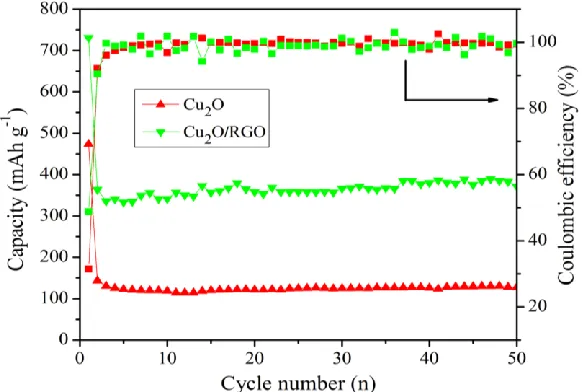
To further study the effect of nanostructure on the cycling performance, all the samples were evaluated by discharge-charge measurements at the current density of 100 mA g-1 between 0 and 3 V. The cycle curves and coulombic efficiency of the samples are shown in Fig.4. The discharge capacity of all samples decreases dramatically during the initial cycle, and from the 5th cycle, the discharge and charge capacity can be well maintained with coulombic efficiency about 99 %. The Cu2O delivers
discharge capacities of 473.2 mAh g-1 for the 1st cycle and 127.2 mAh g-1 after 50 cycles, respectively. Compared to the Cu2O, Cu2O/RGO composite delivers discharge capacity of 731.1 mAh g-1 for the 1st
cycle and it is retained 372.1 mAh g-1 after 50 cycles, which is higher than 348.4 mAh g-1 for previous report[22]. It is suggesting that RGO can enhance the conductivity of Cu2O, as well as relieve the
volume expansion/contraction.
Figure 4. Comparative cycling performance and coulombic efficiency of pure Cu2O and Cu2O/RGO
[image:5.596.104.497.68.243.2] [image:5.596.156.447.486.682.2]
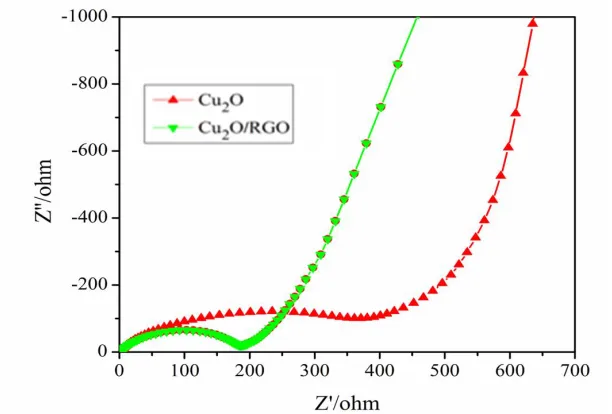
Typical electrochemical impedance spectroscopy (EIS) was carried out at room temperature to investigate electrical properties of all the samples are shown as Fig.5. The shapes of the Nyquist plots for the two samples are similar. These plots show one semicircle at the high frequency region, and an inclined line in low frequency region. The diameter of the semicircle is depending on the interface contact and charge transfer resistance. Obviously, compared with pure Cu2O, Cu2O/RGO composite
has a smaller diameter of the semicircle, indicating that Cu2O/RGO composite has a smaller interface
[image:6.596.146.452.226.433.2]contact charge transfer resistance and a bigger electrical conductivity. Thus it suggests that RGO can improve the electrical conductivity and facilitate the charge transfer and ion diffusion.
Figure 5. Nyquist plots of pure Cu2O and Cu2O/RGO electrodes.
4. CONCLUSIONS
In summary, the pure Cu2O and Cu2O/RGO composite were fabricated by a low-cost, facile,
green, solution-based chemical method. RGO can enhance the conductivity of Cu2O, as well as relieve
the volume expansion/contraction. Therefore, Cu2O/RGO composite shows high capacity retention,
high reversible capacity and excellent cycling stability. We believe that these superior materials should be useful for lithium ion batteries.
ACKNOWLEDGEMENTS
Reference
1. X. Zhang, Y. Hu, D. Zhu, A. Xie, Y. Shen, Ceramics International, 42 (2016) 1833.
2. H. Liu, J. Huang, X. Li, J. Liu, Y. Zhang, K. Du, Applied Surface Science, 258 (2012) 4917. 3. H. Liu, J. Huang, X. Li, J. Liu, Y. Zhang, Ceramics International, 39 (2013) 3413-3415.
4. A. Chen, C. Li, R. Tang, L. Yin, Y. Qi, Physical Chemistry Chemical Physics, 15 (2013) 13601. 5. H. Geng, Q. Zhou, J. Zheng, H. Gu, Rsc Advances, 4 (2014) 6430.
6. Y.-T. Xu, Y. Guo, C. Li, X.-Y. Zhou, M.C. Tucker, X.-Z. Fu, R. Sun, C.-P. Wong, Nano Energy, 11 (2015) 38.
7. Z. Hu, H. Liu, Journal of Materials Science-Materials in Electronics, 26 (2015) 5405. 8. W. Liu, G. Chen, G. He, W. Zhang, Journal of Nanoparticle Research, 13 (2011) 2705. 9. L.J. Fu, J. Gao, T. Zhang, Q. Cao, L.C. Yang, Y.P. Wu, R. Holze, H.Q. Wu, Journal of Power
Sources, 174 (2007) 1197.
10. Y. Zhang, X. Wang, L. Zeng, S. Song, D. Liu, Dalton Transactions, 41 (2012) 4316. 11. X. Shen, S. Chen, D. Mu, B. Wu, F. Wu, Journal of Power Sources, 238 (2013) 173.
12. L. Zhang, W. Hao, H. Wang, L. Zhang, X. Feng, Y. Zhang, W. Chen, H. Pang, H. Zheng, Journal of Materials Chemistry A, 1 (2013) 7601.
13. H. Liu, J. Huang, C. Xiang, J. Liu, X. Li, Journal of Materials Science-Materials in Electronics, 24 (2013) 3640.
14. C. Zhang, P. Zhang, J. Dai, H. Zhang, A. Xie, Y. Shen, Ceramics International, 42 (2016) 3618. 15. R. Tian, Y. Zhang, Z. Chen, H. Duan, B. Xu, Y. Guo, H. Kang, H. Li, H. Liu, Scientific reports, 6
(2016) 19195.
16. Z. Luo, Q. Xiao, G. Lei, Z. Li, C. Tang, Carbon, 98 (2016) 373.
17. Y. Li, H. Zhang, Y. Chen, Z. Shi, X. Cao, Z. Guo, P.K. Shen, ACS applied materials & interfaces, 8 (2016) 197.
18. C.Q. Zhang, J.P. Tu, X.H. Huang, Y.F. Yuan, X.T. Chen, F. Mao, Journal of Alloys and Compounds, 441 (2007) 52.
19. R. Zhou, R. Fan, Z. Tian, Y. Zhou, H. Guo, L. Kou, D. Zhang, Journal of Alloys and Compounds, 658 (2016) 91.
20. J. Zhao, Y. Shao, J. Zha, H. Wang, Y. Yang, S. Ruan, G. Yang, J. Chen, Ceramics International, 42 (2016) 3479.
21. N. Yan, Y. Xu, H. Li, W. Chen, Materials Letters, 165 (2016) 223.
22. G.-c. Yan, X.-h. Li, Z.-x. Wang, H.-j. Guo, Q. Zhang, W.-j. Peng, Transactions of Nonferrous Metals Society of China, 23 (2013) 3691.