Int. J. Electrochem. Sci., 11 (2016) 6719 – 6734, doi: 10.20964/2016.08.21
International Journal of
ELECTROCHEMICAL
SCIENCE
www.electrochemsci.org
Simple Surface Functionalization Strategy for Immunosensing
Detection of Aflatoxin B1
Mihaela Badea1, Laura Floroian2,*, Patrizia Restani3, Marius Moga4
1
Fundamental, Prophylactic and Clinical Specialties Department, Transilvania University of Brasov, 29 Eroilor Blvd, 500036, Brasov, Romania
2
Automation and Information Technology Department, Transilvania University of Brasov, 29 Eroilor Blvd, 500036, Brasov, Romania
3
Pharmacological and Biomolecular Sciences Department, Università degli Studi di Milano, Via Festa del Perdono, 7, 20122, Milano, Italy
4
Department of Medical and Surgical Specialties, Transilvania University of Brasov, 29 Eroilor Blvd, 500036, Brasov, Romania
*
E-mail: [email protected]
Received: 24 April 2016 / Accepted: 28 April 2016 / Published: 7 July 2016
This paper describes the strategy of functionalization of gold electrodes surfaces in aim to obtain a new impedimetric immunosensor for the detection of aflatoxin B1, a common toxic food contaminant. The immunosensor elaboration is based on immobilization of anti-aflatoxin antibody on gold electrodes modified with a cross-linked film of bovine serum albumin, by a four-step protocol. The immunosensor is based on a simple design and requires small volumes of toxic aflatoxin solution. All the steps of the immunosensor elaboration and the immunochemical reaction between aflatoxin and antibody were followed using atomic force microscopy (AFM) and electrochemical impedance spectroscopy (EIS). The resistance to charge transfer (Rct) was the most sensitive parameter to changes induced to the interfacial properties of the immunosensor by the incubation with aflatoxin and varied linearly with aflatoxin concentration in the range 1-20 ng/mL. The immunosensor was applied for the detection of aflatoxin in spiked plant extracts with good recovery factors.
Keywords: surface functionalization; aflatoxin B1 detection; impedimetric immunosensor; electrochemical impedance spectroscopy.
1. INTRODUCTION
microorganisms [4], and viruses, [5], up to DNA hybridization, and gene sequence [6] and detection of molecules relevant for biomedical field-e.g glucose [7], cancer biomarkers [8, 9] etc.
In order to build biosensors for particular applications the surface of physical transducers was modified by different strategies, allowing both immobilization of the specific biorecognition elements and sensitive detection: modification of gold surface via (poly)allylamine hydrochloride layer using electrostatic self-assembly technique [1], binding to the silanized surface via a cross-linker of glutaraldehyde [10], direct modification of glassy carbon electrode with gold nanoparticles [7], immobilization of enzyme using a biocompatible interface of silk fibroin [3], direct functionalization with biorecognition elements via formation of amine groups on the surface of GaN [11] etc.
A wide range of techniques have been used to characterize the various steps in the construction of biosensors, from electrochemical methods such as cyclic voltammetry [12,13] and electrochemical impedance spectroscopy (EIS) [2, 9, 12] to surface plasmon resonance (SPR) [1], total internal reflection ellipsometry [1], atomic force microscopy (AFM) [8], scanning electron microscopy [8] and ToF-SIMS [14].
In this work gold electrochemical transducers were functionalized with a cross-linked protein film and further modified with a specific antibody by covalent attachment, in order to obtain an immunosensor for aflatoxin B1. After each step in the construction of the immunosensor the electrical properties of the functionalized interfaces were characterized by EIS, while the topography of the modified electrodes was investigated by AFM.
Aflatoxin is a naturally occurring mycotoxin produced by two types of mold: Aspergillus flavus and Aspergillus parasiticus. Aspergillus flavus is common and widespread in nature and is most often found when certain grains are grown under stressful conditions such as drought.
More than13 different kinds of aflatoxin are produced in nature from which aflatoxin B1 is considered as the most toxic. While the presence of Aspergillus flavus does not always indicate harmful levels of aflatoxin it does mean that the potential for aflatoxin production is present.
The aflatoxins commonly found are: AFB1, AFB2, AFM1, AFM2 and AFG1, AFG2. They had been worldwide studied due to their negative effects on animal and human health as well as their negative impact on international trade. AFB1, AFB2, AFG1, and AFG2 have been classified as group I carcinogens by the International Agency for Research on Cancer [15]. Among these, AFB1 possesses the highest carcinogenic, teratogenic, mutagenic, and immunosuppressive potential and it is found in the highest concentration in foods and animal feeds [16]. Since aflatoxins cannot be entirely eliminated from food and animal feed even by current agronomic and manufacturing processes they are considered inevitable contaminants. Nevertheless, current European Community legislation establishes that 4 µg of total aflatoxins and 2 µg of AFB1 are the maximum permitted amounts per kg in figs or fig products, in nuts or nut products and cereals [17].
In liquorice root (ingredient for herbal infusion) and liquorice extracts (used in liquorice confectionery), the maximum allowed levels of aflatoxin B1 are fixed at 20 and 80 µg/kg, respectively, as European Commission (EC) Regulation No 105/2010 [18], amending Regulation 1881/2006.
fluorimetry, as the official method for aflatoxin determination in peanut butter, corn and raw peanuts at a total aflatoxin concentration more than 10 µg/kg [21]. Over the past two decades the immunoassays used for detecting aflatoxins and aflatoxin metabolites (including ELISA and radioimmunoassay) have been rapidly developed because of their simplicity, sensitivity, adaptability and selectivity. With regards to detection, electrochemical sensors have been often employed in these assays for Aflatoxin B1 and other micotoxins, from simple detectors in ELISA tests [22, 23] up to biosensors based on a variety of materials and detection schemes [-24-31].
Our group has developed electrochemical immunosensors, using screen-printed carbon electrodes (SPCEs), for determination of ochratoxin A in liquorice samples [32-34].
The preference for electrochemical detection systems is justified by their high sensitivity, low cost and compatibility with portability and miniaturization. One electrochemical method frequently employed with biosensors is EIS [31, 35, 36], as it determines changes in the electrical properties at the interface biosensor-sample solution that are associated with specific binding events due to the recognition between an analyte and a specific ligand.
In this work, a simple, low-cost impedimetric immunosensor for the detection of aflatoxin B1 was developed via the immobilization of the anti-aflatoxin B1 antibody on gold electrodes previously modified with a cross-linked film of bovine serum albumin. A four-step reaction protocol was tested to modify the gold electrode and obtain the sensing substrate. All the steps of the immunosensor elaboration and the immunochemical reaction between aflatoxin and the surface-bound antibody were analyzed using EIS, while morphological changes in the biosensing layer were determined by AFM. In the present work we investigated the use of impedance changes, due to the specific antigen-antibody reaction at the surface of the immunosensor for detecting aflatoxin B1. Specifically, the increase in electron-transfer resistance (Rct) at the interface was correlated with the concentration of aflatoxin in
the range of interest. We have also applied the impedimetric immunosensor to the detection of aflatoxin in spiked plant extracts.
2. EXPERIMENTAL
2.1. Materials and reagents
DRP-250AT gold printed electrodes from DS Dropsens (Spain) were used for the tests. Such electrodes incorporate a conventional three-electrode configuration, which consists in one disk-shaped gold working electrode, one platinum counter electrode and one silver/silver chloride pseudo-reference electrode. The working electrode has a 1.6 mm diameter and a 0.0196 cm2 geometrical area.
N-(3-dimethylaminopropyl)-N’-ethylcarbodiimide (EDC), N-Hydroxysuccinimide (NHS), potassium ferricyanide (K3Fe(CN)6), potassium ferrocyanide (K4Fe(CN)6), methanol 70% and
acetonitrile, ethanolamine and sulphuric acid were purchased from Chemical Company, Iasi (Romania).
2.2. Solutions and Buffers
BSA solution (5 mg/mL) and antibody solution (5 μg/mL) in acetate buffer (pH 5.6) were used in for electrode modification.
The electrolyte used in electrochemical impedance spectroscopy and cyclic voltammetry measurements was 5 mM K3[Fe(CN)6]/K4[Fe(CN)6] in 0.1 M KCl. Ethanolamine solution 1 M pH 8.5,
EDC (0.4 M) and NHS (0.1M) solutions were prepared in deionized water.Aflatoxin B1, 5 mg/mL was diluted in methanol 70% respecting RIDASCREEN Aflatoxin B1 30/15 ELISA kit procedure.
Preparation of liquorice sample solution:
Liquorice samples were provided by partners in the PLANTLIBRA European project (2010-2014 under grant agreement n° 245199). The samples were tested by ELISA by our group using RIDASCREEN Aflatoxin B1 30/15 ELISA kit procedure and found to be free of AFLA B1 [33].
The liquorice was crushed into mortar with pestle and 1 g of powder was mixed for 6 minutes with 5 mL of methanol 70%. The mixture was kept at rest for 5 minutes and then was filtered through absorbent filter paper and 0.2 μm Nylon syringe filter. This extract (stock solution) was further diluted 1:1000 in methanol 70% in order to be used for the experiment.
Spiked samples: A volume of 50 μL diluted plant extract (1:1000) was mixed with 50 μL aflatoxin in different concentrations in order to the final concentration of solutions to be 1, 5 and 10 50 ng/mL respectively.
Each experiment was performed three times and the measurements average was taken into account for data interpretation.
2.3. Apparatus and methods
Electrochemical studies. An Autolab PGSTAT100 potentiostat controlled by computer, from Eco Chemie (Netherlands) was used to perform the electrochemical measurements, which consisted in EIS and cyclic voltammetry (CV) experiments. The electrochemical impedance spectra were recorded at, in the frequency range from 104 to 10-1 Hz at at 20 frequencies/decade, at the formal potential of the ferricyanide/ferrocyanide couple (+0.178 V vs. screen-printed Ag/AgCl), over which was superimposed a 10 mV sinusoidal ac potential perturbation. The readings were were plotted in the form of Nyquist diagrams, representing the real and imaginary parts of electrochemical impedance (Z’ and Z”), using the FRA 4.9 software.
All measurements were done in 5 mM potassium ferri/ferrocyanide in 0.1M KCl, before and after incubation with the standard or sample solution.
choosing the most appropriate circuit for our experimental curves (Figure 1a, [37, 38]). For this circuit, using the facilities of FRA 4.9 software, we analysed each individual response for each experimental step and we considered the data where we obtained low Chi-square values. For each modified electrode, the impedance spectra were recorded before and after incubation with the standard or sample solution. The variation in the Rct following incubation with standard/sample was calculated as
ΔRct=Rct(after)-Rct(before) and was correlated with the concentration of aflatoxin in the sample.
Cyclic voltammetry experiments were performed in ferricyanide/ferrocyanide solution, with 0.1V/s scan rate between 0.2 and +0.4V vs screen-printed Ag/AgCl.
Atomic Force Microscopy (AFM).Topography of electrode surface was analyzed by AFM after each step of electrode modification. An Atomic force microscope NT-MDT Ntegra Spectra was used in tapping mode in air and areas of 20 μm X 20 μm were scaned at 20 nm/s.
2.4. Modification of the electrode and antibody immobilization
Dropsens gold screen-printed electrodes have been cleaned in 0.5 M H2SO4 solution by an
electrochemical pretreatment: 10 potential cycles between -0.3 and +1.5 V / reference electrode were applied, with 100 mV/s scanning rate, until the clean Au surface characteristic voltammogram was obtained. The clean gold electrodes were modified with cross-linked films of BSA, in order to prevent the non-specific aflatoxin binding onto gold and allow the further antibody covalent attachment [39-43]. A simple procedure proven to produce stable surfaces comparable with commercial functionalized SPR chips was used here [40].
A mixture of 50 µL BSA (5 mg/ mL), 20 µL EDC (0.4 M) and 20 µL NHS (0.1 M) was prepared and left undisturbed for 5 minutes at room temperature. After that, 10 µL of this mixture was dropped on the modified working electrodes and to react 30 minutes at room temperature in a dark and water-saturated atmosphere to prevent evaporation. The electrodes were then rinsed with a lot of water and dried in air jet.
Afterwards the terminal carboxylic groups of BSA were activated by adding 10 µL EDC/NHS mixture (1:1) onto the electrode surface and the electrode was allowed to react at room temperature in darkness and humid atmosphere for 40 minutes. The electrodes were then rinsed with water and dried in an air jet. The next step was the antibody immobilization, performed by dropping 10 μL anti-aflatoxin antibody solution (5 μg/mL) in 70% methanol on the modified electrode surface. The electrode was left undisturbed at room temperature for 1 h in darkness and humid atmosphere. After incubation, the electrode was rinsed with water to remove unbound antibodies and 75 μL ethanolamine solution (1M, pH 8.5) was dropped on the modified surface and incubated for 15 minutes to block unreacted active sites. These modified Ab/BSA-EDC-NHS/Au electrodes can then be stored dry at 4°C for several days without a decrease in the sensitivity, or can be subjected to immunochemical reaction. The analytical principle of this electrochemical immunoassay is shown in schematic representation in figure 1.
incubate for 45 min at room temperature in a humid and dark atmosphere. After incubation, the immunosensor was rinsed with a lot of water before the electrochemical measurements.
a) b)
Figure 1. a) equivalent electric circuit in EIS study and b) Schematic of the electrochemical immunosensor for aflatoxin B1 determination
Parameters such as the incubation time (tested between 15 and 45 min) and the amount of antibody/electrode (tested between 10-75 µL) were optimized to obtain good analytical characteristics, appropriate for Aflatoxin B1 detection in real samples.
3. RESULTS AND DISCUSSION
3.1. EIS determinations
0 2000 4000 6000 8000 10000 12000 14000 0
2000 4000 6000 8000 10000 12000 14000
Au electrode
BSA cross-linked film
Antibody AFLA
-Z
"
(O
h
m
cm
2)
Z' (Ohm cm2
)
-0.2 -0.1 0.0 0.1 0.2 0.3 0.4 -15
-10 -5 0 5 10 15
I (A)
E (V) vs Ag ref el
gold electrode
BSA/EDC/NHS antiAFLA
AFLA 15ng/mL
[image:6.596.77.524.124.244.2]a) b)
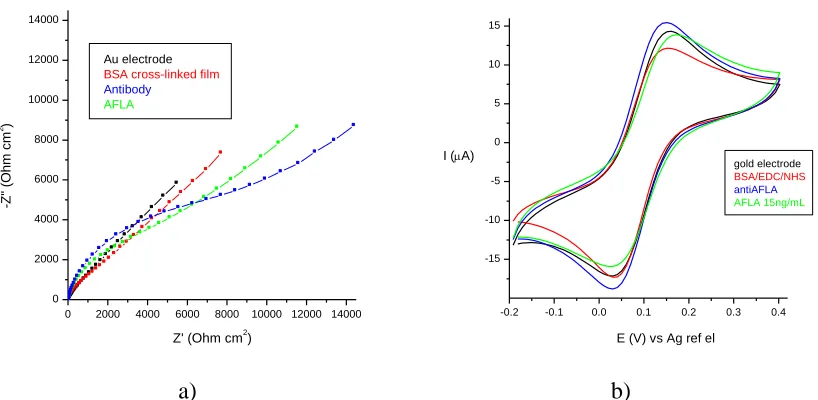
Figure 2. a) EIS Nyquist spectra in 5 mM ferricyanide/ferrocyanide in 0.1 M KCl after each step of electrode modification. b) Cyclic voltammograms in 5 mM ferricyanide/ferrocyanide solution in 0.1 M KCl recorded t 0.1 V/s after each step of electrode modification
[image:6.596.96.505.459.659.2]
to functionalize gold electrodes was described recently based on a cross-linked film of BSA formed on a gold substrate used for SPR studies [37-40]. While cysteine groups in BSA promote the initial strong protein attachment to gold substrate, cross-linking by classic carbodiimide chemistry ensure the solidity of the formed layer. This approach was followed by us to investigate the utility of a simple surface functionalization strategy for immunosensing electrochemical detection of Aflatoxin B1.
Electrochemical impedance spectroscopy can give a lot of information about the changes in electrical properties that appear at the interface sensor – solution during the biosensor building process (Figure 2). The initial empty gold electrode showed a very small semicircle domain (black diagram), implying an extremely low electron-transfer resistance (Rct) of the redox probe.
After deposition of the BSA layer on the electrode, the electron-transfer resistance had a significant increase up to 1223 Ω·cm2 (red diagram), because this organic layer is negatively charged in the neutral electrolyte used for EIS measurements (isoelectric point for BSA is 4.7). It behaves as a physical and electrostatic barrier for [Fe(CN)6]
4−/3−
anions, slowing down the ability of the redox probe to access the electrode surface and hindering the electron transfer kinetics between the redox probe and electrode. Antibody was afterwards covalently immobilized on the modified electrode and a significant drop in the Rct value to 285.36 Ω·cm2 was observed (blue diagram). It is because the covalent
attachment of the antibody has partly neutralized the negative charge of the BSA modified electrode. Subsequently, the Rct increased again, up to 722 Ω·cm2 with addition of 15 ng/mL aflatoxin (green
diagram) due to aflatoxin attachment to antibody bound on surface, which created an additional physical barrier against the transfer of electrons at the interface. The increase depended on aflatoxin concentration, allowing for using this immunosensor to detect the aflatoxin concentration in the measured sample. This behaviour is in accordance with results of other studies about biomolecular interactions at conductive surfaces from literature [44, 45].
The values of various electrical parameters derived by fitting the EIS data to the equivalent circuit in Figure 1a, namely solution resistance (Rs), electron-transfer resistance (Rct), constant phase
[image:7.596.74.522.577.722.2]element (Q) and Warburg impedance element (W) are shown in Table 1 for every step in biosensor building process.
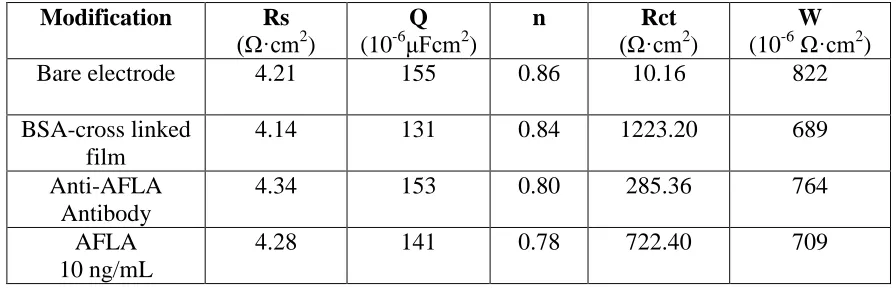
Table 1. Values of the equivalent circuit parameters for various steps of the immunosensor elaboration Modification Rs
(Ω·cm2
)
Q (10-6μFcm2)
n Rct
(Ω·cm2
)
W (10-6 Ω·cm2)
Bare electrode 4.21 155 0.86 10.16 822
BSA-cross linked film
4.14 131 0.84 1223.20 689
Anti-AFLA Antibody
4.34 153 0.80 285.36 764
AFLA 10 ng/mL
4.28 141 0.78 722.40 709
The constant phase element values depended very much on the dielectric constant of the layer separating the electrode surface and the ionic charges, the thickness of the separation layer and electrode surface area. Electron-transfer resistance Rct values depended on the insulating features at the
interface between electrode and electrolyte. The changes in Rct after incubation of the modified
electrode with aflatoxin were much larger than those in other impedance components. Thus, Rct was a
suitable signal for sensing the interfacial properties of the prepared immunosensor during all these assembly procedures.
The most obvious parameter is Rct and its variation was discussed above, but very suggestive is also variation of “n” parameter, that is roughness parameter [37] and that reaches “1” values for flat surface. During electrode modification, “n” decreases, indicating an increase in surface roughness, in accordance with AFM studies presented below in paragraph 3.3. This growth of active surface implies a growth in its electro-activity and this is the reason for that, in EIS and CV analyses, the parameters of modified electrode are better than the parameters of bare gold electrodes (Table 1, fig. 2).
3.2. Cyclic voltammetry analyses
3.3. Observation of surface electrode modification by AFM analysis
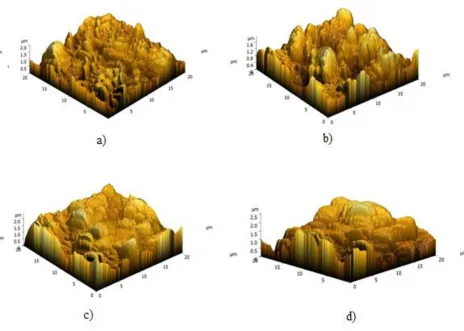
Morphological information gives a physical picture of how the antibody and antigen molecules are assembled on a biosensor surface. The root mean square roughness value (RMS) of images can also be analysed and related to the properties of surfaces. Figure 3 shows typical AFM topographies of the electrode surface after each subsequent immobilization step.
Figure 3a shows the image of a pure gold substrate with 318 nm root mean square roughness while figure 3b shows the electrode surface after its grafting with cross-linked BSA layer; RMS is now bigger (370 nm) because of covalent attachment of big BSA molecules, but topography of the surface is kept.
After further functionalization with antibody and blocking the unreacted carboxylic groups with ethanolamine, the surface topography changed (figure 3c) and an increase in roughness was observed up to a high value: RMS= 528 nm. This indicates successful immobilization of antibody on the electrode surface.
[image:9.596.51.515.366.697.2]After incubation with 100 ng/mL aflatoxin B1, the surface texture is changed again and this can be observed in Figure 3d. Surface roughness increased again, the RMS being 633 nm.
The results of morphological analysis obtained by using AFM are similar to those reported for other electrochemical immunosensors in literature [46-48] and indicated the electrode surface’s modification for each experimental step in order to demonstrate the feasibility of the immunoassay.
3.4. Biosensor calibration with AFLA B1
To evaluate the immunochemical reaction between anti-aflatoxin and aflatoxin, we exposed the Ab/BSA-EDC-NHS/Au electrode to different concentrations of aflatoxin and found that the Rct values
increased with the increase of aflatoxin addition.
0 20 40 60 80 100
50 100 150 200 250 300 350 400
D
R
c
t
(o
h
m
c
m
2 )
Aflatoxin B1 concentration (ng/mL)
0 5 10 15 20
0 50 100 150 200 250
D
R
c
t (
oh
m c
m
2 )
Aflatoxin B1 concentration (ng/mL)
SD=0.82 R2=0.9925 y=6.37x+90.27
a) b)
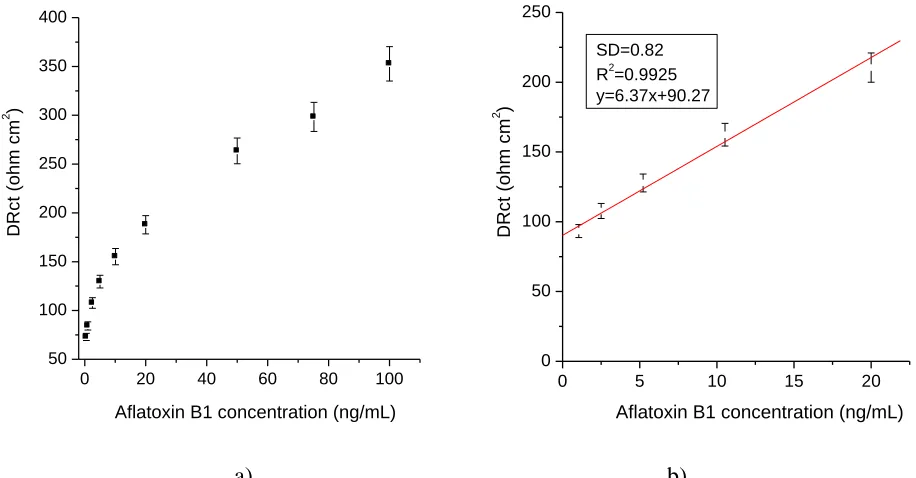
Figure 4. Calibration curve for aflatoxin B1 determination in the range 0.5-100 ng/mL (a) and representation of the linear range (b)
The resistance to charge-transfer of modified electrodes before incubation with various concentrations of aflatoxin was Rct(before) =296.6±21.4 Ω. This corresponds to an RSD of 7.2 % of
the Rct, proving the good reproducibility of the modified electrodes, especially considering that
electrode modification was done manually. The difference between Rct values after and before
incubation with aflatoxin ΔRct=Rct(after)-Rct(before) is considered the analytical signal. The calibration
curve was ploted (fig. 4a) and as it can be seen in figure 4b, there is a steady linear increase in ΔRct
(R2=0.9925) with the aflatoxin concentration in the range of 1-20 ng/mL.
[image:10.596.68.526.245.484.2]
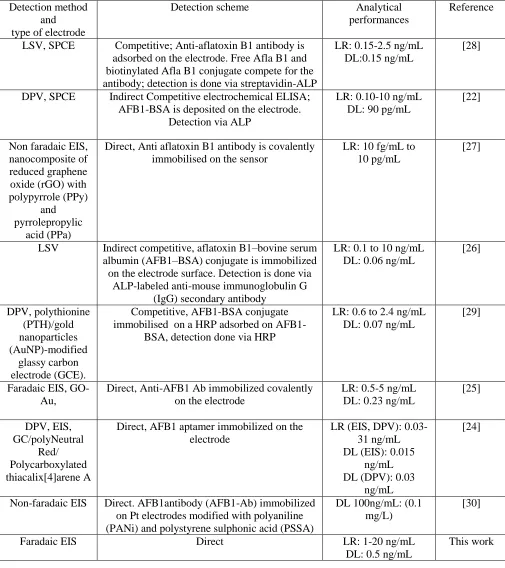
Table 2. Comparison of the analytical performances of the impedimetric immunosensor with other electrochemical immunosensors for aflatoxins reported in literature
Detection method and type of electrode
Detection scheme Analytical
performances
Reference
LSV, SPCE Competitive; Anti-aflatoxin B1 antibody is adsorbed on the electrode. Free Afla B1 and biotinylated Afla B1 conjugate compete for the antibody; detection is done via streptavidin-ALP
LR: 0.15-2.5 ng/mL DL:0.15 ng/mL
[28]
DPV, SPCE Indirect Competitive electrochemical ELISA; AFB1-BSA is deposited on the electrode.
Detection via ALP
LR: 0.10-10 ng/mL DL: 90 pg/mL
[22]
Non faradaic EIS, nanocomposite of reduced graphene oxide (rGO) with polypyrrole (PPy)
and pyrrolepropylic
acid (PPa)
Direct, Anti aflatoxin B1 antibody is covalently immobilised on the sensor
LR: 10 fg/mL to 10 pg/mL
[27]
LSV Indirect competitive, aflatoxin B1–bovine serum albumin (AFB1–BSA) conjugate is immobilized on the electrode surface. Detection is done via
ALP-labeled anti-mouse immunoglobulin G (IgG) secondary antibody
LR: 0.1 to 10 ng/mL DL: 0.06 ng/mL
[26] DPV, polythionine (PTH)/gold nanoparticles (AuNP)-modified glassy carbon electrode (GCE).
Competitive, AFB1-BSA conjugate immobilised on a HRP adsorbed on
AFB1-BSA, detection done via HRP
LR: 0.6 to 2.4 ng/mL DL: 0.07 ng/mL
[29]
Faradaic EIS, GO-Au,
Direct, Anti-AFB1 Ab immobilized covalently on the electrode
LR: 0.5-5 ng/mL DL: 0.23 ng/mL
[25] DPV, EIS, GC/polyNeutral Red/ Polycarboxylated thiacalix[4]arene A
Direct, AFB1 aptamer immobilized on the electrode
LR (EIS, DPV): 0.03-31 ng/mL DL (EIS): 0.015
ng/mL DL (DPV): 0.03
ng/mL
[24]
Non-faradaic EIS Direct. AFB1antibody (AFB1-Ab) immobilized on Pt electrodes modified with polyaniline (PANi) and polystyrene sulphonic acid (PSSA)
DL 100ng/mL: (0.1 mg/L)
[30]
Faradaic EIS Direct LR: 1-20 ng/mL
DL: 0.5 ng/mL
This work
[image:11.596.45.550.112.680.2]
resistance every day, the biosensor showed good stability, 90% of its activity is retained after 4 days of storage dry at 4 °C, result in accordance with those reported previously in the literature [49, 50].
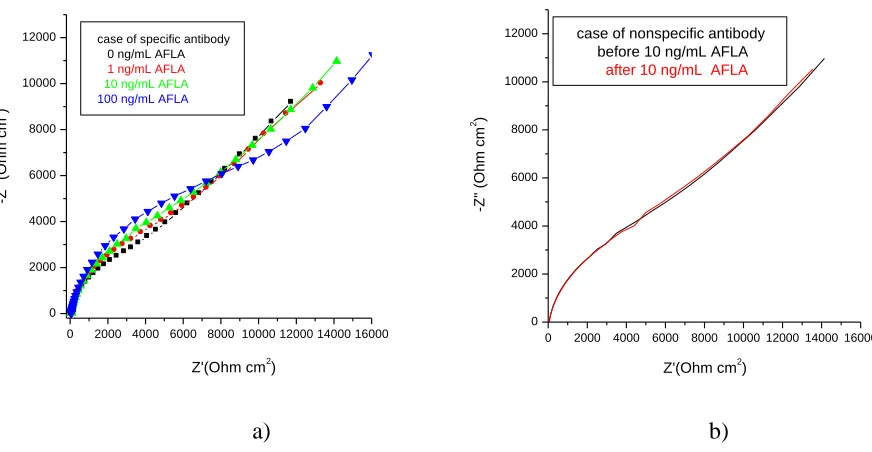
3.5. Biosensor specificity
Two experiments were carried out to verify that the recorded changes in electrochemical impedance did not appear due to nonspecific adsorption but they were indeed caused by the specific interaction between aflatoxin B1 and its antibody.
First, a “blank” sensor was fabricated using the same procedure as for the aflatoxin B1 biosensor but using a nonspecific antibody (the anti-OTA antibody). The “blank” sensor was incubated with 10 ng/mL of aflatoxin B1 and its response was compared to that of the aflatoxin B1 biosensor for the same concentration of micotoxin (Figure 5a and 5b). The control experiments using a nonspecific antibody emphasized no obvious impedance spectra changes after the incubation of the “blank” sensor with aflatoxin B1 (Figure 5b), in contrast with the significant response recorded when using the aflatoxin B1 biosensor (Figure 5a).
These results clearly confirmed that the impedance changes observed with the newly developed immunosensor were caused by specific interactions between aflatoxin B1 and its antibody and are not due to non-specific adsorption.
0 2000 4000 6000 8000 10000 12000 14000 16000 0
2000 4000 6000 8000 10000
12000 case of specific antibody 0 ng/mL AFLA 1 ng/mL AFLA
10 ng/mL AFLA 100 ng/mL AFLA
-Z
" (
O
h
m
c
m
2 )
Z'(Ohm cm2)
0 2000 4000 6000 8000 10000 12000 14000 16000 0
2000 4000 6000 8000 10000
12000 case of nonspecific antibody before 10 ng/mL AFLA
after 10 ng/mL AFLA
Z'(Ohm cm2)
-Z" (O
h
m
cm
2 )
[image:12.596.71.507.408.634.2]a) b)
Figure 5. Nyquist plots for various concentrations of aflatoxin B1 in case of immunosensor modified with specific antibody (a) and response of the immunosensor modified with nonspecific antibody for 10 ng/mL aflatoxin concentration (b).
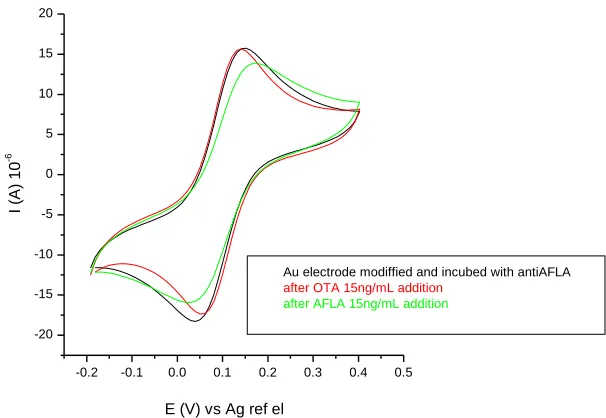
larger peak separation appeared in the voltammogram recorded with the same biosensor after incubation with 15 ng/mL aflatoxin B1.
-0.2 -0.1 0.0 0.1 0.2 0.3 0.4 0.5 -20
-15 -10 -5 0 5 10 15 20
I
(A
)
1
0
-6
E (V) vs Ag ref el
Au electrode modiffied and incubed with antiAFLA
after OTA 15ng/mL addition
[image:13.596.146.449.136.345.2]after AFLA 15ng/mL addition
Figure 6. Cyclic voltammograms of immunosensor modified with specific anti-aflatoxin B1 antibody before and after incubation with either 15 ng/mL aflatoxin B1 or15 ng/mL ocratoxin A.
3.6. Aflatoxin B1 detection in samples of plant extracts
Liquorice samples were spiked with aflatoxin B1 at 1, 5 and 10 ng/mL respectively as described in 2.2 “Solutions and Buffers”. Next, 75 µL of each sample solution were dropped on the surface of anti-aflatoxin-modified electrodes and left undisturbed for 30 minutes. The aflatoxin B1 biosensors were analysed by electrochemical impedance spectroscopy method and the Nyquist diagrams were recorded before and after incubation of the biosensors with the plant extracts.
[image:13.596.134.463.654.741.2]The matrix effect of diluted sample extract versus the sample without extract was analysed and the results showed a small standard deviation of around 0.0237 Ω cm2. Taking into account this matrix effect, the spiked samples (1, 5 and 10 ng/mL) were next analysed and the results are displayed in Table 3.
Table 3. Recovery degree for real samples AFLA
concentration (ng/mL)
ΔRct using real samples
(Ω cm2
)
ΔRct using standard samples
(Ω cm2
)
Recovery degree
(%)
1 91.31±0.72 95.28 95.83
5 121.01±1.03 119.03 101.66
As one can see from the results shown in Table 3, the obtained recovery degree clearly certifies that our proposed method is reliable and useful for testing aflatoxin B1 in liquorice.
4. CONCLUSION
A new sensitive, label-free, fast and cost-effective immunosensor for aflatoxin B1 detection was developed. This sensor is based on a screen gold electrode, which was easily modified with a cross-linked film of BSA that serves as an “anchor” for the covalent immobilization of the specific antibody. The deposition of the protective BSA film on the gold electrode prevents the nonspecific binding between aflatoxin B1 and the gold surface. The specific interaction between antibody and aflatoxin B1 induces an increase in electron transfer resistance at the interface immunosensor-solution that is related to aflatoxin B1 concentration in the sample.
Using morphological analysis (AFM) for each experimental step the modifications of electrode surface demonstrated the feasibility and viability of the immunoassay. The detection of aflatoxin B1 was achieved by EIS analysis on the linear range 1-20 ng/mL and the sensor was successfully tested for aflatoxin B1 detection in plant extracts samples.
Similar optimized functionalised surfaces could be developed for the detection of other biologically active compounds using immunosensing procedures based on detection by EIS.
ACKNOWLEDGEMENT
The writing of this work has received partial funding from the European Community’s Seventh Framework Programme (FP7/2007-2013) under grant agreement n° 245199. It has been carried out within the PlantLIBRA project (website: www.plantlibra.eu). This report does not necessarily reflect the Commission views or its future policy on these areas. This paper is also partial supported by the Sectoral Operational Programme Human Resources Development (SOP HRD), financed from the European Social Fund and by the Romanian Government under the project number POSDRU/159/1.5/S/134378 and Bursa Universitatii Transilvania-2016. We hereby acknowledge the structural funds project "R&D Institute: High-tech products for sustainable development" (ID 123, SMIS 2637, ctr. no. 11/2009) for providing part of the infrastructure used in this research. We would like to thank Anca Duta-Capra and Luminita Andronic from R&D Institute: High-tech products for sustainable development, Brasov for assistance with AFM analysis and also to Alina Vasilescu and Alis Vezeanu from International Centre of Biodynamics, Bucharest for assistance with preliminary EIS work.
References
1. A.V. Nabok, A. Tsargorodskaya, A.K. Hassan and N.F. Starodub, App. Surf. Sci., 246(4) (2005) 381.
2. L. Yu, Y. Zhang, C. Hu, H. Wu, Y. Yang, C. Huang and N. Jia, Food Chem., 176 (2015) 22. 3. R. Xue, T.F. Kang, L.P. Lu and S.Y. Cheng, App. Surf. Sci., 258(16) (2012) 6040.
4. P. Skládal, D. Kovář, V. Krajíček, P. Šišková, J. Přibyl and E. Švábenská, Int. J. Electrochem. Sci., 8 (2013) 1635.
7. G. Chang, H. Shu, K. Ji, M. Oyama, X. Liu and Y. He, App. Surf. Sci., 288 (2014) 524. 8. M.C. Canbaz and M.K.Sezginturk, Anal. Biochem., 446 (2014) 9.
9. M. Johari-Ahar, M.R. Rashidi, J. Barar, M. Aghaie, D. Mohammadnejad, A. Ramazani, P. Karami, G. Coukos and Y. Omidi, Nanoscale, 7(8) (2015) 3768.
10.T.Q. Huy, N.T. H. Hanh, P.V. Chung, D.D. Anh, P.T. Nga and M.A. Tuan, App. Surf. Sci., 257(16) (2011) 7090.
11.R. Stine, B.S. Simpkins, S.P. Mulvaney, L.J. Whitman and C.R. Tamanaha, App. Surf. Sci., 256 (13) (2010) 4171.
12.B.K. Kim, J. Li, J.E. Im, K.S. Ahn, T.S. Park, S.I. Cho, Y.R. Kim and W.Y. Lee, J. Electroanal. Chem., 671 (2012) 106.
13.J. Narayanan, M.K. Sharma, S. Ponmariappan, M Shaik and S. Upadhyay, Biosens. Bioelectron., 69C (2015) 249.
14.A. Azioune, J.J. Pireaux and L. Houssiau, App. Surf. Sci., 231–232 (2004) 402.
15.World health organisation International Agency for Research on Cancer (IARC), 1993, Monographs on the evaluation of carcinogenic risks to humans, Lyon.
16.J. Stroka and E. Anklam, Trend. Anal. Chem. C, 21 (2002) 90. 17.E. Anklam, J. Stroka and A. Boenke, Food Control, 13 (2002) 173.
18.D. Lerda, Factsheet Mycotoxins 4th edition, European Commision, Joint Research Centre, 2011. 19.L. Lin, J. Zhang, P. Wang, Y. Wang and J. Chen, J. Chromatogr. A, 815 (1998) 3.
20.M. Ventura, A. Gomez, I. Anaya, J. Diaz, F. Broto, M. Agut and L. Comellas, J. Chromatogr. A, 1048 (2004) 25.
21.Aflatoxins in corn, almonds, Brazil nuts, peanuts, and pistachio nuts, multifunctional column (Mycosep) method. Natural toxins, in: Scott, P. (Ed.), Official Methods of Analysis of AOAC International, 17th edition, volume II, 1995, AOAC International, Gaithersburg, Maryland, pp. 26. 22.N.H.S., Ammida, L. Micheli, S. Piermarini, D. Moscone and G. Palleschi, Anal. Lett., 39(8)
(2006) 1559.
23.W.B. Shim, M.J. Kim, H. Mun and M.G. Kim, Biosens. Bioelectron., 62 (2014) 288. 24.G. Evtugyn, A. Porfireva, V. Stepanova, R. Sitdikov, I. Stoikov, D. Nikolelis and T. Hianik,
Electroanal., 26 (2014) 2100.
25.S. Srivastava, M.D. Ali, S. Umrao, U.K. Parashar, A. Srivastava, G. Sumana, B.D. Malhotra, S.S., Pandey and S. Hayase, Appl Biochem Biotechnol., 174 (2014) 960.
26.Y. Tan, X. Chu, G. Shen and R. Yu, Analytical Biochem., 387(1) (2009) 82.
27.D. Wang, W. Hu, Y. Xiong, Y. Xu and C. Li, Biosens. Bioelectron., 63 (2015) 185. 28.R.M. Pemberton, R. Pittson, N. Biddle, G.A. Drago and J.P. Hart, Anal. Lett., 39 (2006) 1573. 29.J.H.O. Owino, A.O. Arotiba, N. Hendricks, E.A. Songa, N. Jahed, T. Waryo, R. Ngece, P. Baker
and E. Iwuoha, Sensors, 8 (2008) 8262.
30.J.H.O. Owino, A. Ignaszak, A. Al-Ahmed, P. Baker and H. Alemu, Anal. Bioanal. Chem., 388 (2007) 1069.
31.J.C. Vidal, L. Bonel, A. Ezquerra, S. Hernández, J.R. Bertolín, C. Cubel and J.R. Castillo, Biosens. Bioelectron., 49 (2013) 146.
32.L. Floroian, M. Badea, M. Moga, D. Floroian, A.S. Scollo and D.A. Perini, Proceeding of 12th International Conference on Fundamental and Applied Aspects of Physical Chemistry, Sept. 21-26, Belgrad, Serbia, (2014) 403.
33.A. Scollo, A. Perini, M. Badea, L. Floroian, A. Vasilescu and P. Restani, Proceeding of International Mycotoxin Conference – Perspectives on the Global Prevention and Control of Mycotoxins, 19-23 May 2014, Beijing. China.
34.A. Vasilescu, L. Floroian, M. Moga and M. Badea, Proceeding of International Plant LIBRA Conference 2014, May 12-14, Vienna, Austria, 2014.
36.E. Dinckaya, O. Kınık, M.K. Sezgintürk, C. Altug, and A. Akkoca, Biosens. Bioelectron., 26 (2011) 3806.
37.A.J. Bard and L.R. Faulkner, Electrochemical Methods: Fundamentals and Applications; Wiley and Sons ed., New York, 2007.
38.J.E.B. Randles, Kinetics of rapid electrode reactions. Discussions of the Faraday Society 1 (1947) 11.
39.A.E. Radi, Int. J. Electrochem., (2011) 1.
40.C. Polonschii, S. David, S. Tombelli, M. Mascini and M. Gheorghiu, Talanta, 80 (2010) 2157. 41.A.E. Radi, X. Munoz-Berbel, V. Lates and J.L. Marty, Biosens. Bioelectron., 24 (2009) 1888. 42.S.K. Vashist, C.K. Dixit, B.D. MacCraith and R. O’Kennedy, Analyst, 136 (2011), 4431. 43.S. K. Vashist, Diagnostics, 2 (2012) 23.
44.E. Katz and I. Willner, Electroanalysis, 15 (2003) 913.
45.D. E. Leckband, T. L. Kuhl, H. K. Wang, W. Muller, J. Herron and H. Ringsdorf, Methods, 20 (2000) 329.
46.A. Bogomolova, E. Komarova, K. Reber and T. Gerasimov, Anal. Chem., 81 (2009) 3944. 47.D.S. Yao, H. Cao, S. Wen, D.L. Liu, Y. Bai and W.J. Zheng, Bioelectrochemistry, 68 (2006) 126. 48.M.Ç. Canbaz and M. K. Sezgintürk, Anal. Biochem., 446 (2014) 9.
49.X. Liu and D.K.Y. Wong, Talanta, 77 (2009) 1437.
50.W. Xia, Y. Li, Y. Wan, T. Chen, J. Wei, Y. Lin and S. Xu, Biosens. Bioelectron., 25 (2010) 2253.