Open Access
Research article
Hospitalization for pertussis: profiles and case costs by age
Judith A O'Brien*
1and J Jaime Caro
1,2Address: 1Caro Research Institute, 336 Baker Avenue, Concord, MA, USA and 2Division of General Internal Medicine, McGill University, 687 Pine
Avenue, West, Montreal, Quebec, Canada
Email: Judith A O'Brien* - [email protected]; J Jaime Caro - [email protected] * Corresponding author
Abstract
Background: Pertussis, a highly contagious respiratory illness, affects people of all ages and can have serious clinical consequences. It has been reported that from 1997–2000, 20% of all pertussis cases required hospitalization in the US. This analysis examined demographics, case fatality rate, resource use and costs of hospital care related to pertussis by age.
Methods: ICD-9 codes (033.0, 033.9) were used to identify cases of pertussis in hospital discharge databases from roughly 1,000 US hospitals in 4 states (California, Florida, Maryland, Massachusetts). Data from 1996–1999 were examined by age group. Separate analyses were done for infants (<1 year) and children (1–11 years); however, adolescent and adult cases were combined into one group (12+ years), due to the small number of cases. Databases were used to determine demographics, health service utilization and care costs. Cost estimates include accommodations, ancillary and physician services, reported in 2002 US$.
Results: Of the 2,518 cases identified, 90% were infants. The inpatient case fatality rate was <1%. Of survivors, 99% were discharged home (6% with home health care); 1% required further sub-acute inpatient care. For the 2,266 infants, the mean LOS was 6 days at a cost of $9,586 per stay. Children (n = 191) had a mean LOS of 3.7 and cost of $4,729; adolescents/adults (n = 61, mean age 40 years) stayed on average 3.4 days with a cost of $5,683 per hospitalization.
Conclusion: Infants are responsible for the bulk of hospitalizations and generate higher inpatient costs. Costly hospital care occurs, however, in patients with pertussis at all ages.
Background
Bordetella pertussis is a highly contagious respiratory illness that can have serious clinical consequences. It is endemic in the United States (US) and every 3 – 5 years an out-break occurs [1]. It is most commonly thought of as a childhood disease, not ranking high on the list of differ-ential diagnoses for adolescents or adults presenting with respiratory symptoms. While this may be understandable as the reported incidence of pertussis declined by 99.6% between the mid-1930s to 1970s [2] due to effective
child-hood vaccination programs, clinicians need to be aware that pertussis continues to be a problem that is on the rise. Since the late 1980s, the incidence of reported pertussis has been increasing in most age groups in the US, partic-ularly among adolescents and adults [1,3-8]. The excep-tion was among young children where the reported incidence has remained stable and likely reflects protec-tion resulting from pertussis vaccinaprotec-tions administered as recommended [9]. In 2002, the greatest number of pertus-sis cases (n = 9,771) since 1964 were reported in the US Published: 11 July 2005
BMC Infectious Diseases 2005, 5:57 doi:10.1186/1471-2334-5-57
Received: 10 January 2005 Accepted: 11 July 2005
This article is available from: http://www.biomedcentral.com/1471-2334/5/57
© 2005 O'Brien and Caro; licensee BioMed Central Ltd.
resulting in an incidence of 3.4 per 100,000. In the period from 1990 to 2001, a 400% increase in the adult inci-dence was noted [10] and this is likely an underestimation [11]. Infants continue to be the most vulnerable group. In 2002, 21% of all reported cases were infants too young (age < 6 months) to have started the recommended vacci-nation program [9]. Nationwide in that year, the reported incidence for infants less than six months old was 108.8 compared to 1.2 per 100,000 among those aged 20 years and older [9]. According to the Centers for Disease Con-trol (CDC), pertussis is the only disease for which child-hood vaccination is recommended that has had an increase in incidence in the past 20 years [10].
There is a common misconception vaccinating children for pertussis protects them forever. That is not the case. Immunity achieved through childhood vaccinations starts to diminish after three years with little protection left after twelve years [12-15]. Boosters are not recommended after seven years of age [2] so older adolescents and adults are vulnerable. Furthermore, those who contract pertussis later in life may go undiagnosed, but their sustained cough spreads the infection among family, friends, associ-ates and health care workers [2,6,7,13,15-17].
Although outpatient management with antibiotics, usu-ally erythromycin, is the expected treatment for pertussis [1], hospitalization does occur for those with complica-tions [18-21]. According to the CDC, from 1997 – 2000, 20% of all patients with reported pertussis required hos-pitalization. This rate was much higher (63%) in infants younger than 6 months [22]. The objective of this analysis was to examine cases of pertussis admitted to US hospitals over a period of four years. Case fatality rates, complica-tions, resource use and inpatient care costs by age group were studied.
Methods
The cost of hospital care was determined by analyzing inpatient resource use and costs reported in all payer dis-charge databases from four states representing different areas of the US. Discharge and cost data from roughly 1,000 hospitals in California, Florida, Massachusetts and Washington State for the years 1996 through 1999 were analyzed to identify cases of pertussis, defined as those admitted with an International Classification of Diseases – 9th Revision – Clinical Modification (ICD-9) code of
either 033.0 or 033.9 [23] as the principal diagnosis for all age groups. These databases contain merged discharge-level demographic, clinical and economic data for all hos-pital discharges reported in each state within a given year for patients of all ages. Data on length of stay (LOS), charges incurred, source of admission and discharge dis-position were abstracted for each patient. Secondary diag-nosis codes reported in the databases were examined for
complications of pneumonia in whooping cough (ICD-9 code: 484.3), other pneumonias (ICD-9 codes: 480.0– 484.1, 484.4–486), convulsions (ICD-9 codes: 780.31, 780.38), apnea (ICD-9 codes: 770.8, 786.03), encepha-lopathy (ICD-9 codes: 348.3, 348.5) and acute respiratory distress, failure or arrest (ICD-9 codes: 518.0, 518.81, 518.82, 786.09, 799.0, 799.1).
The acute care hospital costs reported include all accom-modations (e.g., routine, intensive care unit, nursery), ancillary (e.g., pharmacy, laboratory, imaging), and phy-sician services. As costs pertaining to phyphy-sicians' services are not included in the discharge data, it was necessary to estimate an average cost of inpatient physician services. This estimate was derived by determining the type and fre-quency of visit or service, applying the appropriate unit cost for each and multiplying it by the proportion of inpa-tients using that service. Explicit data regarding type of visit and services are not provided; therefore, data ele-ments from the discharge databases providing informa-tion pertinent to physician care, such as LOS, procedure codes, special care unit stays, emergency department use prior to admission, admission source and discharge status were used to establish a likely inpatient physician visit/ service profile for each age group. The appropriate Physi-cians' Current Procedural Terminology (CPT-4) code was assigned to each visit, service or procedure [24] in the pro-file. A unit cost representative of diverse payers was estab-lished using fee schedules [25,26] and pubestab-lished payer ratios [27], and applied to each CPT-4 code in the profiles. Where physician fee data from a single state were used (i.e., Florida Medicaid physician fees), state costs were adjusted to national values using published ratios [28].
first, then these were combined giving equal weight to each state to avoid states with substantially larger popula-tions from being overrepresented.
Cases were analyzed by age groups defined initially as: infants (aged less than 1 year); children (1 through 11 years); adolescents (12 through 17 years) and adults (age greater than 22 years); however, as the number of adoles-cent and adult cases was insufficient to analyze as separate groups, they were combined.
Seasonal occurrence was explored in terms of the month of hospitalization, except for Florida that reported only the quarter. Analyses by calendar quarter were also carried out for all cases.
Incidence estimates for the states represented in this anal-ysis, as well as nationwide, for the years 1996 – 1999 were obtained from the CDC [30-33] or the individual state Departments of Health [34-37]. When a discrepancy occurred, the data from the source with the higher number of cases reported for that year was used.
Results
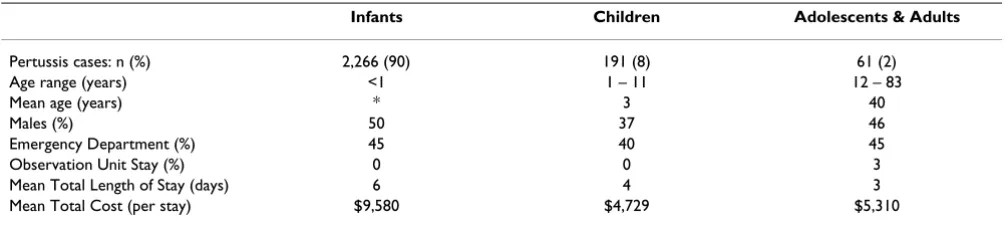
A total of 2,518 cases admitted to hospital for pertussis during the four-year period were identified (Table 1). Females accounted for 51% of the admissions. The mean age was 2.3 years (range: 0 – 83 years), but 90% of cases were younger than 1 year (median: <1 year) and most of the rest (8%) were for children. Admission via the emer-gency department was noted in 45% and 3% spent time in an observation unit prior to hospitalization.
The third quarter (July through September) accounted for more admissions (33%) than the other quarters. For infants and children, spring and summer months had the most admissions, while among older patients, summer and fall were more active (Figure 1).
The mean LOS was 6 days (median: 3.5, range: 1 – 110 days) and 13% of patients spent a portion of their stay in an intensive care unit. The mean cost of a hospital stay was estimated to be $9,130 per person (median: $4,600, range: $520 – $507,697). The cumulative cost over four years for all hospitalized pertussis cases examined in this study was estimated to be $29.4 million. Medicaid, a health insurance plan jointly funded by federal and state governments for those with low income who qualify, was the responsible payer for the majority (54%) of hospital-ized cases. Managed care organizations were the next larg-est payer group, responsible for almost one third (31%) of the hospital stays.
Pneumonia was coded in 6% of cases and apnea or respi-ratory failure in 4%. Convulsions were recorded for 1%. Encephalopathy was recorded in less than 1% (0.3%) of all cases. The case fatality rate was less than 1% (n = 7). Six of the deaths occurred among infants, and the other was a patient aged 75 years. The vast majority (99%) went home (6% with other home health care services) and the rest (1%) returned to long-term or residential care facilities.
During the years 1996 to 1999, the four states reported 9,605 pertussis cases, representing one third of all cases reported in the US over that period [30-37]. Hospitalized cases were 26% of those reported in these four states. This proportion varied substantially by state (Figure 2).
Infants
[image:3.612.54.557.100.213.2]Those less than one year of age accounted for 90% (n = 2,266) of all pertussis admissions. Males and females were represented equally. As precise age data are not avail-able in these data sets, the distribution by month of age cannot be determined. A stay in an observation unit prior to admission was noted in 3% of cases and 45% were treated in the emergency department prior to admission. The majority (59%) of hospitalizations for infants occurred in the months of April through September. Pneumonia was coded in 12% of infant cases; apnea,
Table 1: Summary of hospital stay results for pertussis by age group
Infants Children Adolescents & Adults
Pertussis cases: n (%) 2,266 (90) 191 (8) 61 (2)
Age range (years) <1 1 – 11 12 – 83
Mean age (years) * 3 40
Males (%) 50 37 46
Emergency Department (%) 45 40 45
Observation Unit Stay (%) 0 0 3
Mean Total Length of Stay (days) 6 4 3
Mean Total Cost (per stay) $9,580 $4,729 $5,310
respiratory distress or failure in 16%; convulsions in less than 1%, and encephalopathy in 0.2%. The mean LOS was 6 days (median: 4.5, range: 1 – 110 days) and 14% of all infants spent an average of 8 days in an intensive care nursery or pediatric intensive care unit. The cost per hos-pital stay averaged $9,580 (median: $4,670, range: $515 – $496,712). The inpatient case fatality rate was less than 1%. All survivors went home, of whom 6% were referred for home health care services, with less than 1% dis-charged on continuing intravenous drug therapy. Medic-aid was the responsible payer for 57% of the hospital stays.
Children
Children, aged 1 through 11 years, represented 8% (n = 191) of the admissions. The majority was female (63%)
and 40% were seen in the emergency department prior to admission. The mean age for children was 3 years (median: 2). The average stay was 3.7 days (median 3, range 1 – 10 days); 15% had pneumonia coded; 5% con-vulsions and 8% apnea, respiratory distress or failure. Admissions for children were more in the summer months, (58%) in the months of June through Septem-ber. The cost per hospital stay, estimated at $4,729 (median: $4,400, range: $537 – $49,945), was the lowest of the three age groups. This was not merely a reflection of the shorter stays but also a lower average per diem cost ($1,233) compared to infants ($1,347) and adolescents/ adults ($1,612). No children died during hospitalization; all were discharged home (4% with home health care services). Medicaid (42%) and managed care
Admissions for pertussis by age group for years 1996 – 1999 by months of hospitalization
Figure 1
Admissions for pertussis by age group for years 1996 – 1999 by months of hospitalization.
0%
5%
10%
15%
20%
25%
30%
35%
40%
45%
50%
Infant
Child
Adolescent/Adult
P
er
tu
ssi
s
C
ases
Jan-Mar (Winter) Apr-June (Spring) July-Sept (Summer) Oct-Dec (Fall)
0%
5%
10%
15%
20%
25%
30%
35%
40%
45%
50%
Infant
Child
Adolescent/Adult
P
er
tu
ssi
s
C
ases
organizations (39%) were responsible for most of the hospital stays.
Adolescents and adults
Those aged 12 and older represented only 2% (n = 61) of the hospitalized cases. Slightly more than half (54%) of them were female; mean age 40 years (median: 40, range: 12 – 83 years, Figure 3). Adults (mean age 50 years, median 49 years, range: 22 – 83) had the highest rate (48%) of admissions via the emergency department while the 17 adolescents (mean age: 13.5 years, range: 12–18 years) had the lowest rate (29%) of all groups, but 17% spent time in an observation unit prior to hospitalization.
One third (32%) of these admissions occurred between July and September; another 28% were admitted from October through December. The mean LOS was 3.4 days (median: 3, range: 1–11 days) and did not vary apprecia-bly by age (adolescents, mean: 3, median: 3.2 days; adults, mean 3.4, median 3 days). In the small sample of adoles-cents, no one spent time in an intensive care unit, whereas 11% of the adults did, an average of one day. Pneumonia was noted in 11%; respiratory distress or failure in 8%; and convulsions in 2%. Among these patients, only one, aged 75 years died during hospitalization. The average cost per stay was $5,310 (median: $4,293, range: $685 – $27,625). All survivors went home, with 4% referred for
Number and proportion of hospitalized compared to all reported pertussis cases by state for 1996 – 1999
Figure 2
Number and proportion of hospitalized compared to all reported pertussis cases by state for 1996 – 1999.
0
1000
2000
3000
4000
CA
FL
MA
WA
Ca
se
s
(n
)
52%
4%
84%
10%
Reported Cases
Hospitalized Cases
0
1000
2000
3000
4000
CA
FL
MA
WA
Ca
se
s
(n
)
52%
4%
84%
10%
Reported Cases
Hospitalized Cases
home health care. Managed care organizations were the responsible payer for 43% of the patients in this group, the largest primary payer for both adolescents and adults. In the adult group, Medicare was the primary payer for 18% of the cases. Medicare is the federally funded health insurance program for those aged 65 years and older, as well as some younger patients who qualify because of disabilities.
Discussion
This study shows that hospitalization is a common conse-quence of pertussis severe enough to be diagnosed and reported – one quarter of the cases of pertussis in these
four states were admitted. Almost all of these patients admitted with pertussis survived and returned home, yet these results show that the economic consequences of per-tussis at any age can be considerable. This has budgetary implications for both the public and private sector, as the responsible payers for the majority of cases were Medicaid or managed care organizations. Caring for patients with pertussis who require hospitalization generates millions of dollars in health care expenses and yet this substantial amount is a conservative estimate as it reflects but one aspect of care. As the focus of this analysis was limited to examining direct medical care costs incurred during hos-pitalization, post-acute care and outpatient care costs were
Age distribution of adolescent/adult hospitalized pertussis cases
Figure 3
Age distribution of adolescent/adult hospitalized pertussis cases. 28%
20%
34%
18%
0% 10% 20% 30% 40% 50%
Case
s
(%)
20-39 Years (n=12) 12-19
Years (n=17)
40-59 Years (n=21)
not included in the estimates. Most patients will be treated as outpatients and will use other health care services, such as office and emergency department visits, and antibiotics. Neither those costs nor indirect costs have been considered in this analysis; however, a study exam-ining pertussis cases in one New York county over a six year period from 1989–1994 [38] reporting inpatient and outpatient care costs noted that the cost of hospitalization represented one of the two largest contributing costs asso-ciated with pertussis. Furthermore, this study and another [39] by the same author, also examined indirect costs related to pertussis and found that work-related (e.g., lost work days, decrease in productivity) costs were responsi-ble for more than 60% of the overall cost of pertussis when both direct and indirect costs were considered. Thus, while the cost of hospital care provides a key com-ponent of pertussis-related care costs and must be consid-ered in any economic analysis of the disease, it does not convey fully the economic impact of the disease.
The sample size for adolescents and adults in this analysis was small. There are several possible reasons for this. Per-tussis in older patients often presents in an atypical man-ner without the characteristic whoop [2,6,7,13], which may contribute to misdiagnosis. In such circumstances, those cases would not be identified by the pertussis-related ICD-9 codes and therefore not captured, or counted, for this analysis. It is more likely, however, that the severity of pertussis in older age groups does not war-rant inpatient management as often as required for infants and young children. In the 1993 pertussis outbreak in Cincinnati [5], 84% of the hospitalizations were among those less than 12 months old.
Pneumonia was noted as a complication in 6% for all cases and in 12% of infants in our analysis. For seizures, we report a 1% rate for all cases and <1% for infants; 0.3% and 0.2% rates of encephalopathy in all cases and among infants, respectively. These rates appear comparable to those reported by the CDC based on data from 1997– 2000 [40]. Among all reported cases, pneumonia occurred in 5.2% of pertussis cases and in 11.8% of infants < 6 months. Seizures were reported by the CDC in 0.8% for all reported pertussis cases and 1.4% for infants; encephalopathy among 0.1% for all cases and 0.2% among infants. Rate reporting for other age groups is not done in a comparable manner as the range of ages within the child and adolescent/adult group differ; however, it does appear that the rates of 15% among children and 11% among adolescents/adults for pneumonia coded in our analysis are higher than rates reported for all ages over age one year by the CDC. The reason for this discrepancy is unknown. It may reflect an error in coding or that this analysis is based only on more severe hospitalized cases;
whereas, the CDC is reporting complications rates for all reported cases of pertussis.
Using data from any large administrative database raises concern about potential coding errors. The coding error rate for pertussis in the state databases is unknown, but it is not uncommon for an infectious disease to be identified with less specific codes. This has been reported for other conditions, such as pneumonia [41]. Therefore, it is pos-sible that pertussis cases could have been coded to more generic respiratory conditions, such as unspecified upper respiratory infection (ICD-9 code 465.9). In 1999, there were 5,449 hospitalizations in these databases coded with this non-specific principal diagnosis. It has been reported that 39% of university students [6] who were ultimately determined to have pertussis were first diagnosed by their primary care provider as having an upper respiratory tract infection. Another 48% in that study were misdiagnosed with bronchitis.
A large proportion of the reported cases in some of the states were hospitalized, possibly suggesting that only the most severe cases are being reported; however, this analy-sis showed a large disparity in these proportions among the four states. The reason for the disparity is not known and can not be determined based on the data available. It is more likely, however, that there are multiple factors contributing the variability seen in the rates of hospitalization among states rather than a differing clini-cal profile or admitting threshold. Among these factors could be how pertussis cases are reported in each state, the number of cases of infant versus adolescent/adult disease for a state, or that many are not being diagnosed correctly and therefore go unreported.
Based on the results of our analysis and those of others [2,8,11,12,14,15,21], it is evident that pertussis is neither a disease limited to childhood nor one that has been con-quered through current immunization programs. The rise in pertussis incidence in the past several years highlights the growing vulnerability of those beyond the protection afforded by childhood immunization. While newer acel-lular pertussis vaccines may permit extension of immu-nity to an older population, until very recently booster doses of pertussis-containing vaccines were not available for those over the age of seven years [1].
Clearly, the impact of immunization on the disease bur-den and costs will depend largely on the extent of herd immunity attained and this is not yet securely known for any particular level of coverage.
Conclusion
The results reported in this analysis, albeit limited to one level of management, illustrate how costly it can be to manage pertussis when hospitalization is required. These results provide decision makers concerned with the eco-nomic aspects of preventing and treating pertussis with recent and relevant cost estimates for a substantial cost component of managing pertussis; however, to assess the cost of an expanded vaccination program, all aspects of the economic burden of caring for patients with pertussis, including indirect costs, will need to be considered.
Competing interests
Caro Research, of which Judith A. O'Brien and J. Jaime Caro are shareholders, received an unrestricted grant from Aventis Pasteur SA for this work. Relevant staff from Aventis Pasteur SA were allowed to review and comment on this manuscript but were explicitly forbidden from exerting any editorial control. The authors are employees of Caro Research. Expenses for travel to present the find-ings at the 2004 International Congress of Infectious Dis-ease were reimbursed.
Authors' contributions
JAO conceived of and designed the study, performed the analysis, and participated in drafting the manuscript. JC participated in the design of the study and participated in drafting the manuscript. All authors read and approved the final manuscript.
Acknowledgements
The authors wish to thank Piedad Duran and Clare Pitoniak-Morse of Caro Research Institute for their assistance with the data analysis.
References
1. Centers for Disease Control. Divisions of Bacterial and Mycotic Diseases. Diseases of Infection: Pertussis – Technical Information [http://www.cdc.gov/ncidod/dbmd/diseaseinfo/ pertussis_t.htm]
2. Bass JW, Stephenson SR: The return of pertussis. Pediatr Infec Dis J 1987, 6:141-144.
3. From the Centers for Disease Control. Resurgence of Per-tussis – United States: 1993. JAMA 1994, 271:340-341. 4. Centers for Disease Control. Pertussis surveillance: United
States, 1986–1988. JAMA 1990, 263(8):1058-1059.
5. Christie CDC, Marx ML, Marchant CD, Reising SF: The 1993 epi-demic of pertussis in Cincinnati: resurgence of disease in highly immunized population of children. NEJM 1994,
331:16-21.
6. Morgan-Mink CA, Cherry JD, Christenson P, Lewis K, Pineda E, Shlian D, Dawson JA, Blumberg DA: A search for Bordetella pertussis infection in university students. Clin Infect Dis 1992, 14:464-471. 7. Cromer BA, Goydos J, Hackell J, Mezzatesta J, Dekker C, Mortimer EA: Unrecognized Pertussis Infection in Adolescents. AJDC
1993, 147:575-577.
8. Nenning ME, Shinefield HR, Edwards KM, Black SB, Fireman BH:
Prevalence and Incidence of Adult Pertussis in an Urban Population. JAMA 1996, 275:1672-1674.
9. Centers for Disease Control. Summary of Notifiable Dis-eases, United States 2002. MMWR 2004, 51(53):1-84. 10. Centers for Disease Control. Pertussis Outbreak Among
Adults at an Oil Refinery Illinois 2002. MMWR 2003, 52:1-4. 11. Herwaldt LA: Pertussis in Adults. Arch Intern Med 1991,
151:1510-1512.
12. Lambert HJ: Epidemiology of a small pertussis outbreak in Kent County, Michigan. Public Health Rep 1965, 80:365-369. 13. Mortimer EA: Pertussis and Its Prevention: A Family Affair.
The Journal of Infectious Diseases 1990, 161:473-479.
14. Jenkinson D: Duration of effectiveness of pertussis vaccine: evidence from a 10 year community study. BMJ 1988,
296:612-614.
15. Mink CM, Sirota NM, Nugent S: Outbreak of Pertussis in a Fully Immunized Adolescent and Adult Population. Arch Pediatr Adolesc Med 1994, 148:153-157.
16. Kurt TL: Pertussis Immunization for medical personnel. Ann Intern Med 1972, 76:1046-1047.
17. Kurt TL, Yeager AS, Guenette S, Dunlop S: Spread of pertussis by hospital staff. JAMA 1972, 221:264-267.
18. Marchant CD, Loughlin AM, Lett SM, Todd CW, Wetterlow LH, Bic-chieri R, Higham S, Etkind P, Silva E, Siber GR: Pertussis in Massa-chusetts, 1981–1991:Incidence, Serologic Diagnosis, and Vaccine Effectiveness. The Journal of Infectious Diseases 1994,
169:1297-1305.
19. Sutter RW, Cochi SL: Pertussis hospitalizations and Mortality in the United States, 1985–1988. Evaluation of the Com-pleteness of National Reporting. JAMA 1992, 267:386-391. 20. Gan VN, Murphy TV: Pertussis in Hospitalized Children. A in J
Dis Child 1990, 144:1130-1134.
21. Lee LH, Pichichero ME: Costs of Illness Due to Bordetella per-tussis in Families. ArchFam Med 2000, 9:989-996.
22. CDC. Pertussis – United States, 1997–2000. MMWR 2002,
51:73-6.
23. Hart A, Hopkins CA, eds: 2001 ICD-9-CM Code Book West Valley City, UT: St. Anthony Publishing Inc. and Ingenix, Inc; 2000.
24. American Medical Association: Physicians' Current Procedural Terminology Chicago, IL: American Medical Association; 2001.
25. 2002 Physician Fee Schedule Payment Amount File
National/Carrier. Centers for Medicare and Medicaid Services [http://www.cms.hhs.gov/providers/pufdownload/#pfspay ment]
26. 2001 Florida Medicaid physician fee schedule [https://florida medicaid.acs-inc.com/XJContent/All-2001.zip?id=000000000049] 27. Veririlli DK, Zuckerman S: Health Care Financing Review 1996,
17(3):161-170.
28. U.S. Department of Health and Human Services: Centers for Medicare & Medicaid Services Office of Research, Development, and Information
Baltimore, MD: Medicare and Medicaid Statistical Supplement, 2001. Health Care Financing Review. Pub. No. 03441; 2003.
29. Bureau of Labor Statistics [http://www.bls.gov/cpi/home.htm] 30. Centers for Disease Control. Summary of Notifiable
Dis-eases, United States 1996 MMWR 1997, 45(531-87 [http:// www.cdc.gov/mmwr/PDF/wk/mm4553.pdf].
31. Centers for Disease Control. Summary of Notifiable Dis-eases, United States 1997: MMWR 1998, 46(541-87 [http:// www.cdc.gov/mmwr/PDF/wk/mm4654.pdf].
32. Centers for Disease Control. Summary of Notifiable Dis-eases, United States 1998: MMWR 1999, 47(531-93 [http:// www.cdc.gov/mmwr/PDF/wk/mm4753.pdf].
33. Centers for Disease Control. Summary of Notifiable Dis-eases, United States 1999: MMWR 2001, 48(531-104 [http:// www.cdc.gov/mmwr/PDF/wk/mm4853.pdf].
34. Division of Communicable Control-Surveillance and Statis-tics Section [http://www.dhs.ca.gov/ps/dcdc/pdf/cdtables/ dec0199.pdf]. CA Department of Health Services, Sacramento 35. Florida Communicable Disease Frequency Reports [http://
www.floridacharts.com/merlin/freqrpt.asp]. Florida Department of Health, Tallahasse
Publish with BioMed Central and every scientist can read your work free of charge "BioMed Central will be the most significant development for disseminating the results of biomedical researc h in our lifetime."
Sir Paul Nurse, Cancer Research UK
Your research papers will be:
available free of charge to the entire biomedical community
peer reviewed and published immediately upon acceptance
cited in PubMed and archived on PubMed Central
yours — you keep the copyright
Submit your manuscript here:
http://www.biomedcentral.com/info/publishing_adv.asp
BioMedcentral
www.mass.gov/dph/cdc/epii/cd_numbers.htm]. Massachusetts Department of Public Health, Boston
37. Pertussis Incidence Rates. Communicable Disease Epidemi-ology Washington State Department of Health Olympia
[http://www.doh.wa.gov/notify/nc/pertussis.htm].
38. Pichichero ME, Treanor J: Economic impact of pertussis. Arch Pediatr Adolesc Med 1997, 151:35-40.
39. Lee LH, Pichichero ME: Costs of illness due to Bordetella pertussis. Arch Fam Med 2000, 9:989-996.
40. Centers for Disease Control Pertussis [http://www.cdc.gov/nip/ publications/pink/pert.pdf].
41. O'Brien JA, Patrick AR, Caro JJ: Costs of Managing CAP are Dou-ble for Elderly Patients. Drug Benefit Trends 2003, 15(6):32-47.
Pre-publication history
The pre-publication history for this paper can be accessed here: