R E S E A R C H A R T I C L E
Open Access
Analysis of a sample of type 2 diabetic patients
with obesity or overweight and at cardiovascular
risk: a cross sectional study in Spain
María Orosia Lucha-López
1*, Ana Carmen Lucha-López
1, Concepción Vidal-Peracho
2, José Miguel Tricás-Moreno
1,
Elena Estébanez-De Miguel
1, Carlos Salavera-Bordás
1and Cesar Hidalgo-García
1Abstract
Background:The multifactorial control of diabetes relies on interventions that provide patients with the best knowledge and resources available. The objective of this research was to analyze the clinical characteristics of a sample of people with type 2 diabetes at high cardiovascular risk, and establish possible links between disease control, family history and lifestyle, to improve the quality of interventions. Family history, lifestyle habits, blood pressure, anthropometric data and laboratory tests were analyzed in this descriptive and comparative cross-sectional study.
Results:All patients had a pathological body mass index (BMI), and in those patients with a family history of diabetes, the disease was more serious and onset was earlier. Overall, 70.9% were taking drugs for arterial blood pressure management, with mean values within recommended limits; 87.1% were taking antihyperlipidemic drugs and had mean values for blood lipids within reference range; 93.5% were receiving oral antidiabetic drugs and/or insulin and had blood glucose and glycosylated hemoglobin (HbA1c) values higher than recommended limit; and 87% were taking antiplatelet drugs and had fibrinogen and ultrasensitive C-reactive protein higher than the normal range. High HbA1cvalues were found in a high proportion of our sample who were not following a tailored diet (84.2%), and better BMIs were associated with moderate physical activity. Coexistence of somatic disorders (97.4% of the sample with musculoskeletal diseases) could lead to the lack of physical activity.
Conclusions:This sample of patients with type 2 diabetes and at high cardiovascular risk, had acceptable metabolic control, facilitated by drug therapy. Family history of diabetes was associated with earlier disease onset and worse disease progression. Patients who were not following a tailored diet had worse HbA1cvalues compared with those who were. Individuals who practiced moderate physical activity in line with international
recommendations for weight maintenance had the best BMI values, but the high prevalence of comorbidities could adversely affect exercise habits. Appropriate use of medication, dietary advice, and tailored physiotherapy physical activity suitable for people with comorbidities should be included in multifactorial treatment strategies for these patients, particularly in the presence of a family history of diabetes.
Keywords:Diabetes Mellitus, Obesity, Cardiovascular risk, Genetics, Life habits, Health education, Physiotherapy
* Correspondence:orolucha@unizar.es 1
Physiotherapy Research Unit, Faculty of Health Sciences - University of Zaragoza, C/Domingo Miral s/n, 50009, Zaragoza, Spain
Full list of author information is available at the end of the article
Background
Diabetes mellitus is currently a major public health problem [1]. In 2011, 366 million people worldwide were estimated to have diabetes. In Europe in 2011, 52.8 mil-lion people between 20 and 79 years of age had diabetes, with a prevalence of 8.1% [2]. In Spain between 2004 and 2010, 13.8% of people aged 18 and over had dia-betes, similar to 2004–2006 rates, with a high rate (43%) of undiagnosed diabetes [3]. In Europe, one in 10 deaths in those aged between 20 and 79 years can be attributed to diabetes, with the vast majority of cases occurring in people over 50 years of age [1]. The causes of this high prevalence are attributable to both lifestyle and genetic factors. In terms of genetic factors, at least 40 loci asso-ciated with diabetes have been identified [4] and it has been reported that approximately 40% of people with type 2 diabetes have at least one relative that also has the disorder [5].
Diet and exercise are the lifestyle habits with the great-est influence on diabetes. In low- and middle-income countries–areas with a higher prevalence of the disease– the nutritional quality of food may be low, food with a very high glycemic index is consumed [6], and very little physical activity is done, because of technological ad-vances and the lack of time. Therefore, control of this disease is a global health challenge and great efforts have been made in all health sciences fields to intervene in the process and to try to reverse it.
Recent studies published in Spain about the treatment of diabetes and the principal associated cardiovascular
risk factors show encouraging results. In 2007, Orozco and colleagues found below-baseline values for glycosyl-ated hemoglobin (HbA1c) in 50.6% of the population, blood pressure (BP) in 7.8% and low-density lipoprotein (LDL)-cholesterol in 5.9% [7]. Data published by Franch and collaborators in 2010 show a higher prevalence of below-baseline levels of these variables (59%, 28.51%, and 40.7% for HbA1c, BP and LDL-cholesterol, respect-ively) [8]. Mengual and colleagues reported similar find-ings in research published in 2010 (54.8%, 29.6%, and 40.6% for HbA1c, BP and LDL-cholesterol, respectively) [9]. Taken together, these show positive results in the treatment of diabetes mellitus, although it is necessary to study larger populations of people with diabetes, in line with levels recommended by reference scientific societies.
Multifactorial control of cardiovascular risk factors is important in achieving positive results. In the Steno study [10], intensive treatment for all cardiovascular risk factors, consisting of intensive drug therapy (antioxidant vitamins and insulin, lipid-lowering, antihypertensive and antiplatelet treatments), a low fat diet (<30% fat), and exercise, over a period of 13 years was shown to reduce complications by 29% and mortality by 20%.
The complexity of this intensive and multifactorial control of diabetes [11] and the improved health and in-creased survival that can be achieved, highlight the im-portance of interventions that provide the patient with the best knowledge and resources available [12].
The objective of this research was to analyze the clin-ical characteristics of a sample of people with type 2 diabetes at high cardiovascular risk, and establish pos-sible links between disease control, family history, and lifestyle, to improve the quality of interventions.
Methods
Study and sample selection
[image:2.595.58.291.99.222.2]A descriptive and comparative cross-sectional study was developed, comprising a sample of 38 people with type 2 diabetes and a pathological body mass index (BMI) who attended a specialized Endocrinology and Nutrition Table 1 General sample characteristics
General characteristics of the sample
[image:2.595.58.539.623.729.2]Percentage or mean ± SD [95% CI]
Females 74% (n = 28)
Males 26% (n = 10)
Age (years) 59.1 ± 7.6 [56.6-61.6]
Age at the onset of diabetes (years) 48.7 ± 10.2 [45.4-52.1]
Family history of diabetes 70% (n = 26)
Adapted diet in the last 12 months 15.8% (n = 6)
Smoking habit 0% (n = 0)
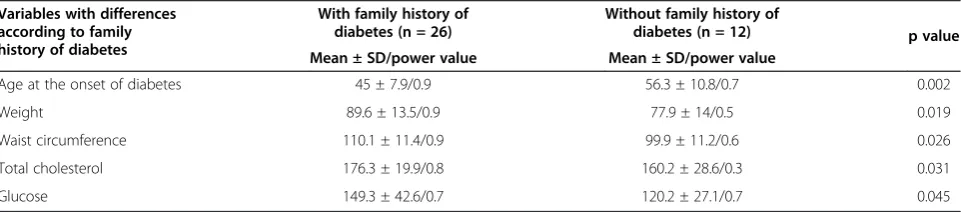
Table 2 Comparison according to family history of diabetes
Variables with differences according to family history of diabetes
With family history of diabetes (n = 26)
Without family history of
diabetes (n = 12) p value
Mean ± SD/power value Mean ± SD/power value
Age at the onset of diabetes 45 ± 7.9/0.9 56.3 ± 10.8/0.7 0.002
Weight 89.6 ± 13.5/0.9 77.9 ± 14/0.5 0.019
Waist circumference 110.1 ± 11.4/0.9 99.9 ± 11.2/0.6 0.026
Total cholesterol 176.3 ± 19.9/0.8 160.2 ± 28.6/0.3 0.031
outpatient clinic at the Hospital Royo Villanova (Grande Covian Specialty Medical Center) in Zaragoza, Spain.
Inclusion criteria were as follows: diagnosis of type 2 diabetes, according to the American Diabetes Associ-ation (ADA) 2012 criteria [13]; diabetes durAssoci-ation >10 years; BMI≥25; and age >45 years.
The Spanish Society for the Study of Diabetes and Obesity (SEEDO) defines pathological BMI as follows: overweight grade I, 25.0–26.9 kg/m2; overweight grade II (pre-obesity), 27.0–29.9 kg/m2; obesity type I, 30.0–34.9 kg/m2; obesity type II, 35.0 to 39.9 kg/m2; obesity type III (morbid), 40.0–49.9 kg/m2; and obesity type IV (ex-treme)≥50 kg/m2[14].
All patients who met the inclusion criteria and attended consultations were included. They voluntarily accepted to participate after receiving information on the study, so we used a convenience, consecutive, non-probabilistic sampling method. All participants signed an informed consent form and were told that they could leave the study at any time and for any reason. The Department of Physical Therapy and Nursing at the University of Zaragoza approved the study, which complied with the ethical requirements of the Declaration of Helsinki [15].
Measurements
Medical histories for each patient were taken including sex, age, age at diabetes onset, family history [16], co-morbidities, diet in the past year, physical activity, smok-ing status, and medication use.
The measurement of systolic blood pressure (SBP) and diastolic blood pressure (DBP) was performed using a sleeve adapted to obese patients [17] after a
period of approximately 15 minutes in a sitting pos-ition, with one tube and a clock tensiometer (Riester, Jungingen, Germany).
Anthropometric data were obtained according to the protocol of the International Society for the Advancement of Kinanthropometry (ISAK) [18]. Height was measured with a wall stadiometer (removable stadiometer, scope 30– 220 cm, Seca, Hamburg, Germany,), weight with an electronic scale (Tanita TBF 300, Tanita, Amsterdam, the Netherlands) and waist circumference with an inextensible tape (plastic tape, 0–2 m, Tecsymp Instruments, Barcelona, Spain).
[image:3.595.57.540.102.305.2]The assessment of blood parameters was performed in the laboratory of Grande Covian Specialty Medical Cen-ter, by drawing blood after a fasting period of not less than 12 hours. Biochemical analyses took place at the Grande Covián laboratory. Total cholesterol, (HDL)-cholesterol, (LDL)-(HDL)-cholesterol, triglycerides and fibrino-gen were determined by nephelometry (Dade Behring Corporation, Berlin, Germany). Fating blood glucose, HbA1c, and ultrasensitive C reactive protein (us-CRP) were determined using a selective modular analyzer (Roche, Basel, Switzerland). Accreditation National Entity (ENAC) validated the quality control of the laboratory (accreditation number: 742/LE1586).
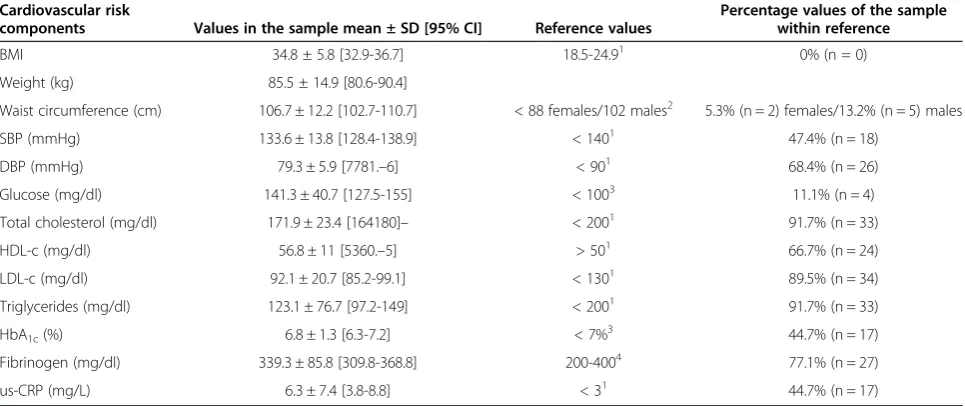
Table 3 Cardiovascular risk parameters
Cardiovascular risk
components Values in the sample mean ± SD [95% CI] Reference values
Percentage values of the sample within reference
BMI 34.8 ± 5.8 [32.9-36.7] 18.5-24.91 0% (n = 0)
Weight (kg) 85.5 ± 14.9 [80.6-90.4]
Waist circumference (cm) 106.7 ± 12.2 [102.7-110.7] < 88 females/102 males2 5.3% (n = 2) females/13.2% (n = 5) males
SBP (mmHg) 133.6 ± 13.8 [128.4-138.9] < 1401 47.4% (n = 18)
DBP (mmHg) 79.3 ± 5.9 [7781.–6] < 901 68.4% (n = 26)
Glucose (mg/dl) 141.3 ± 40.7 [127.5-155] < 1003 11.1% (n = 4)
Total cholesterol (mg/dl) 171.9 ± 23.4 [164180]– < 2001 91.7% (n = 33)
HDL-c (mg/dl) 56.8 ± 11 [5360.–5] > 501 66.7% (n = 24)
LDL-c (mg/dl) 92.1 ± 20.7 [85.2-99.1] < 1301 89.5% (n = 34)
Triglycerides (mg/dl) 123.1 ± 76.7 [97.2-149] < 2001 91.7% (n = 33)
HbA1c(%) 6.8 ± 1.3 [6.3-7.2] < 7%3 44.7% (n = 17)
Fibrinogen (mg/dl) 339.3 ± 85.8 [309.8-368.8] 200-4004 77.1% (n = 27)
us-CRP (mg/L) 6.3 ± 7.4 [3.8-8.8] < 31 44.7% (n = 17)
1
SEEDO 2007,2
ATP III 2002,3
ADA 2012,4
Gailani D, Neff AT 2008.
ADA = American Diabetes Association; ATPIII: adult treatment panel III; BMI = body mass index; HbA1c= glycosylated hemoglobin; HDL-c = high-density lipoprotein cholesterol; LDL-c = low-density lipoprotein cholesterol; SEEDO = Spanish Society for the Study of Diabetes and Obesity; us-CRP = ultrasensitive C reactive protein.
Table 4 Medications used
Type of drug Percentage of the sample
Drugs to control blood pressure 70.9% (n = 27)
Hypolipidemic drugs 87.1% (n = 33)
Oral antidiabetic and/or insulin 93.5% (n = 36)
[image:3.595.304.539.662.734.2]Statistical analysis
Data were analyzed with SPSS version 16.0 (SPSS Inc., Chicago, USA). Descriptive statistics were calculated (the mean and standard deviation (SD) and 95% confi-dence interval (CI) for quantitative variables and per-centages for qualitative variables).
We evaluated the magnitude of the association be-tween quantitative variables with Spearman’s correlation coefficient (rho).
The Mann–Whitney U test was used for the com-parison of independent variables, which included family history of diabetes (yes/no), dietary habits (no diet/diet adapted to the clinical situation), and physical activity (no physical activity/moderate physical activ-ity). The power of these tests was calculated with the effect size detected in the study. A level of significance of 5% (p <0.05) was established to reject the null hypothesis.
Results
General characteristics of the sample are shown in Table 1.
When stratified according to family history of diabetes, there were significant differences in age of diabetes onset, weight, waist circumference, total cholesterol, and fasting blood glucose (Mann–Whitney U test). See Table 2.
Descriptive data on cardiovascular risk components are shown in Table 3 and drug prescriptions in Table 4.
Of the study sample, 93.5% were taking drugs to control blood glucose (41.9% were treated with oral agents, 6.4% with insulin and 45.2% with oral agents associated with insulin).
[image:4.595.56.293.111.162.2]Only 15.8% of people were on a diet tailored to their clinical condition (Table 1). When comparing this group with the group that did not diet, differences in HbA1c values were observed (Mann–Whitney U test). See Table 5.
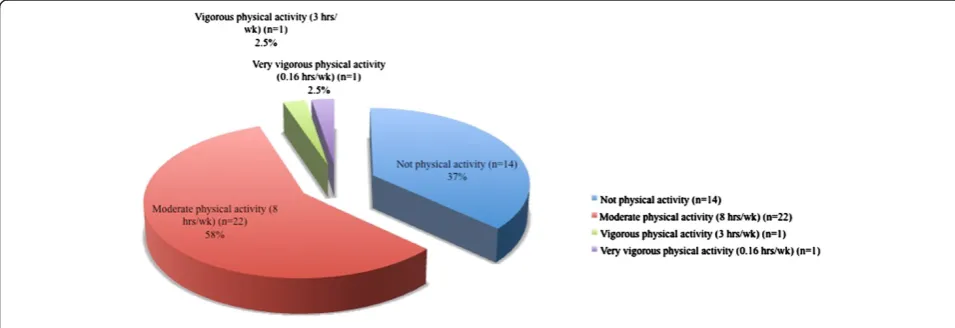
The type of physical activity undertaken is shown in Figure 1. There was a statistically significant difference in BMI between individuals who undertook moderate physical activity compared with those who did not (p = 0.032) (Table 6).
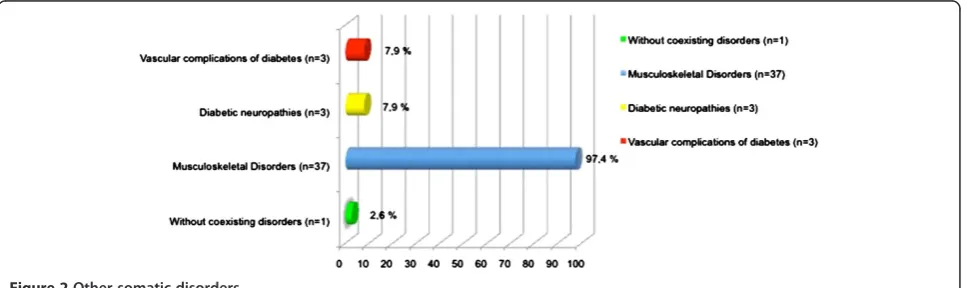
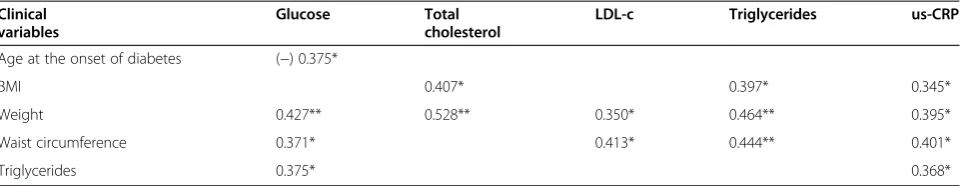
The percentages of patients with coexisting somatic disorders and sources of disability are shown in Figure 2. Table 7 shows the correlation between various clinical variables.
Discussion
This study included 38 people aged over 45 years with type 2 diabetes of >10 years duration. Almost three-quarters of the sample were female, and 70% had a fam-ily history of diabetes. This proportion was slightly higher than that outlined by previous studies provide data on approximately 40% [5]. The age of onset of dia-betes in our study was greater by approximately 11 years in patients with a family history of diabetes compared with the patients without a family history of diabetes. A family history of diabetes negatively influenced weight, waist circumference, blood glucose levels and cholesterol levels. These results suggest the importance of the gen-etic component in the pathogenesis of this process [19,20] although it is known that environmental factors also play an important role [21].
[image:4.595.57.535.556.720.2]The mean BMI in our study was 34.81 kg/m2, and fat distribution was central, with a high percentage of the sample having a waist circumference higher than reference
Figure 1Dedication to physical activity.
Table 5 Comparison according to having followed or not followed a tailored diet during the last year
Variables with differences according to diet
Diet (n = 6) No diet (n = 32)
p value Mean ± SD/
power value
Mean ± SD/ power value
HbA1c 5.85 ± 0.87/0.5 6.96 ± 1.31/0.9 0.037
values [22]. This type of adiposity is more frequently asso-ciated with increased cardiovascular risk, dyslipidemia and insulin resistance [23]. In this study, people with larger waist circumference had higher blood glucose, triglycer-ides, LDL cholesterol and us-CRP, supporting the import-ance of the loss of fat mass to facilitate the treatment of type 2 diabetes [24].
Regarding concomitant drug use, 70.9% of our patients were receiving drugs to control blood pressure, and 47.4% and 68.4% of study participants had SB, and DBP, respectively, within the normal range. [14]. The positive effects of blood pressure control in the course of the dis-ease may have prevented the development of diabetic nephropathy, as none of the patients showed this com-plication, despite having been diagnosed with diabetes for a long period of time [25].
A total of 87.1% of the sample was receiving lipid-lowering therapy, and 91.7%, 66.7%, 89.5% and 91.7% of patients had total cholesterol, HDL-cholesterol, LDL-cholesterol and triglycerides below the recommended levels [26].
By contrast, despite therapy with oral antidiabetic drugs and/or insulin, in 93.5% of patients, the mean blood glucose level was above target values. However, 44.7% had HbA1c below the target value of 7% (53 mmol/mol) [13,27]. Eighty-seven per cent of the sample were receiving antiplatelet drug treatment, achieving a mean fibrinogen value of 339.3 mg/dL, with 77.1% of the sample having values below baseline [28].
Analysis of fibrinogen as a sensitive indicator of in-flammation [29] can be complemented with the analysis of the us-CRP, for which values in our study were higher
than reference values [25], and only 44.7% of subjects were within the recommended levels. This observed pro-inflammatory state might be related to insulin resist-ance, because it has been demonstrated that the plasma us-CRP might be a marker of risk for the development of macrovascular disease and diabetes mellitus, even in-dependently of obesity [30].
These data reflect that patients had acceptable meta-bolic control according to ADA [31] and International Diabetes Federation (IDF) [32] criteria, although the pro-inflammatory markers indicate that this sample was at high cardiovascular risk. The current clinical evidence and consensus recommendations support that type 2 diabetes is associated with high cardiovascular risk, par-ticularly when other risk factors are present, and at 10 years after diagnosis [22,30].
High HbA1c values were found in a high proportion of our sample who were not following a tailored diet (84.2%) [33], in agreement with recent studies that con-tinue to show the benefits of the adjustments in diet to control glucose metabolism [34-36].
[image:5.595.53.552.100.146.2]Another key aspect of the treatment of diabetes is physical activity [37]. A recent study has shown that higher levels of physical activity are associated with de-creased risk of developing diabetes, even independently of the general and abdominal fat percentage [38]. In our study, 57% of patients reported undertaking moderate physical activity, at an average duration of 8 hours per week, which is sufficient for the maintenance of weight loss in obese people according to international recom-mendations [39]. However, up to 37% reported under-taking no physical activity, and when comparing the two
[image:5.595.58.542.580.724.2]Figure 2Other somatic disorders.
Table 6 Comparison according to the undertaking of physical activity
Variables with differences according to dedication to physical activity
Not physical activity (n = 14) Moderate physical activity (8 h/sem) (n = 22)
P value Mean ± SD/power value Mean ± SD/power value
BMI 37.7 ± 5.8/0.4 33.7 ± 5.2/0.7 0.032
groups, the most favorable BMI values were observed in the physically active group, as has been reported by others [40].
One barrier to patients with diabetes undertaking physical activity is the high prevalence of coexisting conditions that may limit their functional ability and cause alterations in sensitivity [41]. In the United States, 30% of people with type 2 diabetes have impaired sensa-tion in the feet, and over 50% have osteoarthritis [42]. In our sample, up to 97.4% had musculoskeletal disor-ders, including osteoarthritis, 7.9% had diabetic neur-opathy and 7.9% had vascular complications, which may have decreased adherence to physical activity because of pain and decreased function. To facilitate exercise in patients with such problems, exercise must be adapted to the clinical situation and, ideally, treated specifically. Reinforcing this, a recent study has demonstrated the effectiveness of a physiotherapy exercise program for patients with diabetes, with good results in controlling pain and improving mobility [43].
A limitation to our study is that patients joined the study voluntarily, leading to the possibility of non-response bias on the part of the population that would not, or could not, be included. The strict in-clusion criteria of the study prevented the recruit-ment of a larger sample size, which would have improved the possibilities to estimate the true popula-tion values, and larger studies in similar populapopula-tions are needed to confirm our findings.
Conclusions
This sample of patients, at high cardiovascular risk and with a strong influence of a family history of diabetes, had acceptable metabolic control, facilitated by inten-sive drug therapy. Family history of diabetes was associ-ated with earlier onset and worse disease progression. Patients who were not following a tailored diet had worse HbA1c values compared with those who were. The proportion of the sample that practiced moderate physical activity in line with international recommenda-tions for weight maintenance had the best BMI values, but the high prevalence of comorbidities could adversely
affect exercise habits. Appropriate use of medication, diet-ary advice, and tailored physiotherapy physical activity suitable for people with comorbidities should be included in multifactorial treatment strategies for these patients, particularly in the presence of a family history of diabetes.
Availability of supporting data
The data sets supporting the results of this article are in-cluded within the article.
Abbreviations
ADA:American Diabetes Association; ATPIII: Adult Treatment Panel III; BMI: Body mass index; BP: Blood pressure; CI: Confidence interval; Cm: Centimeter; DBP: Diastolic blood pressure; dL: Deciliter; DNA: Deoxyribonucleic acid; ENAC: Accreditation National Entity; HbA1c: Glycosylated hemoglobin; HDL: High-density lipoprotein; hrs/ wk: Hours/week; IDF: International Diabetes Federation; ISAK: International Society for the Advancement of Kinanthropometry; Kg: Kilogram; L: Liter; LDL: Low-density lipoprotein; Mg: Milligram; mmHg: Millimeter of mercury; SBP: Systolic blood pressure; SD: Standard deviation; SEEDO: Spanish Society for the Study of Diabetes and Obesity; us-CRP: ultrasensitive C reactive protein.
Competing interests
The authors declare that they have no competing interests.
Authors’contributions
JMTM and CVP contributed to the conception and design of the work. MOLL, ACLL, EED and CSB organized the sample collection and data preparation, performed data collection, analysis and interpretation. CHG prepared drafts of the article. MOLL, ACLL, CVP, JMTM, EED, CSB and CHG critically reviewed its comprehensive content and finally approved the version to be submitted for publication.
Acknowledgements
The study was supported by the infrastructure of the Physiotherapy Research Unit, Faculty of Health Sciences, University of Zaragoza, Spain. We express our gratitude to the staff of the Grande Covian Specialty Medical Center. We wish to acknowledge the extensive and continuous help of all patients and their families, without whom the present registry would have not been possible.
Author details
1Physiotherapy Research Unit, Faculty of Health Sciences - University of
Zaragoza, C/Domingo Miral s/n, 50009, Zaragoza, Spain.2Physiotherapy Research Unit, Specialty Medical Center Grande Covian, SALUD, Avda Alcalde Caballero, 196, 50014, Zaragoza, Spain.
[image:6.595.58.541.100.193.2]Received: 18 October 2013 Accepted: 15 January 2014 Published: 21 January 2014
Table 7 Correlation between clinical variables
Clinical variables
Glucose Total cholesterol
LDL-c Triglycerides us-CRP
Age at the onset of diabetes (−) 0.375*
BMI 0.407* 0.397* 0.345*
Weight 0.427** 0.528** 0.350* 0.464** 0.395*
Waist circumference 0.371* 0.413* 0.444** 0.401*
Triglycerides 0.375* 0.368*
References
1. IDF Diabetes Atlas Group:Update of mortality attributable to diabetes for the IDF diabetes atlas: estimates for the year 2011.Diabetes Res Clin Pract
2013,100(2):277–279.
2. Whiting DR, Guariguata L, Weil C, Shaw J:IDF diabetes atlas: global estimates of the prevalence of diabetes for 2011 and 2030.Diabetes Res Clin Pract2011,94(3):311–321.
3. Soriguer F, Goday A, Bosch-Comas A, Bordiu E, Calle-Pascual A, Carmena R, Casamitjana R, Castano L, Castell C, Catala M, Delgado E, Franch J, Gaztam-bide S, Girbes J, Gomis R, Gutierrez G, Lopez-Alba A, Martinez-Larrad MT, Menendez E, Mora-Peces I, Ortega E, Pascual-Manich G, Rojo-Martinez G, Serrano-Rios M, Valdes S, Vazquez JA, Vendrell J:Prevalence of diabetes mellitus and impaired glucose regulation in Spain: the Di@bet.es Study.
Diabetologia2012,55(1):88–93.
4. Ashcroft FM, Rorsman P:Diabetes mellitus and the beta cell: the last ten years.Cell2012,148(6):1160–1171.
5. Doria A, Patti ME, Kahn CR:The emerging genetic architecture of type 2 diabetes.Cell Metab2008,8(3):186–200.
6. Hu FB:Globalization of diabetes: the role of diet, lifestyle, and genes.
Diabetes Care2011,34(6):1249–1257.
7. Orozco-Beltran D, Gil-Guillen VF, Quirce F, Navarro-Perez J, Pineda M, Gomez-de-la-Camara A, Pita S, Diez-Espino J, Mateos J, Merino J, Serrano-Rios M, Collaborative Diabetes Study Investigators:Control of diabetes and cardiovascular risk factors in patients with type 2 diabetes in primary care: the gap between guidelines and reality in Spain.Int J Clin Pract
2007,61(6):909–915.
8. Franch J, Artolola S, Diez J, Mata M, in representation of RedGEDAPS:The evolution of quality care indicators of patients with type2 diabetes in the Spanish primary care (1996–2007):the RedGEDAPS quality of care program.Med Clín (Barc)2010,135(13):600–607.
9. Mengual L, Roura P, Serra M, Montasell M, Prieto G, Bonet S:Multifactorial control and treatment intensity of type-2 diabetes in primary care set-tings in Catalonia.Cardiovasc Diabetol2010,9:1475-2840-9-14. 10. Gaede P, Vedel P, Larsen N, Jensen GV, Parving HH, Pedersen O:
Multifactorial intervention and cardiovascular disease in patients with type 2 diabetes.N Engl J Med2003,348(5):383–393.
11. Ford E, Herman W:Leisure-time physical activity patterns in the US diabetic population: findings from the 1990 national health interview survey-health promotion and disease prevention.Diabetes Care1995, 18:27–33.
12. Pasquel FJ, Umpierrez GE:Management of hyperglycemia in hospitalized patients.Medicina (Buenos Aires)2010,70:275–283.
13. American Diabetes Association:Standards of medical care in diabetes–2012.
Diabetes Care2012,35(1):S11–63.
14. Salas-Salvado J, Rubio MA, Barbany M, Moreno B, Grupo Colaborativo de la SEEDO:SEEDO 2007 consensus for the evaluation of overweight and obesity and the establishment of therapeutic intervention criteria.
Med Clin (Barc)2007,128(5):18496. quiz 1 p following 200.
15. World Medical Association Inc:Declaration of Helsinki: ethical principles for medical research involving human subjects.J Indian Med Assoc2009, 107(6):403–405.
16. Guasch-Ferre M, Bullo M, Costa B, Martinez-Gonzalez MA, Ibarrola-Jurado N, Estruch R, Barrio F, Salas-Salvado J, PREDI-PLAN Investigators:A risk score to predict type 2 diabetes mellitus in an elderly Spanish Mediterranean population at high cardiovascular risk.PLoS One2012,7(3):e33437. 17. Department of US, Health and Human Services. National Institutes of Health.
National Heart, Lung, and Blood Institute. National High Blood Pressure Education Program:The seventh report of the joint national committee on prevention, detection, evaluation, and treatment of high blood pressure (JNC 7).NIH Publication2004,04:5230.
18. Norton K, Whittingham N, Carter L, Kerr D, Gore C, Marfell-Jones M: Measurement techniques in anthropometry. InAnthropometrica.Edited by Norton KOT. Syndey: University of New South Wales Press; 1996:25–75. 19. Ntzani EE, Kavvoura FK:Genetic risk factors for type 2 diabetes: insights
from the emerging genomic evidence.Curr Vasc Pharmacol2012, 10(2):147–155.
20. Vázquez JA, Gaztambide S, Soto-Pedre E:Type 2 diabetes mellitus: incidence and risk factors: a ten years prospective study.Med Clin (Barc)
2000,115:534–539.
21. Picón MJ, Tinahones FJ:Genetic vs ambient factors in the development of type 2 diabetes.Av Diabetol2010,26:268–269.
22. National Cholesterol Education Program (NCEP) Expert Panel on Detection, Evaluation, and Treatment of High Blood Cholesterol in Adults (Adult Treatment Panel III):Third report of the National Cholesterol Education Program (NCEP) expert panel on detection, evaluation, and treatment of high blood cholesterol in adults (Adult Treatment Panel III) final report.
Circulation2002,106(25):3143–3421.
23. Huerta JM, Tormo MJ, Chirlaque MD, Gavrila D, Amiano P, Arriola L, Ardanaz E, Rodriguez L, Sanchez MJ, Mendez M, Salmeron D, Barricarte A, Burgui R, Dorronsoro M, Larranaga N, Molina-Montes E, Moreno-Iribas C, Quiros JR, Toledo E, Travier N, Gonzalez CA, Navarro C:Risk of type 2 diabetes according to traditional and emerging anthropometric indices in Spain, a Mediterranean country with high prevalence of obesity: results from a large-scale prospective cohort study.BMC Endocr Disord2013,13:7-6823-13-7. 24. Salvador J, Escalada J:Importance of body weight control on metabolic
deterioration of type 2 diabetes.Av Diabetol2010,26:151–155. 25. Aguillo E, Calvo F, Carmena R, Cepero D, Ibarra JM, Navarro J, Pedro-Botet J,
Ascaso JF, Arrieta F, Carramiñana Barrera FC, Conthe P, Escobar-Jiménez F, Gabriel R, Alemán JJ, Becerra AL:Recommendations of the working group of diabetes mellitus and cardiovascular disease of the Spanish diabetes society, 2009.Av Diabetol2009,25:449–454.
26. Aranceta J, Foz M, Gil B, Jover E, Mantilla T, Millán J, Monereo S, Moreno B: Consensus: obesity and cardiovascular risk.Clínica e investigación en Arteriosclerosis2003,15(5):196–233.
27. González-Sánchez S, DePrado-Lacueva C, Salido-Valencia V, Castelló-Alonso M, Gibrat-Pineda M, Mata-Cases M:Applying HbA1c as the only criterion for type 2 diabetes would delay its diagnosis.Av Diabetol2010, 26:419–423.
28. Gailani D, Neff AT:Rare coagulation factor deficiencies. InHoffman hematology: basic principles and practice.5th edition. Edited by Hoffman R, Benz EJ Jr, Shattil SJ,et al. Philadelphia: Churchill Livingstone Elsevier; 2008:127.
29. Yokoyama H, Tahara H, Emoto M, Fujiwara S, Araki T, Shinohara K, Hatsuda S, Maeno T, Shoji T, Koyama H, Shoji T, Nishizawa Y:The K469E polymorphism of the intercellular adhesion molecule-1 gene is associated with plasma fibrinogen level in type 2 diabetes.Metabolism
2005,54(3):381–386.
30. Dehghan A, Kardys I, de Maat MP, Uitterlinden AG, Sijbrands EJ, Bootsma AH, Stijnen T, Hofman A, Schram MT, Witteman JC:Genetic variation, C-reactive protein levels, and incidence of diabetes.Diabetes2007, 56(3):872–878.
31. American Diabetes Association:Standards of medical care in diabetes–2009.
Diabetes Care2009,32(1):S13–61.
32. Alberti KG, Zimmet P, Shaw J, IDF Epidemiology Task Force Consensus Group:The metabolic syndrome–a new worldwide definition.Lancet
2005,366(9491):1059–1062.
33. Tan SL, Juliana S, Sakinah H:Dietary compliance and its association with glycemic control among poorly controlled type 2 diabetic outpatients in hospital universiti Sains Malaysia.Malays J Nutr2011,17(3):287–299. 34. Malandrucco I, Pasqualetti P, Giordani I, Manfellotto D, De Marco F, Alegiani
F, Sidoti AM, Picconi F, Di Flaviani A, Frajese G, Bonadonna RC, Frontoni S: Very-low-calorie diet: a quick therapeutic tool to improveβcell function in morbidly obese patients with type 2 diabetes.Am J Clin Nutr2012, 95(3):609–613.
35. Barakatun Nisak MY, Ruzita AT, Norimah AK, Kamaruddin NA:Medical nutrition therapy administered by a dietitian yields favourable diabetes outcomes in individual with type 2 diabetes mellitus.Med J Malaysia
2013,68(1):18–23.
36. Wirstrom T, Hilding A, Gu HF, Ostenson CG, Bjorklund A:Consumption of whole grain reduces risk of deteriorating glucose tolerance, including progression to prediabetes.Am J Clin Nutr2013,97(1):179–187. 37. O’Hagan C, De Vito G, Boreham CA:Exercise prescription in the treatment
of type 2 diabetes mellitus: current practices, existing guidelines and future directions.Sports Med2013,43(1):39–49.
38. InterAct Consortium:Physical activity reduces the risk of incident type 2 diabetes in general and in abdominally lean and obese men and women: the EPIC-InterAct study.Diabetologia2012,55(7):1944–1952. 39. Saris WH, Blair SN, van Baak MA, Eaton SB, Davies PS, Di Pietro L, Fogelholm
40. Reséndiz E, Aguilera P, Rocher ME:Lifestyle and body mass index of an adult population in southern Tamaulipas, Mexico.AQUICHAN2010, 10(3):244–252.
41. Pariser G, Ann Demeuro M, Gillette P, Stephen W:Outcomes of an education and exercise program for adults with type 2 diabetes, and comorbidities that limit their mobility: a preliminary project report.
Cardiopulm Phys Ther J2010,21(2):512.
42. US Department of Health and Human Services, CDC:National diabetes fact sheet: general information and national estimates on diabetes in the United States, 2005.Atlanta, GA. http://www.cdc.gov.
43. Adeniyi AF, Fasanmade AA, Sanya AO, Borodo M:Neuromusculoskeletal disorders in patients with type 2 diabetes mellitus: outcome of a twelve-week therapeutic exercise programme.Niger J Clin Pract2010,13(4):403–408.
doi:10.1186/1756-0500-7-48
Cite this article as:Lucha-Lópezet al.:Analysis of a sample of type 2 diabetic patients with obesity or overweight and at cardiovascular risk: a cross sectional study in Spain.BMC Research Notes20147:48.
Submit your next manuscript to BioMed Central and take full advantage of:
• Convenient online submission
• Thorough peer review
• No space constraints or color figure charges
• Immediate publication on acceptance
• Inclusion in PubMed, CAS, Scopus and Google Scholar
• Research which is freely available for redistribution