Open Access
Vol 8 No 5
Research article
Establishment of the epithelial-specific transcriptome of normal
and malignant human breast cells based on MPSS and array
expression data
Anita Grigoriadis
1, Alan Mackay
2, Jorge S Reis-Filho
2, Dawn Steele
2, Christian Iseli
3,
Brian J Stevenson
3, C Victor Jongeneel
3, Haukur Valgeirsson
2, Kerry Fenwick
2, Marjan Iravani
2,
Maria Leao
1, Andrew JG Simpson
4, Robert L Strausberg
5, Parmjit S Jat
6, Alan Ashworth
2, A
Munro Neville
1and Michael J O'Hare
11Ludwig Institute for Cancer Research/University College London Breast Cancer Laboratory, 91 Riding House Street, London, W1W 7BS, UK 2The Breakthrough Breast Cancer Research Centre, Institute of Cancer Research, 237 Fulham Road, London, SW3 6JB, UK
3Office of Information Technology, Ludwig Institute for Cancer Research and Swiss Institute of Bioinformatics, 1015 Lausanne, Switzerland 4Ludwig Institute for Cancer Research, New York Branch at Memorial Sloan-Kettering Cancer Centre, New York, NY 10021, USA 5The J. Craig Venter Institute, 9704 Medical Center Drive, Rockville, MD 20850, USA
6Department of Neurodegenerative Disease, Institute of Neurology, London, WC1N 3BG, UK
Corresponding author: A Munro Neville, [email protected]
Received: 17 Jul 2006 Revisions requested: 7 Aug 2006 Revisions received: 7 Sep 2006 Accepted: 2 Oct 2006 Published: 2 Oct 2006
Breast Cancer Research 2006, 8:R56 (doi:10.1186/bcr1604)
This article is online at: http://breast-cancer-research.com/content/8/5/R56 © 2006 Grigoriadis et al.; licensee BioMed Central Ltd.
This is an open access article distributed under the terms of the Creative Commons Attribution License (http://creativecommons.org/licenses/by/2.0), which permits unrestricted use, distribution, and reproduction in any medium, provided the original work is properly cited.
Abstract
Introduction Diverse microarray and sequencing technologies have been widely used to characterise the molecular changes in malignant epithelial cells in breast cancers. Such gene expression studies to identify markers and targets in tumour cells are, however, compromised by the cellular heterogeneity of solid breast tumours and by the lack of appropriate counterparts representing normal breast epithelial cells.
Methods Malignant neoplastic epithelial cells from primary breast cancers and luminal and myoepithelial cells isolated from normal human breast tissue were isolated by immunomagnetic separation methods. Pools of RNA from highly enriched preparations of these cell types were subjected to expression profiling using massively parallel signature sequencing (MPSS) and four different genome wide microarray platforms. Functional related transcripts of the differential tumour epithelial transcriptome were used for gene set enrichment analysis to identify enrichment of luminal and myoepithelial type genes. Clinical pathological validation of a small number of genes was performed on tissue microarrays.
Results MPSS identified 6,553 differentially expressed genes between the pool of normal luminal cells and that of primary tumours substantially enriched for epithelial cells, of which 98%
were represented and 60% were confirmed by microarray profiling. Significant expression level changes between these two samples detected only by microarray technology were shown by 4,149 transcripts, resulting in a combined differential tumour epithelial transcriptome of 8,051 genes. Microarray gene signatures identified a comprehensive list of 907 and 955 transcripts whose expression differed between luminal epithelial cells and myoepithelial cells, respectively. Functional annotation and gene set enrichment analysis highlighted a group of genes related to skeletal development that were associated with the myoepithelial/basal cells and upregulated in the tumour sample. One of the most highly overexpressed genes in this category, that encoding periostin, was analysed immunohistochemically on breast cancer tissue microarrays and its expression in neoplastic cells correlated with poor outcome in a cohort of poor prognosis estrogen receptor-positive tumours.
Conclusion Using highly enriched cell populations in combination with multiplatform gene expression profiling studies, a comprehensive analysis of molecular changes between the normal and malignant breast tissue was established. This study provides a basis for the identification of novel and potentially important targets for diagnosis, prognosis and therapy in breast cancer.
Introduction
Breast cancer is a clinically heterogeneous disease and con-sists of many different cell types, including normal and reactive stromal components in addition to the malignant neoplastic compartment. Moreover, it comprises a series of distinct malignant tumours that present diverse cellular features with varying differentiation status, distinct genetic changes, responses to therapy and outcome [1]. Likewise, the normal breast is also composed of different parenchymal and stromal cell types, with the terminal ductal-lobular unit being the most important feature with regard to neoplasia. The latter is com-posed of two morphologically recognisable cell types, epithe-lial cells on the luminal surface and basally located myoepithelial cells. While typical breast cancers have been traditionally regarded as exhibiting characteristics akin to lumi-nal epithelial cells, recent data have shown that some also exhibit, in part or whole, myoepithelial/basal features [2-4]. Based on the restricted expression of genes representing the phenotypes of luminal epithelial and basal cells [4], major sub-types of breast cancer have been defined and linked to both long term survival [5] and their response to therapy [6]. There-fore, detailed characterisation of the normal luminal and myoepithelial/basal phenotypes is a prerequisite for under-standing the genetic alterations that occur in breast cancers and how they may impact on disease progression and outcome.
The use of solid tissues, as in most previous breast cancer gene expression analyses, results in greatly enhanced com-plexity of data because of the widely varying degrees of stro-mal responses (desmoplasia) and inflammatory infiltrates in individual tumours. Laser capture microdissection partially alleviates this problem in respect to tumour samples, but is unsuited to the large-scale separation of the normal epithelial cell types in breast because of the close contact between these cells. Immunomagnetic separation of individual cell types from normal human breast tissue [7,8] and primary breast cancers [9] has enabled direct comparisons of normal epithelial and malignant epithelial cells to be made. Previous proteomic [9,10] and gene expression analyses of such sam-ples [10-13] have established a partial molecular characterisa-tion of the epithelial compartment in the normal breast and breast cancer [2], but, due to the limitations of technology available at the time of these studies, did not provide a com-prehensive comparison of all proteins or transcripts.
Multiple large-scale analytical techniques now make it possi-ble to capture entire transcriptomes of defined cell popula-tions. Breast cancers have been extensively analysed with both expression arrays [14] and with direct sequencing tech-niques such as serial analysis of gene expression (SAGE) [15]. Although several studies have correlated expression data
based on microarray and SAGE [16,17], a comprehensive genome-wide expression profile using a combination of com-plementary technologies has not yet been achieved for puri-fied malignant epithelial breast cells in comparison with purified normal breast epithelial cells. In this study, massively parallel signature sequencing (MPSS) [18,19] and multiple genome-wide microarrays have been used to analyse immu-nomagnetically separated normal luminal epithelial cells and primary breast cancers substantially enriched for the neoplas-tic epithelial component. The aim of this study was to establish a virtually complete coverage of transcripts deregulated in the neoplastic cells of human breast cancer. In addition, expres-sion profiles from normal luminal and myoepithelial cells have been used to identify cell-type specific transcripts and onto-logically related gene sets in the differentially expressed tumour epithelial transcriptome. The use of highly enriched cell preparations in combination with a multiplatform approach to their expression analysis has revealed novel markers and potential targets, the clinical significance of some of which has also been examined, using tissue microarrays.
Materials and methods
Sample preparation
Ten primary cultures (approximately 107) of normal human
breast luminal and myoepithelial cells were prepared from reduction mammoplasty samples by double immunomagnetic sorting methods [7,8,10]. In brief, breast epithelial cells were immunomagnetically purified using combined positive mag-netic activated cell sorting (MACS; Miltenyi Biotec, Auburn, CA) selection with antibodies against the luminal epithelial marker EMA (rat monoclonal ICR-2, Seralab, Leicestershire, UK) and the myoepithelial membrane antigen CD10 (mouse monoclonal CALLA clone SS2/36, DAKO Corporation, Glos-trup, Denmark), followed by negative Dynabead (Dynal, UK) selection using mouse monoclonal antibodies against anti-β -4-integrin clone A9, a myoepithelial cell-surface antigen (Santa Cruz Biotechnology, CA, USA) and BerEp-4 Epithelial Antigen, a luminal antigen (DAKO Corporation, Glostrup, Den-mark). Immunostaining with myoepithelial and luminal-specific lineage markers showed the final sort of epithelial cells used in this study to be >95% pure. Full details of these procedures are not only contained in previous publications [10,11], but are also appended, as required, to the Minimum information about a microarray experiment (MIAME) protocol that accompanies submission E-TABM-66 [20].
Malignant breast epithelial cells of 50 freshly isolated primary infiltrating ductal carcinomas of histological grade 2 and 3 were enriched from disaggregated tumour tissue as described previously [9]. In brief, fresh tumour biopsies (1 to 2 g) were comminuted to approximately 1 mm3, using scalpel blades,
medium with 2% fetal calf serum for 4 to 6 h with intermittent shaking. After brief settling, the supernatant was spun down, and the pellet resuspended in L-15 medium and passed through a 100 µm mesh filter to remove residual undisaggre-gated tumour fragments, plus disaggreundisaggre-gated 'normal' orga-noids and ducts as well as lobules and ducts distended with ductal carcinoma in situ, leaving only small clusters and single cells. The latter were then reacted with the mouse monoclonal antibody F19 to fibroblast activation protein bound to sheep anti-mouse coated Dynabeads (Dynal, Paisley, UK) using the manufacturer's protocols. Almost all desmoplastic fibroblasts associated with breast cancers express this antigen strongly. Cells attached to beads were removed with a Dynal MP40 magnet; F19-negative cells were then allowed to sediment under unit gravity for 2 to 3 h (to remove most lymphocytes). The resulting preparation was then screened by phase con-trast microscopy to identify those preparations in which there were few if any microvessels (the other main potential stromal contaminant not removed by fibroblast activation protein sort-ing), or normal tissue elements, such as ducts or acini's. Of the 50 samples, 15 were selected for this study, based on the cri-teria of ≥80% malignant cell content as determined by phase-contrast examination, ≥80% viability (as determined by trypan blue exclusion) and the integrity of its total RNA. The purity of both normal and malignant epithelial preparations is illustrated in Additional file 1. Informed consent to use this material for scientific research was obtained, and details of the pathology of the individual tumours are given as Additional file 2. RNA was prepared from individual samples by standard Trizol meth-ods and pooled to give a luminal, a myoepithelial and a malig-nant RNA sample of >1 mg for analysis.
MPSS analysis
MPSS was performed by Lynx Therapeutics, (CA, USA) according to the Megaclone 'signature' protocol [18,19]. Briefly for each library synthesis, after DNase treatment of approximately 300 µg total RNA from normal luminal and malignant breast epithelial pools, cDNA was generated from
poly(A)+ RNA, and amplified copies of each cDNA clone were attached to beads. The sequence adjacent to the poly(A) prox-imal DpnII site was determined by cycles of ligations to fluo-rescently tagged 'decoding' oligonucleotides and cleavages by restriction enzymes. Each sequence signature comprises the DpnII restriction recognition site (GATC) and 13 contigu-ous nucleotides. The raw data resulted from four sequencing runs, collected in two reading frames offset by two nucleotides relative to the anchoring restriction enzyme site and generat-ing approximately 2 to 3 × 10⁶ sequences. Signatures that
were seen in at least two independent runs (reproducible) and were present at a frequency of more than three transcripts per million (tpm) in one sample (significant) were selected for fur-ther analysis.
As a basis for the matching of signature sequences to scripts, we used our own reconstitution of the human tran-scriptome database (HTR) [21-23] based on a comprehensive set of cDNA to genome alignments that are merged into gene models representing the detailed structure of human tran-scribed regions. Each HTR contains a cluster of cDNA sequences, similarly to the NCBI/UniGene database. The annotation of the signature was then performed in two steps as described previously [22], using the NCBI35 assembly of the human genome. Firstly, a 'signature-centric' annotation was performed, where sequence signatures were mapped to either one or more transcribed regions of the genome, includ-ing repetitive sequences, ribosomal, mitochondrial and non-mapped transcripts. In the second step, only signatures from the 'signature-centric' annotation that matched exactly or had one nucleotide mismatch to known transcribed regions were retained to form the 'gene-centric' version. When different sequence signatures mapped to the same gene, counts were combined. To identify genes with significant differences (P value ≤ 0.05) in representation in the two RNA pools, the absolute difference in abundance between the malignant and the normal epithelial RNA sample was determined and log2
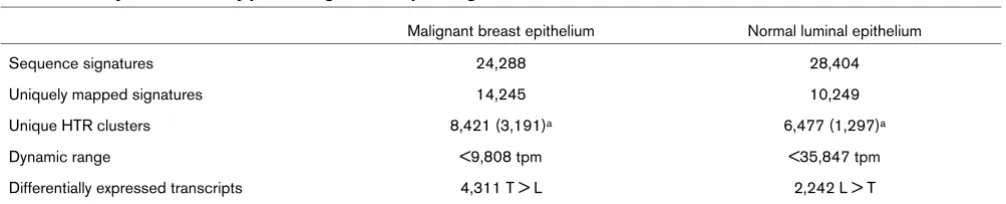
[image:3.612.56.559.111.213.2]transformed, resulting in a relative expression measurement. Table 1
Numerical analysis of massively parallel signature sequencing
Malignant breast epithelium Normal luminal epithelium
Sequence signatures 24,288 28,404
Uniquely mapped signatures 14,245 10,249
Unique HTR clusters 8,421 (3,191)a 6,477 (1,297)a
Dynamic range <9,808 tpm <35,847 tpm
Differentially expressed transcripts 4,311 T > L 2,242 L > T
Sequence signatures represent the total number of sequences obtained by massively parallel signature sequencing (MPSS). Uniquely mapped signatures correspond to the total number of human transcriptome clusters identified and retained in the 'gene-centric' annotation. Unique human transcriptome database (HTR) clusters are transcripts that mapped to a single human cluster and had an abundance of ≥3 transcripts per million (tpm) (approximately one transcript/cell). As described in Materials and methods, statistically significantly (P ≤ 0.05) differentially expressed transcripts were determined and separated into tumour (T) over normal luminal (L) or vice verse, depending on their fold change. aCorresponds to
Microarray analysis
The same total RNA pools were hybridised onto a 20 k cDNA microarray (20 k brk, constructed at The Breakthrough Breast Cancer Research Centre, Institute of Cancer Research, Lon-don, UK containing 19,391 sequence-validated IMAGE clones), Affymetrix Human Genome U133 Plus 2.0 GeneChip (Affymetrix, Inc., Santa Clara, CA, USA), CodeLink™ Human Whole Genome Bioarray (GE, Healthcare, formerly Amersham Biosciences, Chandler, AZ, USA) and Agilent Whole Human Genome Oligo Microarray 44 k cDNA array (Agilent Technol-ogies, Palo Alto, CA, USA). Three technical replicates of each RNA pool were amplified, labelled and hybridised according to manufacturer's guidelines. Where necessary an RNA pool consisting of breast cancer cell lines was used as a reference sample [11] and dye-swap hybridisations were performed. All primary array data are available through ArrayExpress [20]; they comply with MIAME standards, with the accession number E-TABM-66. Overlay of each microarray platform with MPSS was done by mapping the sequence information of probes and probe sets to the same HTR database as used for MPSS tag mapping (see above). Only those microarray fea-tures that were unambiguously mapped to a single HTR clus-ter were included for further studies. All preprocessing of each microarray platform and further statistical analysis was per-formed in the R 2.1.1 environment [24] by making extensive usage of the limma package [25] in BioConductor 1.6 [26]. For the Affymetrix platform, probe-level data were normalised and expression data were summarised by the robust multi-array analysis [27]; cyclic lowess normalisation was applied to the CodeLink™ expression data through the codelink 0.7.2
package in R 2.3; for the Agilent microarrays, global normali-sation with no background correction was applied; and for the 20 k brk microarrays, raw expression data were print-tip normalised and background corrected. Relative measure-ments for each transcript were given as a log2 fold ratio, and
only genes with a false discovery prediction of P ≤ 0.05 were regarded as significantly differentially expressed when using Benjamini and Hochberg' s P values adjustment [28].
Gene Ontology
Genes were categorised with respect to their biological proc-ess, cellular role, molecular function, using Onto-Express (OE) [29,30]. The most significant perturbed biological processes were determined with respect to the number of genes expected for each Gene Ontology (GO) category based on their representation on the Affymetrix U133 Plus 2.0 array. Statistical significance was determined by using OE's hyper-geometric probability distribution and Bonferroni correction options, and annotations with P ≤ 0.05 were accepted as sig-nificant. Gene set enrichment analysis (GSEA) comparing luminal and myoepithelial gene signatures was done using described methods [31]. Biological processes were ranked according to their significance of enrichment, and the valida-tion mode measure of significance was used to identify those of greatest enrichment.
Semiquantitative RT-PCR
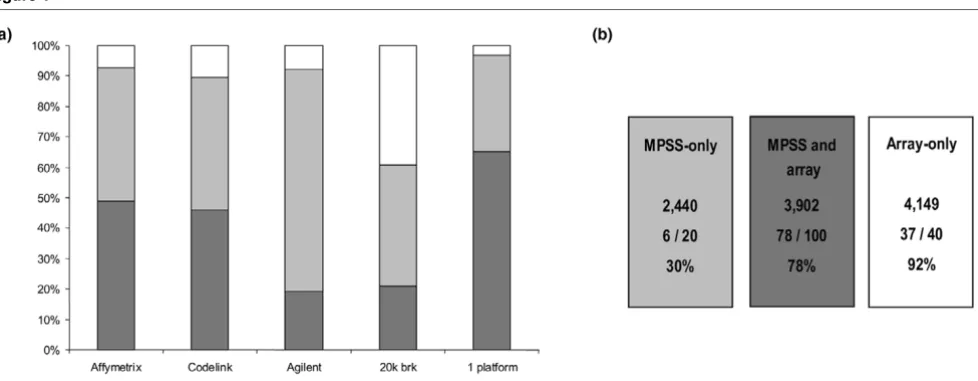
[image:4.612.62.551.91.281.2]Total RNA (10 µg) from the normal luminal epithelial and the malignant epithelial RNA pool was used for each 40 µl reverse-transcription reaction, and 10 µl of 1/50 diluted cDNA Figure 1
Comparison of massively parallel signature sequencing (MPSS) data with microarray analysis
Comparison of massively parallel signature sequencing (MPSS) data with microarray analysis. Differentially expressed gene profiles from MPSS (100%) were overlaid with each microarray platform individually. (a) Percentage of coverage (light grey) and concordance in differential expression between MPSS and individual arrays (dark grey) are shown together with the combined coverage and confirmation by at least one array (1 platform).
was used per 30 µl PCR. RT-PCR was performed by using the Applied Biosystems AmpliTaq Gold, Cheshire, UK, with either 25 or 30 cycles, each consisting of 30 s at 94°C, 30 s at 55°C, and 45 s at 72°C. PCR products were visualised on 2% Invitrogen agarose E-Gels 96 Gels (Invitrogen Life Technolo-gies, Carlsbad, CA, USA).
Immunohistochemistry and tissue microarray analysis A cohort of invasive breast carcinomas from 245 patients treated with surgery (wide local excision or mastectomy) and adjuvant anthracycline-based chemotherapy was retrieved from the Department of Histopathology files of the Royal Marsden Hospital (London, UK) with appropriate local Ethical Committee approval. Representative blocks were reviewed by a pathologist (JSRF) and selected cores were incorporated in two duplicate tissue microarray (TMA) blocks [32,33]. Full details of the TMA are given as Additional file 3. TMA samples were dewaxed in xylene, cleared in absolute ethanol and blocked in methanol for 10 minutes. Antigen retrieval for carti-lage oligomeric matrix protein (COMP) and IL8 was by boiling slides in citrate buffer (pH 6) for 2 minutes in a pressure cooker, after which they were blocked with normal horse serum (2.5% for 20 minutes; Vector Laboratories VL, Burlin-game, CA, USA) and endogenous biotin blocked by pre-incu-bating with avidin (15 minutes) and biotin (15 minutes). They were then incubated with anti-COMP antibody (1/50; Sero-tec, Oxford, UK) or IL8 antibody (1/5; Serotec) for 1 h at room temperature. For immunohistochemistry of Periostin (POSTN), sections were pretreated by microwaving in Dakocytomation (Glostrup, Denmark) pH 6 antigen retrieval buffer for 18 min-utes, blocked, and anti-POSTN antibody (1/1500; Biovendor Laboratory, Heidelberg, Germany) applied for 30 minutes at room temperature. Antibody binding was detected using Vectastain Universal ABC (VL), visualised with 3,3'-diami-nobenzidine DAKO (Corporation, Glostrup, Denmark). Full details on the distribution of ER, PR, HER2, EGFR, CK 14, CK 5/6, and CK 17, as well as P53 (DO7, 1/200; DAKO Corpo-ration) are described elsewhere [33] and summarised in Addi-tional file 3. To evaluate the proliferative activity of tumour cells, immunohistochemical detection of MIB1 antibody to detect Ki-67 nuclear antigen (1/300; DAKO Corporation), which is associated with cell proliferation, was carried out under the same conditions [33]. For these markers, only nuclear staining was considered specific. Ki67 (MIB1) staining was scored low if less than 10% of neoplastic cells were positive, intermediate if 10% to 30% of neoplastic cells were positive and high if more than 30% of neoplastic cells were positive [32]. Tumours were scored positive for P53 if >10% of the nuclei of neoplastic cells displayed strong staining [32].
Cumulative survival probabilities were calculated using the Kaplan-Meier method/log-rank test. Differences between dis-ease-free interval and survival were tested with the log-rank test (two-tailed, confidence interval 95%) using the statistical software Statview 5.0., NC, USA. Multivariate analysis was
performed using the Cox multiple hazards model. A P value < 0.05 in the univariate survival analysis was used as the limit for inclusion in the multivariate model.
Results
MPSS analysis of normal luminal and malignant breast cancer cells
The gene expression profiles that were obtained by MPSS analysis yielded 24,288 and 28,404 signature sequences for the malignant and the normal breast epithelium, respectively; these were pared down to the 'signature-centric' version con-taining 14,245 uniquely mapped and expressed transcripts for the malignant sample and 10,249 transcripts for the normal luminal epithelial sample (Table 1). Based on our HTR (described in Materials and methods [21]), these transcripts corresponded to 8,421 and 6,477 HTR clusters in the malig-nant and the normal RNA samples, respectively (Table 1), of which 3,191 genes were uniquely expressed in the malignant sample, and 1,297 in the normal sample. To define differential expression, a comparative Poisson test was applied [34] and 6,553 genes were identified that showed a differential expres-sion measurement with P ≤ 0.05. (Raw and annotated MPSS data are provided as Additional file 4) Expression levels of dif-ferentially upregulated transcripts in the tumour sample ranged from less than 10 tpm (ESR1, EGF, GPR150, GADD45BGIP1), to over 1,000 tpm (COL1A1, SCGB2A2, SELE, IL8).
Having established a common denominator in terms of gene annotation, those genes reported as differential between the normal and malignant tumour sample by microarrays were defined and then compared with the MPSS data. The criteria for differential expression used were that expression measure-ments between the normal and the malignant sample reported had to be both statistically significant (P ≤ 0.05) and in the same direction (up or down). Out of the four microarray plat-forms, the two single colour oligonucleotide platforms (Affymetrix and CodeLink™) validated as differential 3,206 (48.9%) and 3,004 (45.8%) of all MPSS transcripts present on their platforms, respectively, whereas the two-colour micro-array technologies confirmed only 1,257 (19.1%) and 1,379 (21%), for Agilent and 20 k brk, respectively (Figure 1a). Over-all, a total of 3,902 genes were obtained in which at least one microarray confirmed the MPSS data without any other plat-form reporting an opposite result (Figure 1a; 1 platplat-form). Expression measurements for 2,440 MPSS differential tran-scripts could not be confirmed using any of these microarray platforms (Figure 1b, "MPSS-only"). The microarray data were also used to identify any genes reported as differential by at least two platforms, but which did not appear as such in the MPSS analysis. This comprised a total of 4,149 transcripts (Figure 1b, "Array-only"). To establish which of those sets could be most relied on to constitute the validated differential tumour epithelial transcriptome (DTET), examples of each group were analysed by semi-quantitative RT-PCR (Figure 1b). This showed that only 30% (6/20) of the "MPSS-only" identified differentials could be validated, while 78% (78/100) and 92% (37/40) of the "MPSS and array" and "Array-only" differentially expressed transcripts were reported as differen-tial by RT-PCR (Additional file 6). The comparison of RT-PCR
results was not given any statistical treatment and is simply presented to illustrate that the array confirmed differentials have a much lower false positive rate (20% to 70%). Conse-quently, the latter two groups were combined and comprised 8,051 up- and down-regulated genes that constitute the DTET and were subjected to further analysis (Additional file 7).
Functional classification of differentially expressed genes
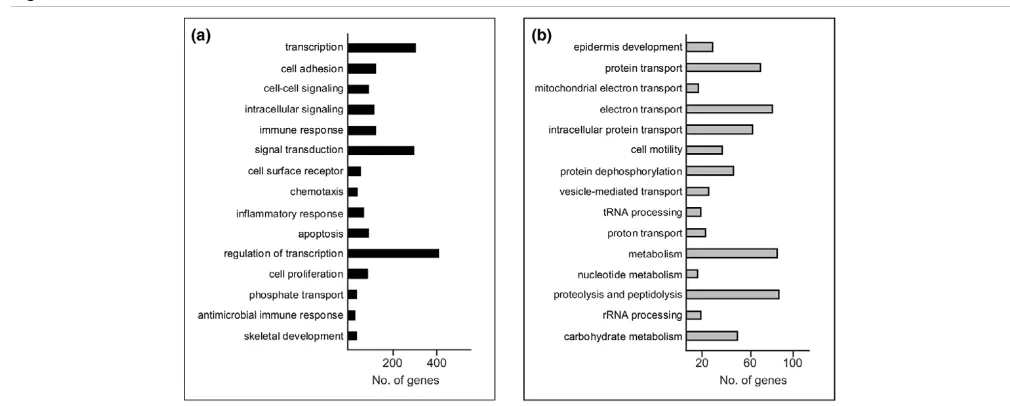
[image:6.612.50.555.92.295.2]GO classification of the 8,051 genes of the DTET revealed that, as might be expected, multiple cellular processes, such as transcription, signal transduction, cell adhesion, cell cycle, metabolism, transport and development, are different in normal luminal epithelium and their malignant counterparts (the full list of perturbed biological processes is provided as Additional file 8). In terms of overall differences, the largest functional group of up-regulated transcripts (Figure 2a) corresponded to genes associated with transcription and regulation in transcription, in agreement with several other profiling studies. The second largest functional group comprised genes involved in signal transduction. These consisted, amongst others, of genes encoding proteins involved in mitogen-activated protein kinases (MAPK) signalling (FGF4, -7, -13, IL1A, IL1B, NGFB, TGFB1 and TGFB3) and the JAK-STAT signalling pathway (IL6, IL10, OSM, SPRY2), as well as ligands and receptors involved in cytokine-cytokine interaction, including members of the CXC and CC chemokines, platelet-derived growth factor, gp130, tumour necrosis factor and transforming growth fac-tor-β subfamilies. Many of these genes have already been cor-related with breast cancer growth and invasion, and their epithelial expression has been demonstrated. In contrast to previously published SAGE data, comparing purified normal Figure 2
Functional classification of the differentially expressed epithelial tumour transcriptome
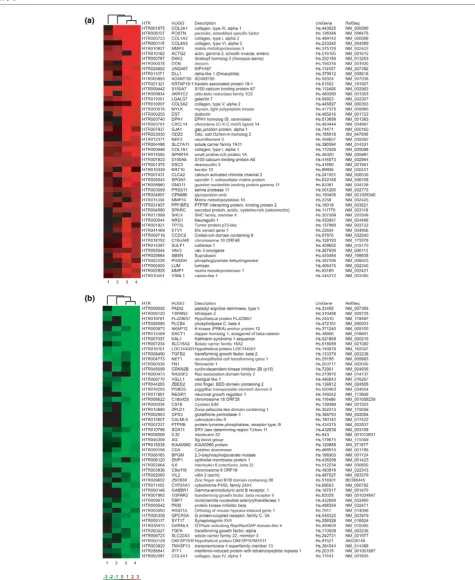
Figure 3
Heatmap of the top 50 genes from the luminal-specific and myoepithelial-specific transcriptomes
breast epithelial tissue with solid tumour breast tissue [12,13] in which reduced expression of cytokines such as IL6 and IL8 was observed, higher abundance of these genes was detected in our malignant breast epithelial sample in compari-son with the normal luminal sample. Ninety genes belonging to the GO category of 'apoptosis', including members of the BAG family (BAG1, BAG2, BAG3), as well as members of the breast cancer 'proliferation signatures' (BUB1, PLK1, CCNE1, CCND1 and CCNB1) were also identified as up-regulated in our DTET [35,36].
The most significantly perturbed functional gene set identified in the down-regulated tumour epithelial transcriptome (Figure 2b) was epidermis development, including members of the kal-likrein family (KLK5, KLK7, KLK8, KLK10) and the keratin fam-ily (CK10, CK14), as well as the family of extracellular matrix glycoproteins, such as LAMC2, LAMB3 and LAMA3. The second most perturbed subset of down-regulated genes included several members of the RAS-related proteins, RAP1A, RALB, RAB5B, RAB4A, RAB3B, RAB2 and RAB25 (protein transport; Figure 2b), some of which counteract the mitogenic function of RAS-MAPK signalling pathways [37].
Differentially expressed transcripts in normal breast epithelial cells
Whether tumours exhibit a luminal or myoepithelial/basal phe-notype has been correlated with prediction and prognosis in breast cancer [2-4]. Global transcriptomes of normal
[image:8.612.56.555.433.655.2]myoepi-thelial and luminal epimyoepi-thelial cells were, therefore, compared to identify all transcripts that were differentially expressed in these normal cell types. The purpose was to further define breast epithelial specificity within the tumour transcriptome by annotating the DTET with respect to their expression in these normal epithelial cell types. Differential gene expression pro-files of immunomagnetically purified luminal and myoepithelial cell samples were established using the criterion of differential detection by at least two of the four genome-wide microarray platforms, as used previously when comparing the normal luminal with the malignant sample. We identified 907 tran-scripts with higher abundance in the normal luminal cells and 955 transcripts were higher in the normal myoepithelial cells. These collectively comprised the differential normal epithelial transcriptome. The top 50 discriminator genes over all four microarray platforms are shown in Figure 3 (complete list is given as Additional file 9). These genome-wide gene signa-tures agreed with previous data from individual luminal and myoepithelial sample analyses [11]. All the main classifiers for the myoepithelial cell type, such as LGALS7, S100A2, SFN, SPARC and CAV1 (and CD24, LCN2, CLDN4, MUC1 and SEMA3B for the luminal epithelial cell type) were identified as differential in the present study. However, as expected from the enhanced coverage provided by the methods used here, many other genes that may play an important role in the biol-ogy of these two cell types were also identified (for example, PADI2, TSPAN2, DACT1 for the luminal, and POSTN, DCN, ADAMTS5 for the myoepithelial cell type).
Figure 4
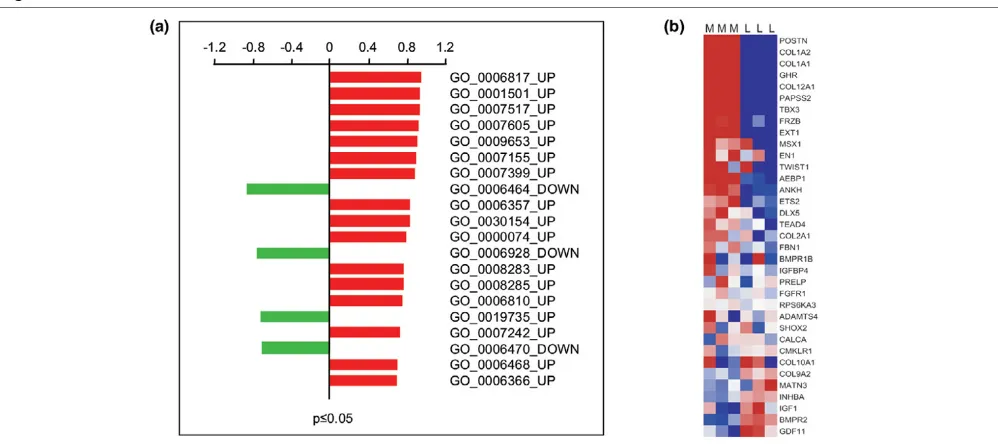
Enrichment of luminal and myoepithelial transcripts in the differentially expressed epithelial tumour transcriptome
Enrichment of luminal and myoepithelial genes and gene sets in the differential tumour epithelial transcriptome
To identify functionally related gene sets of luminal or myoepi-thelial phenotype within the DTET, GSEA was carried out on the perturbed biological processes that were statistically sig-nificant (P ≤ 0.05) and composed of at least 10 genes [31]. This resulted in a total of 72 gene sets, 53 and 19 for the up-and down-regulated modules, respectively (Additional file 8). In the top 20, four categories showed enrichment of genes belonging to our luminal transcriptome, including protein mod-ification (GO:0006464), cell motility (GO:0006928) and pro-tein dephosphorylation (GO:0006470), as down-regulated modules, as well as antimicrobial immune response (GO:0019735) as an up-regulated one (Figure 4a). Overall, GSEA analysis showed marked enrichment for the expression of myoepithelial genes in the functional groups of the tumour overexpressed transcripts compared to the luminal epithelial transcriptome (Figure 4a). The gene set with the most statisti-cally significant representation of myoepithelial type genes consisted of members of the collagenase family
(GO:0006817), with COL3A1, COL6A1, COL1A1,
COL5A12, COL15A2, COL1A1 and COL12A1 representing the discriminator genes. The second most statistically signifi-cant enrichment of expression in myoepithelial type genes with higher abundance in the malignant breast epithelium was found in the functional category of skeletal development (GO:0001501; Figure 4a,b). This set of bone related genes included COL1A2, COL1A1, GHR, COL12A1, PAPSS2, TBX3, FRZB, EXT1, MSX1, EN1, TWIST1 and AEBP1, with POSTN being the most prominent discriminator of this gene set (Figure 4b).
Clinical significance of POSTN using tissue microarray analysis
To evaluate whether the luminal and myoepithelial annotations of our epithelial deregulated transcriptome identify genes with any correlation with clinical outcome in breast cancer, we per-formed immunohistochemical analysis POSTN on a tissue microarray consisting of 245 primary breast tumours. POSTN, usually expressed in mesenchymal cells, was chosen, not only because it was one of the most highly differentially expressed
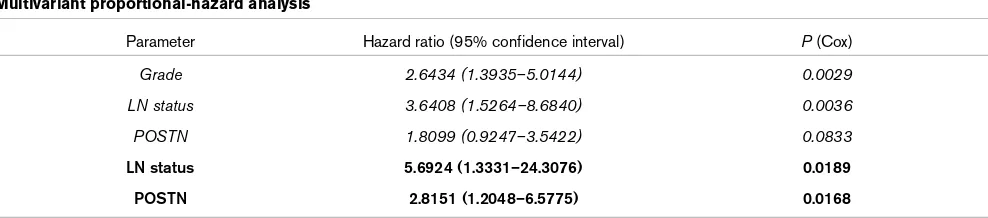
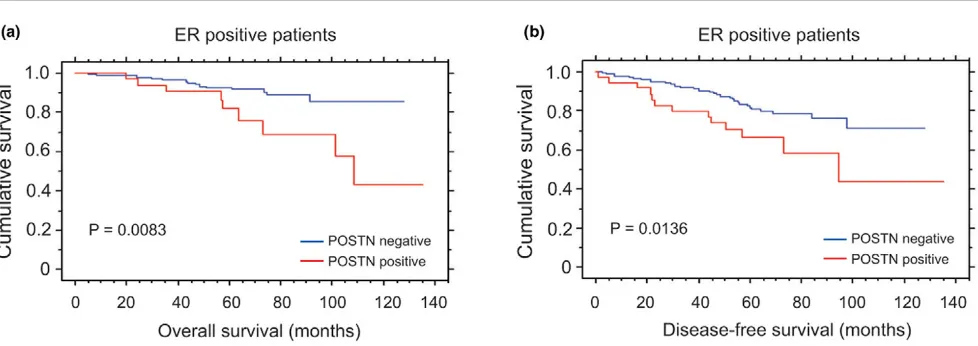
[image:9.612.59.553.105.214.2]genes in normal myoepithelial cells over all microarray plat-forms (Figure 3), but also because it belongs to the functional group of skeletal development that showed overall myolial-specificity and up-regulation in the malignant breast epithe-lium (Figure 4b). When POSTN expression was examined at the protein level, no detectable expression was observed in the normal breast epithelium, but only in the stroma, in concordance with its known mesenchymal expression (not shown). However, 42/224 (18.75%) invasive breast carcino-mas clearly showed epithelial expression (Figure 5a), whereas the remainder showed the expected expression pattern only in the stroma (Figure 5b). POSTN expression in neoplastic cells was significantly correlated with positivity for progesterone receptor (PR) (P < 0.05) and low proliferation rates as defined by Ki67 (MIB1) staining (P < 0.05) (Additional file 10). When the whole cohort was analysed, POSTN-positive breast can-cers showed a trend towards a poorer outcome, although this did not reach statistical significance (Additional file 11a,b). Since the estrogen receptor (ER) status is the most important marker in defining the prognosis and treatment of breast can-cer, the correlation of POSTN expression with overall survival and disease free survival was analysed in positive and ER-negative subgroups. No significant correlation was observed in the ER-negative cohort. However, within the ER-positive subgroup, 20.8% (37/178) of breast tumours were positive and there was a significant correlation with both overall sur-vival (P = 0.0083) and disease-free survival (P = 0.0136) (Fig-ure 6a,b, respectively). In this cohort, modified Bloom-Richardson grade (P < 0.01), lymph node status at diagnosis (P < 0.005) and POSTN expression (P < 0.05) were statisti-cally significant predictors of disease-free survival in univariate analysis, whereas only lymph node status at diagnosis (P < 0.001) and POSTN expression (P < 0.01) were associated with overall survival in univariate analysis. By multivariate anal-ysis of disease-free survival in the ER-positive cohort, POSTN did not reach formal statistical significance as an independent factor (P = 0.0833) (Table 2, italics), although it did constitute an independent prognostic factor for overall survival (P = 0.0168) (Table 2, bold). Two other genes that showed up-reg-ulation in the malignant breast epithelium were also analysed on the protein level by tissue microarray, namely those encod-ing COMP [38], a skeletal developmental protein that was not Table 2
Multivariant proportional-hazard analysis
Parameter Hazard ratio (95% confidence interval) P (Cox)
Grade 2.6434 (1.3935–5.0144) 0.0029
LN status 3.6408 (1.5264–8.6840) 0.0036
POSTN 1.8099 (0.9247–3.5422) 0.0833
LN status 5.6924 (1.3331–24.3076) 0.0189
POSTN 2.8151 (1.2048–6.5775) 0.0168
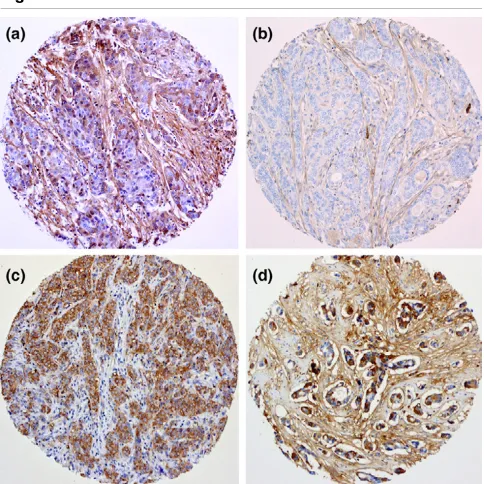
differentially expressed between luminal and myoepithelial cells, and IL8, an inducer of bone resorption. Similarly to POSTN, COMP and IL8 could be clearly detected in the epi-thelial cells of 21% and 13.9% invasive breast carcinomas, respectively (Figure 5c,d). In contrast to POSTN, however, there was no correlation of COMP or IL8 tumour staining with age, grade, stage, ER, PR, disease-free interval or overall sur-vival, although epithelial expression of the mesenchymal mark-ers POSTN and COMP correlated significantly with each other (Additional file 10).
Discussion
Using highly enriched populations of malignant breast epithe-lial cells and normal epitheepithe-lial cells, obtained from immu-nomagnetic cell sorting, we have established genome-wide molecular signatures specific to the epithelial compartments of both the normal and the malignant human breast. Combin-ing gene profiles obtained from different expression platforms, including direct high-throughput sequencing (MPSS) and mul-tiple microarray platforms, yielded a validated transcriptome comprising 8,051 differential transcripts. These data provide a basis for the molecular changes that occur in the transition from normal luminal to malignant epithelial cells, and also allow further analysis of solid breast tumour (neoplastic plus stroma) gene expression studies, enabling those genes of specific epi-thelial origin to be identified in respect to progression, predic-tion of outcome and metastasis. The expression data obtained from the normal luminal and myoepithelial cells have extended our previous analysis of these normal cell types [11], and provide gene sets that can be used to comprehensively spec-ify the epithelial phenotype expressed in breast tumours, as well as defining new markers of each cell type.
The data presented here report for the first time the application and validation of the MPSS sequencing technology to malig-nant human breast epithelial cells and their normal counter-parts. MPSS expression studies of different human cell lines and normal tissues have already shown that this technology represents the most comprehensive sequencing methodology available at present, in terms of gene coverage and quantita-tive assessment of gene expression [22,39]. With over 106
sequencing reactions per sample [18,19], it is comparable in scope with the now commonly used genome-wide microarray profiling methods, as also used in the present study. Compar-ative studies of genome wide data sets are entirely dependent on the choice of common denominator for annotation [40]. By using our sequence based mapping, 97% of MPSS tags could be aligned with individual features on genome-wide microarrays, indicating that the vast majority of the expressed sequence tags in the normal and malignant breast epithelium MPSS libraries represent known transcripts, in agreement with the recent data suggesting that MPSS identifies very few truly novel genes [39]. Given the significant methodological differences between microarray and MPSS analysis, the fact that more than 65% of our MPSS differential data set showed
concordance with expression profiling obtained by several dif-ferent microarray platforms, represents a good overlap compared with other examples of sequence versus array data [41]. However, a substantial number of differentially expressed genes (4,149) measured on at least two microarray platforms were not identified as such by MPSS, and a significant number of MPSS differential transcripts (2,440) were not confirmed on any array (Figure 1), implying a relatively high false positive and false negative rate of the MPSS methodology. This prob-ably reflects the known limitations of the MPSS technology [39], particularly with regards to transcripts that were not detected (zero counts) in one sample, as well as genes lacking appropriate restriction enzyme sites required for this technol-ogy. However, individual microarray platforms themselves dif-fer substantially [42] and a multiplatform approach, as used here, clearly defines a robust DTET seen by every technology.
[image:10.612.314.556.91.333.2]Another important feature of our DTET is the use of purified epithelial cells, derived by both positive and negative immu-nomagnetic sorting in which the contamination of malignant samples with stromal cells is reduced to a minimum, and nor-mal luminal and myoepithelial cells are separated from short-term primary cultures. Although the profiling techniques used represent the global transcriptomes of purified normal and neoplastic breast epithelial cells in highly enriched prepara-tions, it is conceivable that even a small contamination of the Figure 5
Immunohistochemical analysis of periostin (POSTN), IL8 and cartilage oligomeric matrix protein (COMP)
Immunohistochemical analysis of periostin (POSTN), IL8 and cartilage oligomeric matrix protein (COMP). (a) POSTN-positive invasive ductal carcinoma (IDC; ×400), in which both epithelial and stromal cells show cytoplasmic expression. (b) POSTN-negative IDC in which only the spindle shaped stromal cells are stained (×400). (c) IL8 (×100), show-ing positive stainshow-ing only in the malignant breast epithelial cells. (d)
malignant samples by normal or reactive stromal cells, as well as the induction of inflammatory genes due to in vitro manipu-lation, could result in false positives. However, verification of the probable epithelial origin of differentially expressed genes can be obtained by comparing expression data from breast epithelial cell lines [22], breast tumour cell lines or, as in the present study, by immunohistochemistry, all of which show that, for example, IL8, is a bona fide epithelial tumour-associ-ated product [43,44]. One of the features of normal luminal epithelial cultures is the loss of estrogen receptor expression [45]. The microarray gene expression profiling currently used to classify breast cancers supports the paradigm that ER sta-tus is the most important phenotype in breast cancer and has led to the classification of breast cancers into luminal A (ER-positive good prognosis) and luminal B (ER-(ER-positive poor prognosis), and ER-negative myoepithelial/basal and HER2 subtypes, each with distinct differences in prognosis and response to therapy [4,5,46]. Genes identified in this study representing the normal luminal epithelial phenotype are dis-tinct from the subset of genes that are associated with ER expression and are used to classify 'luminal' breast tumours. Thus, we are able to define the luminal phenotype independ-ently of ER status. In contrast, our myoepithelial signature con-tains several members of the previously reported gene clusters identifying basal-like breast cancers. Some of these have been previously identified as myoepithelial genes in the normal breast epithelium, for example, TIMP3, SPARC, JAG1, PRSS11 and CAV-1 [11], and some of them, such as S100A7, SPARC and CNN1, have previously been shown individually to be correlated to poor outcome [5,11,47]. Since our cell type specific gene signatures were derived from phe-notypically well characterised cell types compared to empirical stratification based on expression data, we were also able to identify a range of myoepithelial type genes in ER-positive tumours as well as those in basal-like breast cancers. Thus,
although the majority of the primary breast tumours within our malignant pool were ER-positive 'luminal' tumours, a significant number of up-regulated gene sets also showed myoepithelial expression. The observation of myoepithelial genes such as SFRP2, DCN, POSTN, LUM, COL1A2 and COL11A1, which showed higher expression in ER-positive compared to ER-negative breast tumours in two other breast cancer tumour profiling studies [48,49], proved the value of such an approach and demonstrated the heterogeneity of breast tumours with respect to the levels of luminal epithelial and myoepithelial gene expression. The potential clinical sig-nificance of the expression of myoepithelial/basal genes in ER-positive tumours has been highlighted by recent data showing that the promoter DNA methylation of the classic myoepithelial marker S100A2 is correlated with a poor prognosis in ER-pos-itive tumours [50]. In contrast, increased levels of expression of phosphoserine aminotransferase (encoded by PSAT1), which was another gene also identified in our myoepithelial transcriptome, was the strongest predictive marker for a poor response to tamoxifen therapy in ER-positive tumours [50]. Our observation that the malignant epithelial expression of POSTN, also a myoepithelial/basal gene, is associated with
poorer survival (P = 0.0083) in ER-positive tumours
demonstrates that the normal epithelial annotation of tumour transcripts can identify many other types of myoepithelial/ basal genes, including those associated with a poor outcome.
[image:11.612.60.549.95.268.2]An important question is whether the expression of myoepithe-lial/basal genes in breast cancers are responsible for the prog-nosis and poor response to therapy or are merely surrogate markers thereof. There are several lines of evidence to suggest that POSTN may play a role in the biology of breast cancer [51,52]. POSTN is a ligand of αvβ3 integrins and promotes adhesion and migration of epithelial cells [51]. Clinical studies of periostin expression in human cancers have demonstrated Figure 6
Cumulative Kaplan-Meier curves for epithelial expression of periostin (POSTN)
that increased expression of POSTN is correlated with tumour angiogenesis and metastasis [52-54]. In primary breast tumours, POSTN causes up-regulation of vascular endothelial growth factor receptor (VEGFR)-2 in endothelial cells [52]. Elevated expression of VEGFs, the ligands for the VEGF receptors, as observed in some breast carcinomas as well as in our study, provides synergistic paracrine signalling through VEGFR-2 on endothelial cells, potentially promoting angiogen-esis and dissemination. Although the expression of POSTN shows a weak correlation with Ki67 immunoreactivity, there is no evidence to suggest that POSTN itself influences prolifera-tion or is a surrogate marker of proliferaprolifera-tion rate. Rather, it seems more likely that that its prognostic significance may be due to the altered therapeutic responses of POSTN positive tumours to drugs like tamoxifen. The fact that tumour-specific expression of VEGFR-2 has been associated with an impaired response to tamoxifen therapy in ER-positive premenopausal breast cancer [55] is in line with the poor prognosis of this cohort of breast cancers. Therefore, further studies are required to investigate if POSTN positivity is correlated with VEGFR-2 expression, thereby providing a molecular mecha-nism that links POSTN to endocrine resistance for ER-positive breast tumours.
Metastasis to bone occurs frequently in advanced breast can-cer and is accompanied by debilitating skeletal complications [56]. Among the up-regulated gene sets in the malignant sam-ple with enrichment in myoepithelial/basal type genes in this study was a small family of genes involved in bone remodelling and skeletal development. Their expression in the human breast epithelial cells, including the normal myoepithelial cells, indicates that they play a significant role in epithelial cell biol-ogy, in addition to mesenchymal development. Many of these mesenchymal-specific genes, associated with osteoblasts, have previously been found overexpressed in other primary breast tumours [57]. By acquiring the expression of such mes-enchymal genes, the malignant epithelial breast cells may have an advantage in growth in the bone environment correlating with progression into a more aggressive cancer phenotype. Targeting such genes and proteins might, therefore, be a means of suppressing this phenomenon.
Conclusion
In the past decade, several different expression and proteom-ics studies on purified cell populations of normal luminal and myoepithelial, as well as tumour enriched cell populations, have been carried out [11-13,58,59]. Genes characterising these cell types have been identified, some of which showed altered expression levels in the malignant compared to the nor-mal breast epithelium. In this study, we have taken this profiling forward by comprehensively defining the transcriptomes of highly enriched normal and malignant breast epithelial cell populations on a genome wide scale using multiple technolo-gies. We present here, for the first time, co-regulated breast tumour-associated gene sets enriched in either luminal or
myoepithelial-type genes. These data are important for evalu-ating the breast cancer stratification systems based on estab-lished expression profiling, in which luminal and basal phenotypes have been shown to be prognostically significant. Further analysis of these related gene subsets, including expression studies in individual tumours, will assist in our understanding of the mechanisms involved in the initiation and progression of breast cancer, and the loss or acquisition of luminal or myoepithelial phenotypes in breast tumours. This will lead to the identification of additional luminal and basal markers and targets, with importance in the biology of breast cancer and its treatment.
Competing interests
The authors declare that they have no competing interests.
Authors' contributions
This study was conceived by AG, AM and MJOH. The expres-sion profiling and statistical analysis was carried out by AG, AM, KF and MI. The pathological analysis and immunohisto-chemistry were performed by JSRF and DS. ML performed the RT-PCRs. CI, BS, HV and CVJ participated in the sequence alignment and annotation of MPSS data. The manuscript was written by AG, AM, AMN and MJOH with help from JRSF, PSJ, AA, AJGS and RLS. All authors read and approved the final manuscript. AG and AM contributed equally to this work.
Additional files
The following Additional files are available online:
Additional file 1
A jpeg figure showing cell separation of normal and malignant breast epithelial cells. Purity of separated normal and malignant cells. (a) A short-term primary culture of breast epithelium stained with monoclonal antibodies specific for vimentin (green), CK 14 (red), CK 18 (blue) and CK 19 (purple), as visualised with appropriate class and sub-class specific fluorescence conjugated secondary antibodies (×150). The middle and right columns show the double immunomagneticallly separated luminal and myoepithelial preparations stained in the same manner, illustrating their homogeneity in respect of cells expressing luminal (CK 18/CK 19) and myoepithelial markers (CK 14/vimentin). (b) The irregular clusters of cohesive malignant epithelial cells obtained when a disaggregated tumour is subject to filtration, sedimentation and negative selection for fibroblast activation protein-positive reactive stromal cells and visualised by phase-contrast microscopy to identify samples with minimal microvessel and lymphocytic contamination (×400).
Additional file 2
A Word document showing the pathology of primary breast tumours used for MPSS and microarray analysis. The pathological information of 15 primary breast tumours regarding grade, type, size of vascular invasion, lymph node status, estrogen (ER), progesteron (PR) and Her-2 status is provided.
See http://www.biomedcentral.com/content/ supplementary/bcr1604-S2.doc
Additional file 3
A Word document providing a detailed description of the tissue microarray. Summary of clinicopathological features of patients included in the tissue microarrays. A cohort of 245 invasive breast carcinomas from 245 patients treated with surgery (wide local excision or mastectomy) and adjuvant anthracycline-based chemotherapy was retrieved from the Department of Histopathology files of the Royal Marsden Hospital with appropriate local Ethical Committee approval (Royal Marsden Hospital, London, UK). Representative blocks from 245 invasive breast carcinomas were reviewed by a pathologist (JSRF) and included in duplicate in two tissue microarray (TMA) blocks as previously described. In brief, 0.6 mm core tissue specimens were taken from selected areas of donor blocks (original tumour blocks) and precisely arrayed into two new recipient paraffin blocks (20 × 35 mm) with a custom-built precision instrument (Beecher Instruments, Silver Spring, MD, USA). The presence of tumour tissue in the arrayed sample was verified on a haematoxylin and eosin stained section. ER, PR, p53, vascular invasion, Ki67 (MIB-1) labelling index and nodal status were known for all samples. Follow up was available for 244 patients, ranging from 0.5 to 135.3 months (median = 67.3 months, mean = 67.3 months).
See http://www.biomedcentral.com/content/ supplementary/bcr1604-S3.doc
Additional file 4
An Excel file listing raw and annotated MPSS data for malignant and normal breast epithelial samples. Sequence signatures with their corresponding annotation and their expression in tpm are shown. Transcripts uniquely expressed in the malignant breast epithelium and in the normal luminal epithelium are highlighted in yellow and red, respectively.
See http://www.biomedcentral.com/content/ supplementary/bcr1604-S4.xls
Additional file 5
An Excel file containing a table showing an overlay of the multiple microarray platforms based on the HTR database. Microarray featuers of Affymetrix U133 Plus 2.0 GeneChip and CodeLink™ Human Whole Genome Bioarray, Agilent Whole Human Genome Oligo Microarray 44 k cDNA array and 20 k brk cDNA microarray were mapped onto the HTR database. See http://www.biomedcentral.com/content/ supplementary/bcr1604-S5.xls
Additional file 6
An Excel file containing a table showing the semi-quantitative RT-PCR of transcripts belonging to the three groups (MPSS-only, MPSS-array confirmed and Array-only). Transcripts with their respective annotation, RT-PCR primer sequence and level of expression detected by RT-PCR are shown.
See http://www.biomedcentral.com/content/ supplementary/bcr1604-S6.xls
Additional file 7
An Excel file containing a table showing the differential tumour epithelial transcriptome. All 8,051 differentially expressed normal luminal versus tumour genes are listed with their HTR cluster_ID, microarray_ID and their respective fold change for each microarray platform, comprising the differentially expressed epithelial tumour transcriptome.
See http://www.biomedcentral.com/content/ supplementary/bcr1604-S7.xls
Additional file 8
An Excel file containing a table showing the biological processes deregulated in the DTET. Biological
processes of the up- and down-regulated transcripts are shown. Gene Ontology identifiers, description, total number of input genes, as well as P value are shown. The input genes for the most significant deregulated biological processes are provided by their gene names and their RefSeq accession numbers.
See http://www.biomedcentral.com/content/ supplementary/bcr1604-S8.xls
Additional file 9
An Excel file containing a table showing the differential normal epithelial transcriptome. Luminal and
myoepithelial transcriptomes based on multiple
microarray analyses HTR cluster, microarray feature, fold change and P value are listed for each gene.
See http://www.biomedcentral.com/content/ supplementary/bcr1604-S9.xls
Acknowledgements
This work was funded by the Ludwig Institute for Cancer Research and Breakthrough Breast Cancer. Further thanks are due to Prof. K Felsen-stein, Vienna University of Technology, Austria, for statistical advice; and Prof. S Lakhani for reviewing the pathology of the tumours used for MPSS and microarray analysis.
References
1. Simpson PT, Reis-Filho JS, Gale T, Lakhani SR: Molecular evolu-tion of breast cancer. J Pathol 2005, 205:248-254.
2. Abd El-Rehim DM, Ball G, Pinder SE, Rakha E, Paish C, Robertson JF, Macmillan D, Blamey RW, Ellis IO: High-throughput protein expression analysis using tissue microarray technology of a large well-characterised series identifies biologically distinct classes of breast cancer confirming recent cDNA expression analyses. Int J Cancer 2005, 116:340-350.
3. Nielsen TO, Hsu FD, Jensen K, Cheang M, Karaca G, Hu Z, Hern-andez-Boussard T, Livasy C, Cowan D, Dressler L, et al.: Immu-nohistochemical and clinical characterization of the basal-like subtype of invasive breast carcinoma. Clin Cancer Res 2004,
10:5367-5374.
4. Perou CM, Sorlie T, Eisen MB, van de Rijn M, Jeffrey SS, Rees CA, Pollack JR, Ross DT, Johnsen H, Akslen LA, et al.: Molecular por-traits of human breast tumours. Nature 2000, 406:747-752. 5. Sorlie T, Perou CM, Tibshirani R, Aas T, Geisler S, Johnsen H,
Hastie T, Eisen MB, van de Rijn M, Jeffrey SS, et al.: Gene expres-sion patterns of breast carcinomas distinguish tumor sub-classes with clinical implications. Proc Natl Acad Sci USA 2001, 98:10869-10874.
6. Rouzier R, Perou CM, Symmans WF, Ibrahim N, Cristofanilli M, Anderson K, Hess KR, Stec J, Ayers M, Wagner P, et al.: Breast cancer molecular subtypes respond differently to preoperative chemotherapy. Clin Cancer Res 2005, 11:5678-5685. 7. Clarke C, Titley J, Davies S, O'Hare MJ: An immunomagnetic
separation method using superparamagnetic (MACS) beads for large-scale purification of human mammary luminal and myoepithelial cells. Epithelial Cell Biol 1994, 3:38-46. 8. O'Hare MJ, Ormerod MG, Monaghan P, Lane EB, Gusterson BA:
Characterization in vitro of luminal and myoepithelial cells iso-lated from the human mammary gland by cell sorting. Differ-entiation 1991, 46:209-221.
9. Adam PJ, Berry J, Loader JA, Tyson KL, Craggs G, Smith P, De Belin J, Steers G, Pezzella F, Sachsenmeir KF, et al.: Arylamine N-acetyltransferase-1 is highly expressed in breast cancers and conveys enhanced growth and resistance to etoposide in vitro.
Mol Cancer Res 2003, 1:826-835.
10. Page MJ, Amess B, Townsend RR, Parekh R, Herath A, Brusten L, Zvelebil MJ, Stein RC, Waterfield MD, Davies SC, et al.: Pro-teomic definition of normal human luminal and myoepithelial breast cells purified from reduction mammoplasties. Proc Natl Acad Sci USA 1999, 96:12589-12594.
11. Jones C, Mackay A, Grigoriadis A, Cossu A, Reis-Filho JS, Fulford L, Dexter T, Davies S, Bulmer K, Ford E, et al.: Expression profil-ing of purified normal human luminal and myoepithelial breast cells: identification of novel prognostic markers for breast cancer. Cancer Res 2004, 64:3037-3045.
12. Porter DA, Krop IE, Nasser S, Sgroi D, Kaelin CM, Marks JR, Rig-gins G, Polyak K: A SAGE (serial analysis of gene expression) view of breast tumor progression. Cancer Res 2001,
61:5697-5702.
13. Zucchi I, Mento E, Kuznetsov VA, Scotti M, Valsecchi V, Simionati B, Vicinanza E, Valle G, Pilotti S, Reinbold R, et al.: Gene expres-sion profiles of epithelial cells microscopically isolated from a breast-invasive ductal carcinoma and a nodal metastasis.
Proc Natl Acad Sci USA 2004, 101:18147-18152.
14. Chang JC, Hilsenbeck SG, Fuqua SA: The promise of microar-rays in the management and treatment of breast cancer.
Breast Cancer Res 2005, 7:100-104.
15. Robison JE, Perreard L, Bernard PS: State of the science: molec-ular classifications of breast cancer for clinical diagnostics.
Clin Biochem 2004, 37:572-578.
16. Shen D, He J, Chang HR: In silico identification of breast cancer genes by combined multiple high throughput analyses. Int J Mol Med 2005, 15:205-212.
17. van Ruissen F, Ruijter JM, Schaaf GJ, Asgharnegad L, Zwijnenburg DA, Kool M, Baas F: Evaluation of the similarity of gene expres-sion data estimated with SAGE and Affymetrix GeneChips.
BMC Genomics 2005, 6:91.
18. Brenner S, Johnson M, Bridgham J, Golda G, Lloyd DH, Johnson D, Luo S, McCurdy S, Foy M, Ewan M, et al.: Gene expression analysis by massively parallel signature sequencing (MPSS) on microbead arrays. Nat Biotechnol 2000, 18:630-634. 19. Brenner S, Williams SR, Vermaas EH, Storck T, Moon K,
McCol-lum C, Mao JI, Luo S, Kirchner JJ, Eletr S, et al.: In vitro cloning of complex mixtures of DNA on microbeads: physical separation of differentially expressed cDNAs. Proc Natl Acad Sci USA 2000, 97:1665-1670.
20. ArrayExpress [http://www.ebi.ac.uk/arrayexpress/]
21. Iseli C, Stevenson BJ, de Souza SJ, Samaia HB, Camargo AA, Buetow KH, Strausberg RL, Simpson AJ, Bucher P, Jongeneel CV:
Long-range heterogeneity at the 3' ends of human mRNAs.
Genome Res 2002, 12:1068-1074.
22. Jongeneel CV, Iseli C, Stevenson BJ, Riggins GJ, Lal A, Mackay A, Harris RA, O'Hare MJ, Neville AM, Simpson AJ, et al.: Compre-hensive sampling of gene expression in human cell lines with massively parallel signature sequencing. Proc Natl Acad Sci USA 2003, 100:4702-4705.
23. Naef F, Huelsken J: Cell-type-specific transcriptomics in chi-meric models using transcriptome-based masks. Nucleic Acids Res 2005, 33:e111.
24. The R Project for Statistical Computing [http://www.r-project.org/]
25. Smyth GK: Linear models and empirical Bayes methods for assessing differential expression in microarray experiments.
Stat Appl Genet Mol Biol 2004, 3:Article 3. 26. Bioconductor [http://www.bioconductor.org/]
27. Irizarry RA, Hobbs B, Collin F, Beazer-Barclay YD, Antonellis KJ, Scherf U, Speed TP: Exploration, normalization, and summa-ries of high density oligonucleotide array probe level data.
Biostatistics 2003, 4:249-264.
28. Benjamini Y, Hochberg Y: Controlling the false discovery rate: a practical and powerful approach to multiple testing. J R Stat Soc 1995, 57:289-300.
29. Draghici S, Khatri P, Bhavsar P, Shah A, Krawetz SA, Tainsky MA:
Onto-Tools, the toolkit of the modern biologist: Onto-Express, Onto-Compare, Onto-Design and Onto-Translate. Nucleic Acids Res 2003, 31:3775-3781.
30. Onto-Express [http://vortex.cs.wayne.edu/ontoexpress] 31. Subramanian A, Tamayo P, Mootha VK, Mukherjee S, Ebert BL,
Gillette MA, Paulovich A, Pomeroy SL, Golub TR, Lander ES, et al.:
Gene set enrichment analysis: a knowledge-based approach for interpreting genome-wide expression profiles. Proc Natl Acad Sci USA 2005, 102:15545-15550.
A Word document detailing the univariate analysis of POSTN on the tumour tissue microarray. Univariate analysis of clinicopathological and immunohistochemical data on the 245 tumour tissue microarray with respect to the epithelial expression of POSTN. P values were calculated by the log-rank test.
See http://www.biomedcentral.com/content/ supplementary/bcr1604-S10.doc
Additional file 11
Cumulative Kaplan-Meier curves for epithelial expression of POSTN. Probability of (a) overall survival (OS) and (b)
disease free survival (DFS) for all patients; and
probability of (c) OS and (d) DFS for only patients with ER positive tumours. P values were calculated by the log-rank test.
32. Reis-Filho JS, Savage K, Lambros MB, James M, Steele D, Jones RL, Dowsett M: Cyclin D1 protein overexpression and CCND1 amplification in breast carcinomas: an immunohistochemical and chromogenic in situ hybridisation analysis. Mod Pathol 2006, 19:999-1009.
33. Reis-Filho JS, Steele D, Di Palma S, Jones RL, Savage K, James M, Milanezi F, Schmitt FC, Ashworth A: Distribution and signifi-cance of nerve growth factor receptor (NGFR/p75(NTR)) in normal, benign and malignant breast tissue. Mod Pathol 2006,
19:307-319.
34. Lehmann: Testing Statistical Hypothesis New York: Wiley; 1986. 35. Dai H, van't Veer L, Lamb J, He YD, Mao M, Fine BM, Bernards R, van de Vijver M, Deutsch P, Sachs A, et al.: A cell proliferation signature is a marker of extremely poor outcome in a subpop-ulation of breast cancer patients. Cancer Res 2005,
65:4059-4066.
36. Whitfield ML, George LK, Grant GD, Perou CM: Common mark-ers of proliferation. Nat Rev Cancer 2006, 6:99-106.
37. Cheng JM, Ding M, Aribi A, Shah P, Rao K: Loss of RAB25 expression in breast cancer. Int J Cancer 2006,
118:2957-2964.
38. Newton G, Weremowicz S, Morton CC, Copeland NG, Gilbert DJ, Jenkins NA, Lawler J: Characterization of human and mouse cartilage oligomeric matrix protein. Genomics 1994,
24:435-439.
39. Jongeneel CV, Delorenzi M, Iseli C, Zhou D, Haudenschild CD, Khrebtukova I, Kuznetsov D, Stevenson BJ, Strausberg RL, Simp-son AJ, et al.: An atlas of human gene expression from massively parallel signature sequencing (MPSS). Genome Res 2005, 15:1007-1014.
40. Irizarry RA, Warren D, Spencer F, Kim IF, Biswal S, Frank BC, Gabrielson E, Garcia JG, Geoghegan J, Germino G, et al.: Multi-ple-laboratory comparison of microarray platforms. Nat Methods 2005, 2:345-350.
41. Oudes AJ, Roach JC, Walashek LS, Eichner LJ, True LD, Vessella RL, Liu AY: Application of Affymetrix array and massively par-allel signature sequencing for identification of genes involved in prostate cancer progression. BMC Cancer 2005, 5:86. 42. Draghici S, Khatri P, Eklund AC, Szallasi Z: Reliability and
repro-ducibility issues in DNA microarray measurements. Trends Genet 2006, 22:101-109.
43. Bendre MS, Montague DC, Peery T, Akel NS, Gaddy D, Suva LJ:
Interleukin-8 stimulation of osteoclastogenesis and bone resorption is a mechanism for the increased osteolysis of met-astatic bone disease. Bone 2003, 33:28-37.
44. Green AR, Green VL, White MC, Speirs V: Expression of cytokine messenger RNA in normal and neoplastic human breast tissue: identification of interleukin-8 as a potential reg-ulatory factor in breast tumours. Int J Cancer 1997,
72:937-941.
45. Kothari MS, Ali S, Buluwela L, Livni N, Shousha S, Sinnett HD, Vashisht R, Thorpe P, Van Noorden S, Coombes RC, et al.: Puri-fied malignant mammary epithelial cells maintain hormone responsiveness in culture. Br J Cancer 2003, 88:1071-1076. 46. Sorlie T, Tibshirani R, Parker J, Hastie T, Marron JS, Nobel A, Deng
S, Johnsen H, Pesich R, Geisler S, et al.: Repeated observation of breast tumor subtypes in independent gene expression data sets. Proc Natl Acad Sci USA 2003, 100:8418-8423. 47. Emberley ED, Niu Y, Curtis L, Troup S, Mandal SK, Myers JN,
Gib-son SB, Murphy LC, WatGib-son PH: The S100A7-c-Jun activation domain binding protein 1 pathway enhances poor survival pathways in breast cancer. Cancer Res 2005, 65:5696-5702. 48. Wang Y, Klijn JG, Zhang Y, Sieuwerts AM, Look MP, Yang F,
Talantov D, Timmermans M, Meijer-van Gelder ME, Yu J, et al.:
Gene-expression profiles to predict distant metastasis of lymph-node-negative primary breast cancer. Lancet 2005,
365:671-679.
49. West M, Blanchette C, Dressman H, Huang E, Ishida S, Spang R, Zuzan H, Olson JA Jr, Marks JR, Nevins JR: Predicting the clinical status of human breast cancer by using gene expression profiles. Proc Natl Acad Sci USA 2001, 98:11462-11467. 50. Martens JW, Nimmrich I, Koenig T, Look MP, Harbeck N, Model F,
Kluth A, Bolt-de Vries J, Sieuwerts AM, Portengen H, et al.: Asso-ciation of DNA methylation of phosphoserine aminotrans-ferase with response to endocrine therapy in patients with recurrent breast cancer. Cancer Res 2005, 65:4101-4117.
51. Gillan L, Matei D, Fishman DA, Gerbin CS, Karlan BY, Chang DD:
Periostin secreted by epithelial ovarian carcinoma is a ligand for alpha(V)beta(3) and alpha(V)beta(5) integrins and pro-motes cell motility. Cancer Res 2002, 62:5358-5364. 52. Shao R, Bao S, Bai X, Blanchette C, Anderson RM, Dang T,
Gishizky ML, Marks JR, Wang XF: Acquired expression of peri-ostin by human breast cancers promotes tumor angiogenesis through up-regulation of vascular endothelial growth factor receptor 2 expression. Mol Cell Biol 2004, 24:3992-4003. 53. Sasaki H, Dai M, Auclair D, Kaji M, Fukai I, Kiriyama M, Yamakawa
Y, Fujii Y, Chen LB: Serum level of the periostin, a homologue of an insect cell adhesion molecule, in thymoma patients.
Cancer Lett 2001, 172:37-42.
54. Sasaki H, Yu CY, Dai M, Tam C, Loda M, Auclair D, Chen LB, Elias A: Elevated serum periostin levels in patients with bone metastases from breast but not lung cancer. Breast Cancer Res Treat 2003, 77:245-252.
55. Ryden L, Jirstrom K, Bendahl PO, Ferno M, Nordenskjold B, Stal O, Thorstenson S, Jonsson PE, Landberg G: Tumor-specific expression of vascular endothelial growth factor receptor 2 but not vascular endothelial growth factor or human epidermal growth factor receptor 2 is associated with impaired response to adjuvant tamoxifen in premenopausal breast cancer. J Clin Oncol 2005, 23:4695-4704.
56. Coleman RE: Conclusion: Bone markers in metastatic bone disease. Cancer Treat Rev 2006, 32(Suppl 1):27-28.
57. Segal E, Friedman N, Koller D, Regev A: A module map showing conditional activity of expression modules in cancer. Nat Genet 2004, 36:1090-1098.
58. Barsky SH: Myoepithelial mRNA expression profiling reveals a common tumor-suppressor phenotype. Exp Mol Pathol 2003,
74:113-122.
59. Polyak K, Hu M: Do myoepithelial cells hold the key for breast tumor progression? J Mammary Gland Biol Neoplasia 2005,