R E S E A R C H A R T I C L E
Open Access
Improving primary health care facility
performance in Ghana: efficiency analysis
and fiscal space implications
Jacob Novignon
1and Justice Nonvignon
2*Abstract
Background:Health centers in Ghana play an important role in health care delivery especially in deprived communities. They usually serve as the first line of service and meet basic health care needs. Unfortunately, these facilities are faced with inadequate resources. While health policy makers seek to increase resources committed to primary healthcare, it is important to understand the nature of inefficiencies that exist in these facilities. Therefore, the objectives of this study are threefold; (i) estimate efficiency among primary health facilities (health centers), (ii) examine the potential fiscal space from improved efficiency and (iii) investigate the efficiency disparities in public and private facilities.
Methods:Data was from the 2015 Access Bottlenecks, Cost and Equity (ABCE) project conducted by the Institute for Health Metrics and Evaluation. The Stochastic Frontier Analysis (SFA) was used to estimate efficiency of health facilities. Efficiency scores were then used to compute potential savings from improved efficiency. Outpatient visits was used as output while number of personnel, hospital beds, expenditure on other capital items and administration were used as inputs. Disparities in efficiency between public and private facilities was estimated using the Nopo matching
decomposition procedure.
Results:Average efficiency score across all health centers included in the sample was estimated to be 0.51. Also, average efficiency was estimated to be about 0.65 and 0.50 for private and public facilities, respectively. Significant disparities in efficiency were identified across the various administrative regions. With regards to potential fiscal space, we found that, on average, facilities could save about GH 11,450.70 (US$7633.80) if efficiency was improved. We also found that fiscal space from efficiency gains varies across rural/urban as well as private/public facilities, if best practices are followed. The matching decomposition showed an efficiency gap of 0.29 between private and public facilities.
Conclusion:There is need for primary health facility managers to improve productivity via effective and efficient resource use. Efforts to improve efficiency should focus on training health workers and improving facility environment alongside effective monitoring and evaluation exercises.
Keywords:Primary health care, Efficiency, Stochastic frontier analysis, Fiscal space for health, Matching decomposition, Ghana
* Correspondence:[email protected]
2Department of Health Policy, Planning and Management, School of Public Health, University of Ghana, Legon, Ghana
Full list of author information is available at the end of the article
Background
Primary health care (PHC) is considered to be an import-ant tool in achieving universal health coverage (UHC). Following the Alma Ata declaration in 1978, several countries have embraced the idea of improving PHC to enhance effective health service delivery [1]. In resource-constrained regions like sub-Sahara Africa (SSA), primary health service delivery helps to bridge the health care in-equity gap against deprived and vulnerable populations. Effective PHC service delivery also reduces pressure on higher level facilities and hence financial pressure on gov-ernments [2].
However, despite its relevance, most primary health fa-cilities are faced with numerous challenges that hinder their effective operations. One such challenge across sev-eral countries in SSA is inadequate resources committed to facilities at this level [3]. While recent calls to increase resources committed to these facilities are valid, other public sector priorities compete for these limited re-sources. It has, therefore, become imperative to create additional fiscal space for the health sector through vari-ous means. One of these means is improving efficiency in the operations of facilities and saving resources that can be reinvested into the health sector [4]. Inefficiency means that current facility outputs could be achieved with fewer resources. Improved efficiency shows reduced wastes in the use of already limited resources [5].
Evidence suggests that inefficiency across health facilities is wide spread in developing countries. For instance, Jehu-Appiah et al. [6] provided evidence from district hospitals in Ghana to show that about 56.2% of the 128 hospitals had efficiency scores below average (0.50). The authors also found quasi-government hospitals to be more efficient relative to private and mission hospitals. Similarly, Alhassan et al. [7] analyzed technical efficiency across public and pri-vate primary health facilities accredited by the National Health Insurance Authority. About 31% out of the 64 hos-pitals were estimated to be optimally efficient. There were also more publicly owned facilities that were efficient com-pared to private and mission hospitals. Interestingly, the study identified higher levels of wastage in urban facilities than rural facilities. Evidence outside Ghana also suggest similar finding. In Burkina Faso, Maschall and Flessa [8] found that less than half of the facilities studied were found to be optimally efficient. Efficiency scores ranged between 1.00 and 0.25 across all facilities. The empirical evidence summarized above point to the fact that there exist signifi-cant inefficiencies across health facilities in developing countries and Ghana is no exception. Several other studies support these findings [9–13]
While most of these studies have assessed efficiency at the level of district hospitals, they are not the lowest in the health care cadre in Ghana. Health centers and Community Health Improvement Service (CHIPS)
compounds, which are located at the bottom of the health care pyramid, are designed to meet the basic health care needs of the population especially in rural areas. In some cases, district facilities serve as reference facilities for the health centers and CHIPS compounds. In this regard, improving the effectiveness of facilities at the lowest level is key to achieving PHC objectives in Ghana. Unfortunately, inefficiency at this level have been under researched even though these are supposed to serve as first line of treatment in the health care pyra-mid. Moreover, improving efficiency at this level of the health service delivery system could be an important source of creating fiscal space in the health sector. It is worth noting that potential resource saving from effi-ciency do not increase the general resource envelop like tax revenue or aid but rather creates space within the existing envelope. It is, therefore, important to under-stand the nature of inefficiencies that exist in these facil-ities. The current study contributes to existing studies in three ways; (i) first, it estimates efficiency among pri-mary health facilities (health centers), (ii) secondly, it in-vestigates the efficiency disparities in public and private facilities (iii) finally, it examines the potential fiscal space from improved efficiency.
Methods
Data
Data for the study was sourced from the 2011 Access, Bottlenecks, Cost and Equity (ABCE) project conducted by the Institute for Health Metrics and Evaluation (IHME) in collaboration with Ghana Ministry of Health (MOH), Ghana Heath Service (GHS), Ghana UNICEF office and UNICEF. The data collects information from facilities at all levels of the health sector across several countries. Information collected include facility finances and input, facility management, equipment and capacity as well as facility outputs. A total of 87 health centers were included in the final sample. The inclusion of facil-ities was determined by data availability.
The stochastic frontier analysis (SFA) model
Following Danquah et al., the starting point of the SFA model is to specify a relationship between a set of health facility inputs that produce an output [14]. This can be specified as
yi¼f lið ; ;ki; ;qiÞ ð1Þ
Assuming that some heath facilities do not efficiently employ inputs to produce output, we can capture the actual observable output in the following stochastic frontier production function
yi¼f lið ; ;ki; ;qi;βÞTEievi ð2Þ
Where βis an estimable parameter, TE captures tech-nical efficiency and measures the deviation of a health facility from the stochastic frontier.viis a random error
term. Equation (2) can be re-specified in a log-linear form as follows
lnyi¼ lnf lið ; ;ki; ;qi;βÞ þ lnTEiþ lnevi ð3Þ
AssumeTEi= exp(−ui) we can reformulate Eq. (3) as
lnyi¼ lnf lið ; ;ki; ;qi;βÞ þei−ui; ui>0 ð4Þ
As noted earlier, the error term is composed of a sum of normally distributed disturbance (vi) which accounts for measurement and specification error and a one-sided dis-turbance (ui) which measures inefficiency. Both vi and ui are assumed to be independent and identically distributed across observations. An exponential assumption [ui~ε(δu)] proposed by Meensen and VanBroeck [15], was made about the distribution of the inefficiency term [16].
The estimation of the stochastic frontier (SF) requires a functional form of the production function. Two speci-fications are popular in the literature; the Cobb-Douglas (CD) and Tanslog functional forms. We specify the CD production function in this study as
yi¼βlαikπiqiθ; αþπþθ¼1 ð5Þ
All inputs are as defined in Eq. (1) above.α,πandθare parameters to be estimated. Equation (5) can be linearized to generate a linear production function as follows;
lnyi¼ lnβ0þαlnliþπkiþθqiþεi ð6Þ
Whereεiis an error term that can be decomposed into
a normal white noise error term and an inefficiency term. The Translog form of the above production function can be specified as
lnyi¼ lnβ0þαlnliþπkiþθqi
þ0:5 α1ln2liþπ1ln2kiþθ1ln2qi
þ0:5½α2lnlilnkiþα3lnlilnqiþα4lnqilnki þεi
ð7Þ
We estimated both the CD and Translog production functions. To decide on which specification is appropriate, we used the likelihood ratio test. The test was conducted on the null hypothesis that the multiplicative terms in the Translog function are simultaneously equal to zero. Results of the likelihood ratio test (LR Chi2 = 7.26;p-value = 0.7011)
suggests that the CD function is favorable relative to the Translog function. The lack of statistical significance (high
p-value) indicates that we fail to reject the null hypothesis. This implies that the CD functional form is sufficient for our analysis. We, however, reported results from the Trans-log specification as a Additional file 1.
The choice of SFA over the data envelopment analysis (DEA) was motivated by its flexibility to allow control var-iables aside the direct inputs. Further, while the DEA is the most used in the estimation of health system efficiency among the two models, it is weak in the sense that it is ex-tremely sensitive to the presence of outliers, which define the frontier. Its nonparametric nature also implies that it is unable to address random variations in the data which are then captured as inefficiency. While the SFA addresses these weaknesses, it is also limited in the imposition of some functional form on the production function which, in some cases, become difficult to estimate [17–20]. As discussed earlier, we minimize this weakness in the SFA by statistically deciding which functional form is appropri-ate for this study.
Choice of inputs and outputs
The choice of inputs and outputs was mainly based on availability of data. A search of the literature suggested many variables considered to be standard measures of fa-cility inputs and outputs. Following these, the current study used the following variables in measuring inputs and outputs at the primary health facilities.
Output variable:Number of outpatient visits was used as the output variable of interest. This is because most health centers in Ghana only provide outpatient services. Inpatient services are mostly not available at this level of health care.
Input variable: The main input variables used in the efficiency estimation include number of personnel, hos-pital beds and expenditure on other cahos-pital items and administration. Other control variables used include rural/urban location, public/private facility type, age of facility, display of fee list and number of rooms available.
Computing efficiency gain
The potential gains from efficiency was computed by finding the proportion of a facility’s revenues (Ri) that
could be saved if efficiency was improved. This is pre-sented in Eq. (2) as the proportion of facility revenue that is lost to inefficiency.
revi¼ effmax−effi
Ri ð8Þ
where revi represents revenue of the ith facility that
could be gained if inefficiencies were corrected,effmaxis
actual efficiency score of the ith facility, predicted from the SFA specification above.
The potential savings in total facility revenue (revi)
also shows the potential fiscal space for health available for theithfacility if efficiency were improved.
Nopo matching decomposition
Disparities in efficiency between public and private facil-ities was estimated using the Nopo matching decompos-ition approach. The Nopo procedure even, though similar to the famous Oaxaca-Blinder approach, is considered to be better for two main reasons. One is that it is fully para-metric and in the case of the current study it requires a linear regression model for efficiency. Secondly, it does not restrict comparison to facilities with comparable char-acteristics, i.e. it ignores the common support problem.
The Nopo decomposition approach uses an algorithm to match a public facility with a similar private facility at the primary level. This implies that the facility type be-comes the treatment variable in this decomposition ana-lysis. Four steps were followed to complete the procedure.1These are outlined below;
1. Select one public facility without replacement from the sample
2. Now select all private facilities that have similar characteristics as the public facility selected in step 1 3. Construct a synthetic facility from all the facilities
from step 2 whose characteristics are equal to average of all of them and match it to the facility in step 1. 4. Put the observations of both facilities (the synthetic
private and the public facility) in their respective new samples of matched facilities
5. Repeat steps 1 through 4 until it exhausts the original public facility sample
Following this characterization, the disparities in efficiency between the matched public and private fa-cilities was then computed. This total gap (Δ) was further disaggregated into four components as de-scribed below
Δ0= This is the part of the efficiency gap that cannot
be explained by differences in facility characteristics. This is also considered to be the residual part of the decomposition.
Δpu= This component explains the disparities between
public facilities that are matched and those that are unmatched
Δpr= Similarly, this component shows differences
be-tween matched private facilities and unmatched private facilities
Δx= This component shows that part of the efficiency
gap between private and public facilities that can be ex-plained endogenously (differences in covariates).
Results
Descriptive statistics
Table 1 presents descriptive statistics of variables (including inputs and outputs) used in the analysis. The averages, standard deviation (Std. Dev.), minimum (Min) and max-imum (Max) values were computed and reported. The sta-tistics show that average total annual facility expenditure in 2011 was GH 94,619.40 (US$63079.60) with minimum and maximum values of GH 12,709.96 (US$8473.31) and GH 613,378.40 (US$408,918.93), respectively.
On average, there was about 20 personnel in a facility with minimum and maximum values of 6 and 118, re-spectively. Average annual facility revenue in 2011 was also computed to be GH₵29,833.54 (US$19,889.03) with minimum and maximum values of GH 250.0 (US$166.67) and GH 24,4412.5 (US$162,941.67), re-spectively. Average outpatient visits across facilities was 3311 with minimum and maximum values of 5.00 and 21,900.00.
Stochastic production frontier
Table 2 shows the estimated production frontier for the facilities included in the analysis. Two different models were estimated. Model 1 included basic inputs while Model 2 included other variables that could indirectly in-fluence productivity. The estimated parameters are gener-ally reasonable for both models. An important component of the production function is to determine the presence of inefficiency among the decision-making units (DMUs). This is observable from the value and significance of lambda (λ). In Table 2, the value ofλ is higher (1.70) in Model 2 compared to 1.64 in Model 1. This shows the presence of inefficiency in the estimated production func-tion. The variance, which is decomposed into σu
(ineffi-ciency term) and σv (normal error term), shows that the
inefficiency term dominates the variance. However, effi-ciency estimates were predicted from Model 2 due to its higher value for lambda.
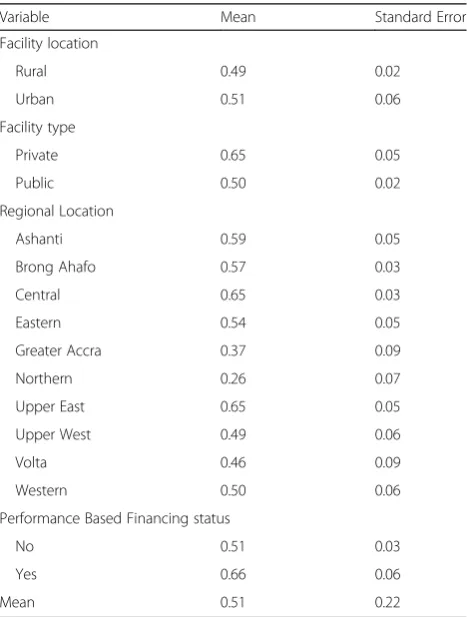
Efficiency estimates
with the Northern and Greater Accra regions being the worst efficiency performers. The Brong Ahafo, Ashanti and Central regions were among the best performers. Expectedly, facilities on the performance based financing (PBF) scheme were more efficient than their counter-parts off the scheme.
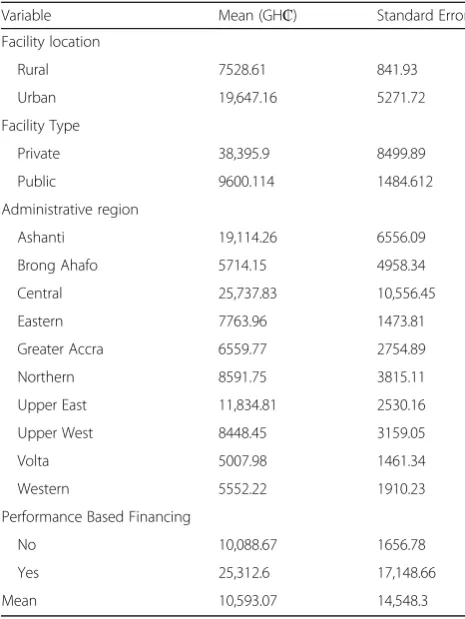
Potential saving from efficiency
In Table 4, averages of potential savings from improved effi-ciency were computed and reported across various facility characteristics. The potential savings shows each facility’s deviation from the optimal efficiency level (1.00 in this case). These deviations are then used to compute propor-tions of revenue that is not realized (or lost) due to such in-efficiencies. The estimates show that, on average, health
[image:5.595.57.543.98.240.2]centers could save about GH 10,593.07 (US$7062.05) per annum. These could serve as additional fiscal space from within the available resource envelope. Based on facility characteristics, the result shows that, relative to their rural counterparts, urban facilities could save higher proportions of their available resource envelope from improved effi-ciency. Private facilities also have higher fiscal space com-pared to their public counterparts. Further disparities were identified for various regions and affiliation to the perform-ance based financing scheme in Ghana.
Table 1Descriptive statistics
Variable Observation Mean Std. Dev. Min Max
Total facility expenditure (GH₵) 87 94,619.4 99,998.86 12,709.96 613,378.40
Total number of personnel at facility 87 20.29 17.16 6.00 118.00
Total revenue (GH₵) 85 29,833.54 44,130.29 250.00 244,412.50
Total facility beds 87 4.03 3.71 1.00 15.00
Neonatal deaths 47 0.11 0.48 0.00 3.00
Maternal deaths 47 0.06 0.44 0.00 3.00
Outpatient visits 87 3311.81 3917.55 5.00 21,900.00
Years 87 13.06 13.66 1.00 65.00
Outpatient examination rooms 87 1.29 0.69 0.00 4.00
Source: Authors’computation
All statistics are for the year 2011. Exchange rate in 2011 was US$1.00 = GH 1.50
Table 2Estimated Stochastic Production Frontier
Variables Model 1 Model 2
Labour 0.40294*** 0.38433***
(0.14137) (0.14463)
Number of beds 0.59457*** 0.47060***
(0.13958) (0.14395)
Facility age 0.14165
(0.11878)
Number of rooms 0.43615
(0.26747)
Constant 6.68721*** 6.47968***
(0.35257) (0.35501)
σu 1.02468*** 1.01691***
(0.17372) (0.16833)
σv 0.62598*** 0.59631***
(0.10402) (0.09954)
Λ 1.63693*** 1.70535***
(0.23981) (0.23026)
Source: Authors’computation
[image:5.595.305.539.414.723.2]*** significance at 1, 5 and 10% respectively. Standard errors are in parenthesis
Table 3Mean of efficiency scores by facility characteristics
Variable Mean Standard Error
Facility location
Rural 0.49 0.02
Urban 0.51 0.06
Facility type
Private 0.65 0.05
Public 0.50 0.02
Regional Location
Ashanti 0.59 0.05
Brong Ahafo 0.57 0.03
Central 0.65 0.03
Eastern 0.54 0.05
Greater Accra 0.37 0.09
Northern 0.26 0.07
Upper East 0.65 0.05
Upper West 0.49 0.06
Volta 0.46 0.09
Western 0.50 0.06
Performance Based Financing status
No 0.51 0.03
Yes 0.66 0.06
Mean 0.51 0.22
[image:5.595.57.294.476.716.2]Public-private efficiency disparities
Further analysis was conducted to estimate the efficiency differences between public and private facilities. We sought to answer two questions here: (i) what is the extent of the gap between private and public facilities and (ii) what ex-plains the efficiency gap between these facility types? A positive (negative) gap indicates that, on average, public fa-cilities are worse-off (better-off) than private fafa-cilities. The estimates show that private facilities were about 44% (Δ= 0.442) more efficient that public facilities (Table 5).
A decomposition of this efficiency gap after matching the facilities on region, age of facility, number of trainings organized for staff, PBF status and location, reveals that
−26.2% (Δpu=−14.6% andΔpr=−11.6%) is accounted for
by differences in support. The common support ensures that analysis is conducted only on facilities with compar-able characteristics. The negative value indicates that there are more public facilities that could not be matched to pri-vate facilities with comparable characteristics. This part of the gap explains the difference between public facilities that are matched with their private counterparts and those public facilities that remain unmatched. This implies that this gap will be eliminated if all public facilities were matched with private facilities. We also found that the effi-ciency gap is explained by factors beyond the matching variables (variables not included in this analysis) with
Δx= 0.00% andΔ0= 70.4%.
Discussion
In general, the findings of the study suggest that there is potential for additional fiscal space to be created through improved efficiency. This supports the theoretical propos-ition that improved efficiency is an essential source of fis-cal space for the health sector [21]. The findings also support some empirical evidence that have showed that significant inefficiencies across health systems in develop-ing countries have increased potential efficiency gains and resource savings [22]. Novignon and Nonvignon [23] found that at the macro level, average potential savings in health expenditure from improved efficiency ranged be-tween 8.1 and 2.2% of Gross Domestic Product. Other au-thors like Belay and Tandon [24] and Okwero et al. [25] provided evidence to show that improved efficiency in the health sector is as important as increasing resources to the health sector.
The findings of the study also contribute to recent de-bates about improving primary health care and treating it as the gateway to the health sector. Several authors have ar-gued that a fundamental reform of health systems in several developing countries should include improving service de-livery at the primary level [2, 3]. This will also require in-creasing resource commitments to the lowest levels of the health system. This study provides evidence to show that improving efficiency and hence, saving resource wastages, should be a core part of primary health care reforms.
[image:6.595.56.289.109.419.2]The foregoing discussions call for relevant policies tar-geted at ensuring that health sector resources, particularly at the primary level are used efficiently. Efforts in this re-gard include instituting strong and effective monitoring and evaluation mechanism at various sub-national levels. In Ghana, this may include strengthening district health moni-toring and evaluation teams. The recently introduced per-formance based financing (PBF) scheme for health facilities in the country could be another step in the right direction,
Table 4Average potential savings from efficiency by facility characteristics
Variable Mean (GH₵) Standard Error
Facility location
Rural 7528.61 841.93
Urban 19,647.16 5271.72
Facility Type
Private 38,395.9 8499.89
Public 9600.114 1484.612
Administrative region
Ashanti 19,114.26 6556.09
Brong Ahafo 5714.15 4958.34
Central 25,737.83 10,556.45
Eastern 7763.96 1473.81
Greater Accra 6559.77 2754.89
Northern 8591.75 3815.11
Upper East 11,834.81 2530.16
Upper West 8448.45 3159.05
Volta 5007.98 1461.34
Western 5552.22 1910.23
Performance Based Financing
No 10,088.67 1656.78
Yes 25,312.6 17,148.66
Mean 10,593.07 14,548.3
Source: Authors’computation
Average exchange rate in 2011 was US$1.00 = GH 1.50
Table 5Decomposition of the public-private PHC facility efficiency gap
Coefficient
Total Gap (Δ) 0.442
Decomposition ofΔ
Δ0 0.704
Δpu −0.146
Δpr −0.116
Δx 0.000
% Public in Common Support 0.419
% Private in Common Support 0.667
[image:6.595.57.292.599.722.2]if it is effectively implemented. Indeed, the findings of the study show that health facilities that are on the PBF scheme have higher efficiency score relative to facilities not on the scheme. Zeng et al. [26] also provided evidence to confirm the relevance of PBF in health service delivery at the pri-mary level. They found that in Haiti, even modest incen-tives from PBF schemes were associated with notable growth rates in service delivery.
It is worth noting that gains from efficiency improve-ment does not increase the resource envelop like in-creased government allocations or external resources. This implies efficiency gains should not be treated as substitutes for further resource investment but rather complement to efforts by government and stakeholders to increase investment in the sector in order to improve health service delivery.
Conclusion
The study set out to estimate the level of efficiency across primary health facilities in Ghana. The study also esti-mated potential efficiency gains and examined disparities in efficiency between primary and public facilities. Data from the ABCE project was used. The SFA and Nopo de-composition procedure were employed in the analysis. The study found evidence of inefficiency across primary health facilities in Ghana. Average efficiency score was es-timated to be 0.51 which suggests an average wastage of about 0.49. Average potential resource savings was esti-mated to be GH₵10,593.07 of total facility revenue. The Nopo decomposition analysis showed there was disparities in efficiency between public and private facilities with an estimated gap of about 44%. Improving monitoring and evaluation mechanisms and employing structured finan-cing schemes such as the PBF scheme may be a step in the right direction.
Some limitations of the study are worth mentioning. First, there was limited data on variables that would have helped to further explore predictors of inefficiency across facilities. For instance, the various expenditure line items in the facilities would have been helpful but not available. Sec-ond, the study could have also benefited from some sensi-tivity analysis to understand how marginal changes in level of efficiency affects the potential gains from the fiscal space created. Such analysis would have provided answers to questions about how much more fiscal space could be gen-erated if a facility improves its efficiency by 1%, which could be addressed by future studies. Finally, the number of facil-ities and nature of variables included in the study were de-termined by data availability, which may limit the extent to which the findings of the study can be generalized.
Endnote
1
Detailed presentation of the analysis is presented in Nopo (2014) and applied in Musa (2014).
Additional file
Additional file 1:PHC supplementary file. Estimated Stochastic Production Frontier from Translog specification. This file contains results of the Translog estimation of the stochastic production frontier. The Translog specification is an alternative to the Cobb-Douglas function. Both functions were estimated and the Cobb-Douglas was preferred for this study. (DOCX 13 kb)
Acknowledgements
The authors acknowledge the African Health Economics and Policy Association for financial support. Authors further acknowledge the University of Washington’s Institute for Health Metrics and Evaluation (IHME), which collected data used for this study, as part of their Access, Bottlenecks, Cost and Equity (ABCE) project conducted in collaboration with Ghana Ministry of Health (MOH), Ghana Heath Service (GHS), and UNICEF.
Funding
The study received financial support from the African Health Economics and Policy Association (AfHEA) under its“Improving primary health care performance in Africa”project.
Availability of data and materials
The datasets used and/or analysed during the current study available from the corresponding author upon reasonable request
Authors’contributions
Both authors conceived the study. JN (1) analysed, interpreted results and drafted portions of the manuscript. JN (2) contributed to interpretation of results and drafted portions of the manuscript. Both authors reviewed and approved the final manuscript.
Competing interests
The corresponding author is an Associate Editor for BMC Health Services Research. The authors declare that they have no other competing interests.
Consent for publication
Not applicable.
Ethics approval and consent to participate
Not applicable.
Publisher’s Note
Springer Nature remains neutral with regard to jurisdictional claims in published maps and institutional affiliations.
Author details
1Department of Economics, Kwame Nkrumah University of Science and Technology, Kumasi, Ghana.2Department of Health Policy, Planning and Management, School of Public Health, University of Ghana, Legon, Ghana.
Received: 25 November 2016 Accepted: 31 May 2017
References
1. Diesfeld HJ. Health Care in Developing Countries: medical action from population- based perspective. Berlin: Springer; 1996.
2. Sharman A. A New Paradigm of Primary Health Care in Kazakhstan: Personalized, Community-based, Standardized, and Technology-driven. Central Asian J Global Health. 2014;3. doi:10.5195/cajgh.2014.186.
3. WHO. The World health report: primary health care, now more than ever. Geneva: World Health Organization; 2008.
4. Heller PS. Understanding fiscal space. Washington, DC: International Monetary Fund; 2005.
6. Jehu-Appiah C, Sekidde S, Adjuik M, Akazili J, Almeida SD, Nyonator F, et al. Ownership and technical efficiency of hospitals: evidence from Ghana using data envelopment analysis. Cost Effectiveness Resour Allocation. 2014;12:9. 7. Alhassan RK, Nketiah-Amponsah E, Akazili J, Spieker N, Arhinful DK, Rinke de
Wit TF. Efficiency of private and public primary health facilities accredited by the National Health Insurance Authority in Ghana. Cost Effectiveness Resour Allocation. 2015;13:23.
8. Marschall P, Flessa S. Efficiency of primary care in rural Burkina Faso. A two-stage DEA analysis. Heal Econ Rev. 2011;1:5.
9. Akazili J, Adjuik M, Jehu-Appiah C, Zere E. Using data envelopment analysis to measure the extent of technical efficiency of public health centres in Ghana. BMC Int Health Hum Rights. 2008;8:11.
10. Kirigia JM, Asbu EZ. Technical and scale efficiency of public community hospitals in Eritrea: an exploratory study. Heal Econ Rev. 2013;3:6. 11. Kirigia JM, Mensah OA, Mwikisa CN, Asbu EZ, Emrouznejad A, Makoudode P, et al.
Technical efficiency of zone hospitals in Benin. Afr Health Monit. 2010;12:30–9. 12. Tlotlego N, Nonvignon J, Sambo LG, Asbu EZ, Kirigia JM. Assessment of
productivity of hospitals in Botswana: a DEA application. Int Arch Med. 2010;3:27. 13. Zere E, Mbeeli T, Shangula K, Mandlhate C, Mutirua K, Tjivambi B, et al.
Technical efficiency of district hospitals: evidence from Namibia using data envelopment analysis. Cost Effectiveness Resour Allocation. 2006;4:5. 14. Danquah M, Barimah A, Ohemeng W. Efficiency measurement using a“true”
random effects and random parameter stochastic frontier models: an application to rural and community banks in Ghana. Mod Econ. 2013;4:864–70. 15. Meeusen W, van den Broeck J. Efficiency estimation from Cobb-Douglas
production function with composed errors. Int Econ Rev. 1977;18:435–44. 16. Belotti F, Daidone S, Ilardi G, Atella V. Stochastic frontier analysis using Stata.
Center for Economic and International Studies Tor Vergata Research Paper Series. 2012; 10:1–48.
17. Chirikos T, Sear A. Measuring hospital efficiency: acomparison of two approaches. Health Serv Res. 2000;34:1389–408.
18. Hollingsworth B, Wildman J. The efficiency of health production: re-estimating the WHO panel data using parametric and non-parametric approaches to provide additional information. Health Econ. 2003;12:493–504. 19. Jacobs R. Alternative methods to examine hospital efficiency: data
envelopment and stochastic frontier analysis. The University of York Center for Health Economics Discussion Paper 177. 2000.
20. Silva TC, Tabak BM, Cajueiro DO, Dias MVB. A comparison of DEA and SFA using micro-and macro-level perspectives: efficiency of Chinese local banks. Phys A Stat Mech Appl. 2017;469:216–23.
21. Heller PS. The prospects of creating‘fiscal space’for the health sector. Health Policy Plan. 2006;21:75–9.
22. Hernandez de Cos P, Moral-Benito E. Health expenditure in the OECD countries: efficiency and regulation. Bank of Spain Occasional Documents No 1107 2011. 2011.
23. Novignon J, Nonvignon J. Fiscal space for health in sub-Saharan African countries: an efficiency approach. Afr J Health Econ. 2015;4:1–11. 24. Belay T, Tandon A. Assessing fiscal space for health in Nepal. Health
Nutrition and Population Discussion Paper, World Bank 2012. 2011. 25. Okwero P, Tandon A, Sparkes S, Mclaughlin J, Hoogeveen JG. Fiscal space
for health in Uganda. World Bank Working Paper No 186. 2010. 26. Zeng W, Cros M, Wright KD, Shepard DS. Impact of performance-based
financing on primary health care services in Haiti. Health Policy Plan. 2013; 28:596–605.
• We accept pre-submission inquiries
• Our selector tool helps you to find the most relevant journal • We provide round the clock customer support
• Convenient online submission • Thorough peer review
• Inclusion in PubMed and all major indexing services • Maximum visibility for your research
Submit your manuscript at www.biomedcentral.com/submit