T E C H N I C A L N O T E
Open Access
RVD: a command-line program for ultrasensitive
rare single nucleotide variant detection using
targeted next-generation DNA resequencing
Anna Cushing
1†, Patrick Flaherty
2,4†, Erik Hopmans
3, John M Bell
3and Hanlee P Ji
1,3*Abstract
Background:Rare single nucleotide variants play an important role in genetic diversity and heterogeneity of specific human disease. For example, an individual clinical sample can harbor rare mutations at minor frequencies. Genetic diversity within an individual clinical sample is oftentimes reflected in rare mutations. Therefore, detecting rare variants prior to treatment may prove to be a useful predictor for therapeutic response. Current rare variant detection algorithms using next generation DNA sequencing are limited by inherent sequencing error rate and platform availability.
Findings:Here we describe an optimized implementation of a rare variant detection algorithm called RVD for use in targeted gene resequencing. RVD is available both as a command-line program and for use in MATLAB and estimates context-specific error using a beta-binomial model to call variants with minor allele frequency (MAF) as low as 0.1%. We show that RVD accepts standard BAM formatted sequence files. We tested RVD analysis on multiple Illumina sequencing platforms, among the most widely used DNA sequencing platforms.
Conclusions:RVD meets a growing need for highly sensitive and specific tools for variant detection. To
demonstrate the usefulness of RVD, we carried out a thorough analysis of the software’s performance on synthetic and clinical virus samples sequenced on both an Illumina GAIIx and a MiSeq. We expect RVD can improve understanding the genetics and treatment of common viral diseases including influenza. RVD is available at the following URL:http://dna-discovery.stanford.edu/software/rvd/.
Keywords:Next-generation sequencing, Rare variant detection, Genotyping
Background
Next generation sequencing (NGS) is currently used in a research setting to discover novel mutations in cancer, viral, and environmental samples. As the cost of sequen-cing decreases, this technology is increasingly used to assess genetic diversity both for basic research as well as translational applications in human diseases. Citing an example of a clinical application, rare variants occurring in pathogens such as viruses or cancer may lead to thera-peutic resistance. However, to ensure that causative
mutations do not evade detection in such a clinical set-ting, we must improve the resolution, sensitivity and spe-cificity of available algorithms to detect such mutations. We present a computational tool to detect very rare muta-tions in targeted clinical samples, available for use with multiple next-generation sequencing technologies.
The detection level of current algorithms is limited by the inherent error rate in next generation sequencing technologies, generally quoted as 1-3% [1,2] or 0.25% in [3]. CRISP [4] reports to detect variants in large pooled data sets at 2% MAF on an Illumina GA platform but with only 86.3% sensitivity and 97% specificity. SPLINTER [5], a recent improvement on SNPSeeker, reliably detects mutations at 0.1% MAF using large deviation theory but requires both a positive and negative control. SNVer [6] outputs significance p-values for the likelihood of a variant * Correspondence:[email protected]
†Equal contributors
1
Division of Oncology, Department of Medicine, Stanford University School of Medicine, Stanford, CA 94305, USA
3
Stanford Genome Technology Center, Stanford University, Palo Alto, CA 94304, USA
Full list of author information is available at the end of the article
site-specific error. Mild et al. [7] reproducibly detects vari-ants in HIV with MAF as low as 0.27% but is limited by its application on a 454 FLX Platform. By significantly changing the sample preparation technique, Schmitt et al. report a resolution of 1x10⁻⁹[8].
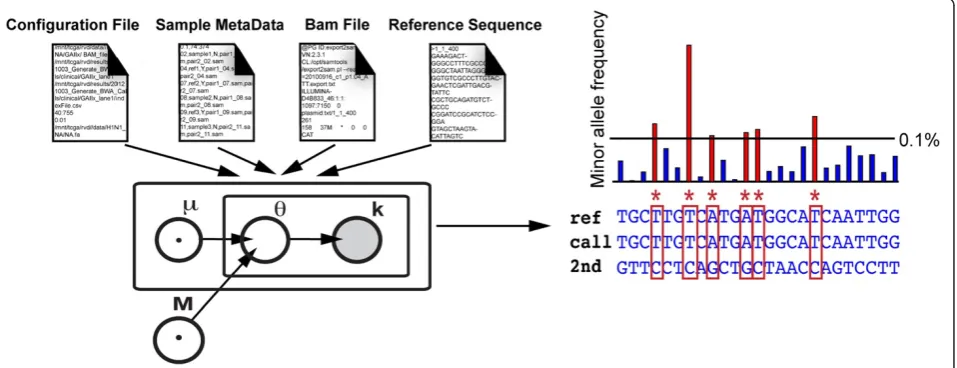
Recently, we demonstrated an algorithm for detecting very rare mutations in clinical samples from targeted next-generation sequencing data [3]. The implementa-tion of the original method required access to MATLAB as well as extensive preprocessing to convert the data to a usable format. Also, we used filtering that allowed no more than two mismatches between each read and the reference sequence, thus limiting the usefulness of the algorithm for longer-read (>50 base pair) data sets. Here, we provide an implementation that operates directly on BAM formatted data files and is available as a command line program. This program outputs a simple table of called variants in one computational step (Figure 1). We also increase the usefulness of our method for sequence data of longer read length by implementing filtering of sequence data on base quality score rather than on num-ber of sequence mismatches. We demonstrate our algo-rithm on samples sequences in multiple lanes of the Illumina GAIIx platform and on samples sequenced on the Illumina MiSeq platform.
Implementation
RVD is available as a command-line program for the Unix platform and requires only access to samtools and
the MATLAB compiler runtime (MCR), a free utility provided with the application package. RVD users prepare a configuration information file containing the region of interest, resolution and base quality thresholds, and reference sequence information as well as a sample meta-data file containing sample information. The RVD program package is available at http://dna-discovery. stanford.edu/software/rvd/ and a detailed user guide is provided in Additional file 1. RVD implements the following basic steps.
Generate depth tables from user input BAM files
RVD sorts BAM files and converts them to samtools pileup format files. The pileup files are then used to generate depth tables containing base-specific coverage at each position in the sequence. Phred scores are calcu-lated for each base from the pileup file base quality scores using the ASCII offset appropriate for the data set (33 as default or may be set manually as an optional parameter by user). Unmapped reads are removed and the remaining reads are filtered to remove alignments below a user-defined quality threshold.
Estimate site-specific reference error distribution
[image:2.595.61.540.452.636.2]RVD estimates the context-specific error rate based on the number of non-reference reads in each of the sequenced reference samples. A beta-binomial model is used to calculate a reference error rate distribution for each position in the sequence. One of the parameters of
this model, M0, is used to estimate the experimental pre-cision of sample preparation. Experimental prepre-cision, and thus performance of the algorithm, can be maxi-mized if the same preparation techniques, batch of reagents, and sample sequencing flow cell are used to prepare and sequence the reference and the samples (see Sample Preparation Requirements).
Test samples on reference error rate
RVD compares site-specific sample error rates to the estimated reference error distributions using a p-value of 1x10⁻⁶to call variants.
Call variants to output
RVD filters calls based on the resolution threshold and outputs a simple call table for the region of interest of each sample. RVD also outputs a single text file containing information about the sequencing process error calculated during analysis.
Methods for sample preparation
To test the effectiveness of our rare variant detection method in clinical applications, we applied it to both the synthetic and clinical data sets reported in [3]. The syn-thetic DNA samples consisted of ~400 base-pair long reference and sample sequences that were synthesized in-vitro. The sample construct contained 14 single nucleotide changes at known positions compared to the reference. The sample and reference DNA were com-bined at known molar fractions: 0%, 0.1%, 0.3%, 1%, 10%, and 100% and sequenced in triplicate on the Illumina GAIIx to determine the accuracy of the method.
Twelve clinical samples were obtained from
nasopharynegeal swabs of patients infected with H1N1 in-fluenza and sequenced alongside three H1N1 neuraminid-ase reference replicates. To test the applicability of our method to novel technologies, we sequenced the same clinical libraries on a MiSeq platform. We sequenced one clinical sample (BN1) in replicate in multiplex with each platform and between platforms, allowing us to compare intra- and inter-platform reproducibility.
Sample preparation requirements
The algorithm is designed to account for sequencing variation by repeated observation of the reference se-quence. Consequently, it is important to control the protocols of sample storage and preparation for both the samples of interest and the reference samples. In par-ticular, we recommend identical extraction and storage of nucleic acids [9], starting amounts of nucleic acids, library preparation and PCR protocols [10]. To achieve the optimal detection threshold for variants, we also find that the sample and reference should be sequenced on
the same flow cell, though this requirement is not mandatory (see Table 1).
Results and discussion Setting the resolution threshold
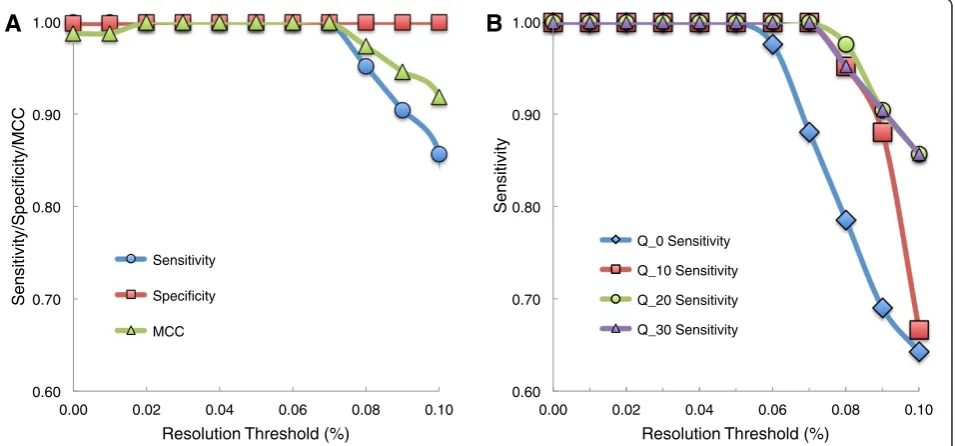
By testing a range of resolution thresholds, we find that an optimal threshold to jointly maximize sensitivity and specificity is ½ of the desired MAF detection level. Flaherty et al. reported 98% specificity and 100% sensi-tivity on the 0.1% synthetic mixture in the previous version of this algorithm [3]. We tested dependence of specificity and sensitivity on resolution threshold by computing an average specificity and sensitivity across the three synthetic DNA replicates using a base quality threshold of 30. We find the sensitivity decreases from 100% to 85.7% and specificity increases from 99.9% to 100% as the resolution threshold is increased from 0.01% to 0.1% (Figure 2A).
We repeated the resolution threshold scan for the 0.3%, 1%, 10%, and 100% synthetic mixtures and find that the optimal resolution threshold for all mixtures is consistently half of the MAF (Additional file 2: Figure S1). For example, to optimally detect a MAF of 1%, a resolution threshold of 0.5% should be used. If the ob-jective is only to maximize specificity, a higher threshold should be used. If the objective is only to maximize sensitivity, a lower threshold should be used.
Setting the base quality threshold
The base quality threshold and resolution threshold can be adjusted to optimize the performance of the algo-rithm (Figure 2B). Increasing the base quality threshold had no effect on sensitivity at low (<0.05%) resolution thresholds. However, at a higher (0.1%) resolution threshold, increasing the base quality threshold from 0 to 30 drastically increases the sensitivity of the algorithm from 64% to 86%. Thus, as base quality threshold increases, RVD sensitivity becomes less dependent on the resolution threshold.
[image:3.595.306.538.644.700.2]Changing the base quality threshold does not signifi-cantly change the specificity of the algorithm. A base quality threshold of 30 provides the best performance
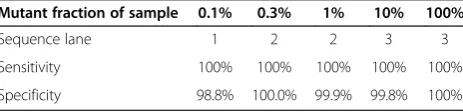
Table 1 Detecting rare synthetic variants across multiple lanes
Mutant fraction of sample 0.1% 0.3% 1% 10% 100%
Sequence lane 1 2 2 3 3
Sensitivity 100% 100% 100% 100% 100%
Specificity 98.8% 100.0% 99.9% 99.8% 100%
with specificity of 99.9% at a 0.01% resolution threshold and 100% specificity for all resolution thresholds greater than 0.01%. The lowest specificity, 99.0%, occurs at a base quality threshold of 10 and no resolution threshold. Because this decrease in specificity between base quality thresholds of 10 and 30 is not significant, the choice of
base quality threshold will likely not affect the overall specificity of RVD.
As the base quality threshold is increased from 0 to 30, the average reference error rate in the synthetic samples is reduced from 0.26% to 0.02%. Further, the maximum base quality in the synthetic data set is 38
0.60 0.70 0.80 0.90 1.00
0.00 0.02 0.04 0.06 0.08 0.10
Sensitivity
Resolution Threshold (%)
Q_0 Sensitivity Q_10 Sensitivity Q_20 Sensitivity Q_30 Sensitivity
0.60 0.70 0.80 0.90 1.00
0.00 0.02 0.04 0.06 0.08 0.10
Sensitivity/Specificity/MCC
Resolution Threshold (%)
Sensitivity
Specificity
MCC
[image:4.595.62.540.91.314.2]A
B
Figure 2Measuring sensitivity, specificity, and Matthews correlation coefficient (MCC) for optimal choice of resolution threshold and base quality threshold.Analysis was done averaging sensitivity, specificity, and MCC across three 0.1% synthetic mixture DNA replicates sequenced on a GAIIx platform.(A)With a base quality threshold of 30, the specificity increases slightly from 0.999 to 1 as the resolution threshold is increased from 0.01% to 0.1%. More drastically, the sensitivity decreases at a threshold greater than 0.05% from near 1 to 0.857 at 0.1%. The MCC statistic that combines these two measures and adjusts for unequal distribution of true positives and true negatives peaks a range of 0.02% - 0.07%, indicating an optimal resolution threshold.(B)As the base quality threshold is increased from 0 to 30, RVD sensitivity becomes less dependent on resolution threshold. Thus, a higher base quality threshold may improve resolution of the algorithm.
0.00 0.10 0.20 0.30 0.40 0.50 0.60 0.70 0.80 0.90 1.00
0.00 0.01 0.02 0.03 0.04 0.05 0.06 0.07 0.08 0.09 0.10
Sensitivity/Specificity
Resolution Threshold (%) Sensitivity
Specificity
[image:4.595.58.540.500.665.2]compared to 41 in the clinical GAIIx and MiSeq se-quence samples. This variation in base quality between runs suggests the optimal base quality threshold may be run-dependent.
Sequencing reference and sample in different lanes
Sequencing the reference and sample in different lanes has little effect on the resolution of the method. We sequenced the reference in lane 1 in multiplex with the 0.1% synthetic mixture while the 0.3% and 1% mixtures were sequenced in lane 2 and the 10% and 100% mix-tures were sequenced in lane 3. We find that for variants with 0.3% MAF and above, sequencing the reference in a different lane still allows for high sensitivity and specifi-city (Table 1). Thus, users can maximize capaspecifi-city by sequencing the reference replicates in only one lane while sequencing multiple lanes of clinical samples, with a moderate decrease in resolution.
Comparison of calls on MiSeq and GAIIx platform
When identical clinical libraries were sequenced on the Illumina MiSeq and GAIIx platforms, RVD was able to detect many rare (<1%) mutations that were called on the GAIIx (Additional file 2: Figures S2 S3). There was an increase in the site-specific standard deviation (0.005% vs 0.09%) but a slightly lower average error rate (0.055% vs 0.05%) in the MiSeq data at a base quality threshold of 30. The MiSeq run generated 9.5x10637 bp aligned single-end reads for an average coverage of 11,723 across the data set with average sample-specific coverage ranging from 1,854 to 34,976 reads. The GAIIx, comparatively, produced an average coverage of 103,130 with sample-specific coverage ranging from 13,535 to 341,523 reads.
We identified a set of concordant variants as those variants that were called similarly on all four GAIIx BN1 replicates (two each in lane 1 and 2). This set was used to estimate sensitivity and specificity of MiSeq calls. The sensitivity is 57.1% and the specificity is 99.5% with a quality score threshold of 30 and no resolution threshold (Figure 3).
There was a 58.2% concordance of BN1 variant calls within the MiSeq platform compared with 79.1% con-cordance within the GAIIx with no minimum resolution threshold and a quality score threshold of 30. We find a 42.5% concordance between BN1 variants called with consensus on the GAIIx and those called with consensus on the MiSeq. Lower levels of concordance and sensitiv-ity may be due to the fact that this data was collected on an early iteration of the MiSeq platform with shorter reads and lower average qualities than newer MiSeq data. In addition, this early Miseq run had 10-fold lower depth of coverage compared to the GAIIx.
Conclusions
We provide here a tool for identifying rare mutations directly from targeted resequencing data sets. The im-proved resolution to detect rare mutations using this tool can aid in our understanding of the relationship between rare, novel mutations that occur in samples demonstrating genetic heterogeneity. For example, this genetic diversity is seen in infectious viruses such as HIV and HCV. In the future, we plan to investigate RVD’s statistical power using lower depth (<10,000) samples for use on longer genomic regions. These next steps will allow us to apply RVD’s high sensitivity and specificity to improve understanding of rare mutations in cancer genes and the complex genetics involved in cancer tumor evolution.
Availability and requirements Project name: RVD
Project home page: http://dna-discovery.stanford.edu/ software/rvd/
Operating system(s): Linux, Mac OS X Programming Language(s): MATLAB
Other requirements: Samtools 0.1.18, MATLAB com-piler runtime version 7.17 (provided in the program package), x11
License:
Any restrictions to use by non-academics: None
Additional files
Additional file 1:Containing a detailed user guide explaining how to download and run the RVD program.
Additional file 2:Containing supplementary figures.
Abbreviations
MAF:Minor allelic fraction; BAM: Binary alignment map; HIV: Human immunodeficiency virus; HCV: Hepatitis C virus.
Competing interests
The authors declare they have no competing interests.
Authors’contributions
PF and AC drafted the manuscript and performed statistical analysis of the program. PF designed and wrote the software algorithm. AC participated in writing the software and wrote the user guide. EH carried out the sequencing and sample preparation. JMB participated in the sequence alignment. HJ came up with the project and participated in its design, coordinated and oversaw the project, and helped draft the manuscript. All authors read and approved the final manuscript.
Acknowledgements
Author details
1
Division of Oncology, Department of Medicine, Stanford University School of Medicine, Stanford, CA 94305, USA.2Department of Biochemistry, Stanford
University School of Medicine, Stanford, CA 94305, USA.3Stanford Genome Technology Center, Stanford University, Palo Alto, CA 94304, USA.
4
Department of Biomedical Engineering, Worcester Polytechnic Institute, Worcester, MA 01605, USA.
Received: 17 December 2012 Accepted: 16 May 2013 Published: 23 May 2013
References
1. Fernald GH, Capriotti E, Daneshjou R, Karczewski KJ, Altman RB:
Bioinformatics challenges for personalized medicine.Bioinformatics2011,
27:1741–1748.
2. Shendure J, Ji HP:Next-generation DNA sequencing.Nat Biotechnol2008,
26:1135–1145.
3. Flaherty P, Natsoulis G, Muralidharan O, Winters M, Buenrostro J, Bell J, Brown S, Holodniy M, Zhang N, Ji HP:Ultrasensitive detection of rare mutations using next-generation targeted resequencing.Nucleic Acids Res 2012,40:e2.
4. Bansal V:A statistical method for the detection of variants from next-generation resequencing of DNA pools.Bioinformatics2010,26:i318–i324. 5. Vallania FL, Druley TE, Ramos E, Wang J, Borecki I, Province M, Mitra RD:
High-throughput discovery of rare insertions and deletions in large cohorts.Genome Res2012,20:1711–1718.
6. Wei Z, Wang W, Hu P, Lyon G, Hakonarson H:SNVer: A statistical tool for variant caling in analysis of pooled or individual next-generation sequencing data.Nuclei Acids Res2011,39:e132.
7. Mild M, Hedskog C, Jernberg J, Albert J:Performance of ultra-deep pyrosequencing in analysis of HIV-1 pol gene variation.PLoS One2011,
6:e22741.
8. Schmitt M, Kennedy S, Salk J, Fox E, Hiatt J, Loeb L:Detection of ultra-rare mutations of next-generation sequencing.PNAS2012,
109(36):14508–14513.
9. Duncan B, Miller J:Mutagenic deamination of cytosine residues in DNA.
Nature1980,287:560–561.
10. Tindall K, Kunzel T:Fidelity of DNA synthesis by the thermus aquaticus DNA polymerase.Biochemistry1988,27(16):6008–6013.
doi:10.1186/1756-0500-6-206
Cite this article as:Cushinget al.:RVD: a command-line program for ultrasensitive rare single nucleotide variant detection using targeted next-generation DNA resequencing.BMC Research Notes20136:206.
Submit your next manuscript to BioMed Central and take full advantage of:
• Convenient online submission
• Thorough peer review
• No space constraints or color figure charges
• Immediate publication on acceptance
• Inclusion in PubMed, CAS, Scopus and Google Scholar
• Research which is freely available for redistribution