Open Access
Research article
Use of comparative data for integrated cancer services
Dawn L Wilkinson and Mark McCarthy*
Address: Department of Epidemiology and Public Health, University College London, UK
Email: Dawn L Wilkinson - [email protected]; Mark McCarthy* - [email protected] * Corresponding author
Abstract
Background: Comparative data are an important resource for management of integrated care. In 2001, the English Department of Health created 34 cancer networks, broadly serving populations of half to three million people, to coordinate cancer services across providers. We have investigated how national and regional routine data are used by the cancer network management teams.
Methods: Telephone interviews using a standardised semi-structured questionnaire were conducted with 68 participants in 29 cancer network teams. Replies were analysed both quantitatively and qualitatively.
Results: While most network teams had a formal information strategy, data were used ad hoc more than regularly, and were not thought to be as influential in network decision making as other sources of information. Data collection was more prominent in information strategies than data use. Perceptions of data usefulness were mixed and there were worries over data quality, relevance, and potential misuse. Participants were receptive to the idea of a new limited dataset collating comparative data from currently available routine data sources. Few network structural factors were associated with data use, perceptions of current data, or receptivity to a new dataset.
Conclusion: Comparative data are underused for managing integrated cancer services in England. Managers would welcome more comparative data, but also desired data to be relevant, quality assured and contextualised, and for the teams to be better resourced for data use.
Background
In England, a Cancer Plan [1] was published in 2000, set-ting out organizational developments for cancer care in the National Health Service, and creating a new system of 34 cancer networks to serve populations of between half and three million people, so as to integrate services between hospitals and community care. The networks are each managed by a team [2] including a Lead Manager, Lead Clinician, Lead Nurse, and Service Improvement Lead, along with additional Leads and managers (such as
Pharmaceutical, Research, and Information) as well as administrative staff.
A national Cancer Information Strategy was also pro-duced to accompany the Cancer Plan [3]. Among recom-mendations were that 'monitoring of performance indicators which relate to the quality of cancer services delivery, including screening, should form part of the assessment of individual cancer services.' Currently avail-able national and regional comparative data on cancer services may be a potentially important source of
informa-Published: 17 December 2007
BMC Health Services Research 2007, 7:204 doi:10.1186/1472-6963-7-204
Received: 21 May 2007 Accepted: 17 December 2007
This article is available from: http://www.biomedcentral.com/1472-6963/7/204
© 2007 Wilkinson and McCarthy; licensee BioMed Central Ltd.
tion for network teams to fulfil their role. By comparing against their own network's previous performance, the performance of other similar networks, and/or national averages and targets, such data may help the team to guide key decisions taken by senior management within the National Health Service, and internal groups (e.g. the net-work Board and Executive group).
While administrative data have been used in quality assur-ance [4] and to compare hospital performassur-ance, [5] there has been little research on the availability and use of com-parative information for management of integrated serv-ices. Previous studies have suggested that 'hard' data may not be the most useful or frequently used source of infor-mation in health services, that data may be inadequate and lacking in enough contextual detail to enable com-parison [6] and that other sources of information includ-ing expertise and personal knowledge might be more influential in decision making [7,8]. A previous qualita-tive study conducted by the authors, examining four Can-cer Networks in England, found that collection of data was of a higher priority than use of data, and locally col-lected data was of more use in management decision mak-ing than nationally aggregated data. In addition, team members perceived barriers to using data, including lim-ited accessibility, limlim-ited resources and uncertain data quality. Organizational factors such as roles and remits, relationships within and without the network, and man-agement commitment to using information as a develop-ment tool, also impacted upon the use of 'hard' data [9,10].
In the current study we sought to find out how useful cur-rently available national and regional comparative data are for management of the integrated services across all the cancer network teams in England. We investigated how the data are used and the factors that may affect data use. In addition, we wanted to assess possible reactions to providing networks with a dataset collating network rele-vant cancer information from a variety of currently avail-able routine data sources.
Methods
Cancer networks coordinate hospital and primary care services that are organizationally linked by their geo-graphical proximity to each other, and cover populations approximating to other health administration and politi-cal boundaries in England (e.g. Strategic Health Authority, Cancer Registry, and local government boundaries). The study used telephone interviews of key informants from the management teams of the cancer networks.
Sample
Following research ethics approval, we sought and received approval from 30 of the 34 network Board
Chairs. Twenty nine network teams finally participated in the survey, resulting in 68 individual responses. Reasons were not given by the five network teams for non-partici-pation. Lead Managers, Lead Clinicians and Information/ Data Leads were initially approached to be surveyed. In six networks, we were advised (usually by the Lead Manager) to survey 'Other' network team roles including two Service Improvement Leads, a development Manager, a Sector Performance Manager, and a Macmillan Information Lead (for palliative care services). These 'other' roles were usually responsible for network analysis of regional and national comparative data in addition to, or absence of, a Network Information and Data Lead; responses from 'Others' were therefore combined with Information/Data Lead role in the analyses. Seven networks had no Informa-tion/Data Lead and no other designated role for looking at data. Two networks had a combined Lead Clinician/ Lead Manager (whom we classified as Lead Managers). Full interviews were held with 26 Lead Managers, 18 Lead Clinicians and 24 Information/Data Leads/Others. Three people were interviewed from 14 network teams, two peo-ple were interviewed in 11 network teams, and one person was interviewed in four teams.
Participating networks included rural as well as urban set-tings, and between three and twelve hospital groups and associated community care services. All had a network board including chairman (usually a hospital or commu-nity service chief executive), a core network team (includ-ing Lead Manager, Lead Clinician, Lead Nurse and Service Improvement Lead), executive representatives from each primary, secondary and tertiary care organisation in the network, a representative from the local health authority, a service user (patient or carer) representative, and a mem-ber of the voluntary sector. In addition, some network boards included Lead Cancer Clinicians from primary and secondary/tertiary care providers, a public health repre-sentative, a human resource reprerepre-sentative, medical school/university representative, financial advisors, and a member of the regional Cancer Registry.
Procedure
The questionnaire asked about the use of seven data sets available in England, including Cancer Waiting Times, Cancer Registry, Hospital Episodes Statistics, Cancer Standards Peer Review, National Cancer Patient Survey, Healthcare Commission Acute Hospital Portfolio, and Minimum Dataset for Palliative Care [13]. In addition, participants were encouraged to consider any other national and regional comparative data that they used or knew of.
Response options for most of the questionnaire items were yes/no or five or seven point Likert (e.g. ranging from strongly disagree to strongly agree) and semantic differen-tial response scales (e.g. ranging from useless to useful). Participants were able and encouraged to provide addi-tional feedback and comments throughout the survey (full questionnaire available on request from the first author). We also recorded some information on network structures and contexts directly from the network teams and from a national cancer data resource [14].
Qualitative responses to open ended questions were tran-scribed, ordered by question number, and examined to identify common themes. Once categorized, responses were content analysed (counting the same or similar responses) to indicate frequency of beliefs/examples across participants (i.e. in relation to: sources of data, uses of data, reasons for sharing data with the Network Board, and barriers to using data). Qualitative responses also enabled the identification of answers that had not been pre-empted in the structured questionnaire (e.g. reasons for not providing user-groups with data), and provided elaboration and anecdotal examples to complement the quantitative data (e.g. reasons for high/low receptivity to a new comparative data set). Examples and issues arising from qualitative data have been summarised in the results
and where appropriate, we present the statistical data sup-ported by participants' comments.
To summarise findings, five point and seven point response scales were divided into negative, neutral, and positive responses. Frequencies and percentages refer to individual level analysis unless stated otherwise. Data were analysed individually, by role, and aggregated (mean average response across participants) by network. Differ-ences between roles are taken to imply general level of concordance within teams, and substantial differences in opinions within teams are highlighted. Some correla-tional analyses (Pearson's r for parametric data and Spear-man's Rho for non parametric data) were conducted to identify possible relationships between data use, percep-tions of data, and organisational factors. However, as there were only 29 networks and 68 individual partici-pants, statistical power to detect an effect is weak, and gen-eral trends are mainly reported.
Results
Data use across the network teams • Extent of data recognition and use
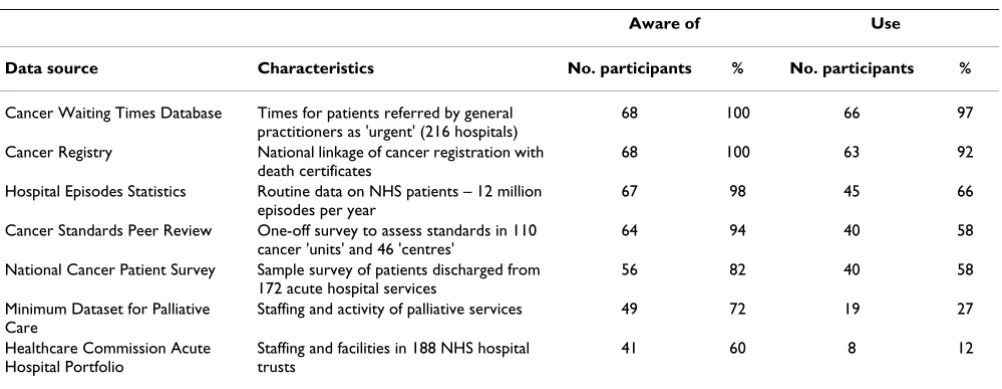
Two data sets, Cancer Waiting Times and Cancer Registry, were the data sources most often recognised and most often reported as being used by the network teams (Table 1). This was the case across all three roles.
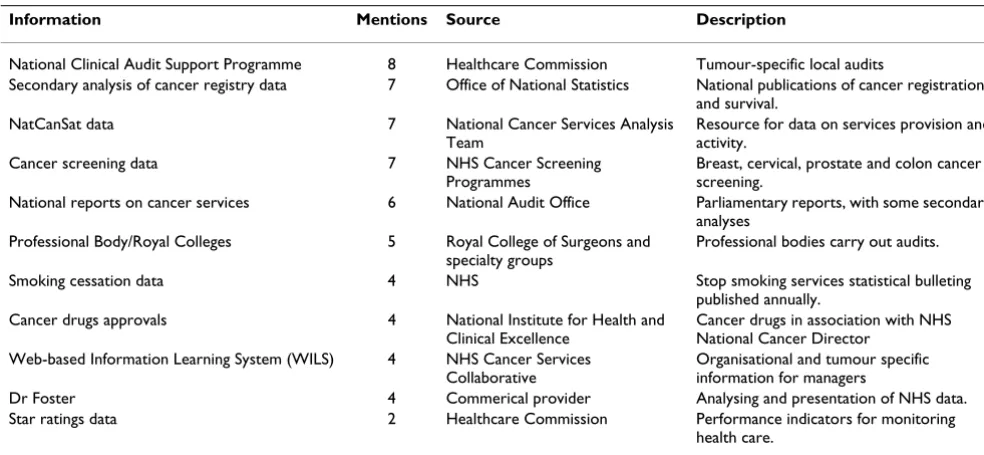
[image:3.612.57.558.549.743.2]In addition to the seven specified data sources, 60% (41/ 68) participants reported using a total of 24 other (identi-fiable) types of data that enable comparison (with national averages, and/or across hospital trusts and/or networks); 20 of these could be allocated to a single national source (rather than generic data such as clinical research/evidence-based data) and are specified in
Table 1: Study participants' awareness and use of nationally available data sources.
Aware of Use
Data source Characteristics No. participants % No. participants %
Cancer Waiting Times Database Times for patients referred by general practitioners as 'urgent' (216 hospitals)
68 100 66 97
Cancer Registry National linkage of cancer registration with death certificates
68 100 63 92
Hospital Episodes Statistics Routine data on NHS patients – 12 million episodes per year
67 98 45 66
Cancer Standards Peer Review One-off survey to assess standards in 110 cancer 'units' and 46 'centres'
64 94 40 58
National Cancer Patient Survey Sample survey of patients discharged from 172 acute hospital services
56 82 40 58
Minimum Dataset for Palliative Care
Staffing and activity of palliative services 49 72 19 27
Healthcare Commission Acute Hospital Portfolio
Staffing and facilities in 188 NHS hospital trusts
Table 2. Participants also reported using locally collected data and local health administration data.
Total use of the seven data sources was positively (although not significantly) correlated to use of self-reported additional data sources (Pearson's r = 0.31 p > 0.10) suggesting that low use of the seven data sources was not a result of dependence on other sources of data, and that those using fewer of the seven data sources, used less data generally. At the network team level (mean use across network respondents) average use was rated, on a 7 point scale, at just over 4 (s.d. = 0.90, range 2.5 to 7) data sources. Average use was higher amongst Lead Clini-cians (mean = 4.4) than either Lead Managers (mean = 4.2) or Information/Data Leads and Others (mean = 3.7).
• Strategies and routines
Over half the participants (59% 40/68) indicated that their network team had some sort of formal information strategy, although only 34% (23/68) thought it covered issues of local data collection and data use equally. Only one participant thought their strategy mainly covered data use, whilst 23% (16/68) indicated that the main focus was on data collection. There was some disagreement between respondents within teams (in 9 out of 25 (36%) network teams that had more than one participant), over whether an information strategy existed and over the focus of the strategy. A higher percentage (72%, 13/18) of Lead Clini-cians thought that the team had an information strategy than either Lead Managers (54%, 14/26) or Information/
Data Leads and Others (54%, 13/24). Despite having information strategies only 26% (18/68) participants said that they were most likely to use data routinely (as opposed to ad hoc). However, frequency of data use depended largely on the data source in question with Can-cer Waiting Times data being looked at weekly, daily and "almost hourly".
• Specific uses
Data were used by network teams for three required activ-ities [15] – implementing guidance on clinical practice in cancer services (76%, 52/68 participants indicated use), service improvement initiatives (66%, 45/68 indicated use) and to undertake a national peer review of cancer service standards (44%, 30/68 indicated use). Cancer Reg-istry data and Hospital Episodes Statistics were most fre-quently used for implementing Improving Outcomes Guidance whilst Cancer Waiting Times and Registry data were most frequently used for service improvement plans.
[image:4.612.55.547.477.704.2]Participants were also asked to think of other examples of data use. The most commonly cited general uses included planning (8 participants), providing supporting evidence (8 participants), and setting the network picture in a national context (6 participants). Frequently cited specific uses included validating and checking other data (e.g. Cancer Registry and Cancer Waiting Times) (9 partici-pants), assessing treatment trends (e.g. Hospital Episodes Statistics) (8 participants), and monitoring waiting times in order to meet targets (8 participants).
Table 2: Additional nationally available information sources used by the participants
Information Mentions Source Description
National Clinical Audit Support Programme 8 Healthcare Commission Tumour-specific local audits
Secondary analysis of cancer registry data 7 Office of National Statistics National publications of cancer registrations and survival.
NatCanSat data 7 National Cancer Services Analysis Team
Resource for data on services provision and activity.
Cancer screening data 7 NHS Cancer Screening Programmes
Breast, cervical, prostate and colon cancer screening.
National reports on cancer services 6 National Audit Office Parliamentary reports, with some secondary analyses
Professional Body/Royal Colleges 5 Royal College of Surgeons and specialty groups
Professional bodies carry out audits.
Smoking cessation data 4 NHS Stop smoking services statistical bulleting published annually.
Cancer drugs approvals 4 National Institute for Health and Clinical Excellence
Cancer drugs in association with NHS National Cancer Director
Web-based Information Learning System (WILS) 4 NHS Cancer Services Collaborative
Organisational and tumour specific information for managers
Dr Foster 4 Commerical provider Analysing and presentation of NHS data. Star ratings data 2 Healthcare Commission Performance indicators for monitoring
health care.
• Dissemination
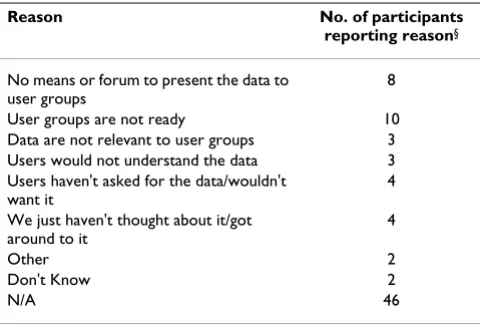
Dissemination of data to key network stakeholders, including Board members and cancer patient and carer/ user representatives, was occurring although not consist-ently within or across teams. Fifty three percent (36/68) of participants reported that their networks (but not neces-sarily network team) had provided some national and regional comparative data to patient and carer user groups in the past year with Cancer Waiting Times and Cancer Registry data being the data sources cited most frequently. Data were unlikely to be disseminated routinely but more likely in relation to specific initiatives, nationally released documents, or as and when the users asked for data. The most frequently cited reasons for not providing data to user groups were that there were currently no means or forums to feed data back, or that the user groups were still developing and deciding their own priorities (see Table 3). Reasons were similar across roles although Lead Managers were more likely than other roles to say that they had not thought about it or got around to it, whilst Lead Clinicians, Information/Data Leads and Others, more often said that users had not asked for the data and/ or would not want them anyway.
Fifty four percent of participants (37/68) noted that national and regional comparative data were discussed at Board meetings. Data were discussed to: keep board mem-bers informed; contextualise local/network data; or be set aside (as problematic). National and regional compara-tive data were seen to be less influential on average in guiding strategic decisions taken by the network/network Board, than other factors and sources of information including: relationships between decision makers; knowl-edge, experience and expertise; and locally collected data.
What factors may affect the use of national and regional comparative data?
• Perceived usefulness
We asked the participants to rank data source usefulness and found that Waiting Times and Cancer Registry data were ranked as most useful by the majority of participants. This apparently related to current network priorities and national targets:
"the Cancer Waiting Times is a big focus of our work at the moment but that reflects political priorities"
In addition, five participants noted that locally collected data were often more useful than national and regional comparative data due to their specificity and relevance.
Participants were asked to indicate whether national and regional comparative data enabled the network team to assess network quality of service. Results indicated a mixed response with 50% (34/68) indicating that the data were useful in this way. Fewer Lead Clinicians thought that the data assessed quality of service compared to Lead Managers or Information/Data Leads and Others (22% (4/18) vs 65% (17/26) and 72% (13/18) respectively). At network team level average perception (out of 5) was just over 3 (neither agree/nor disagree that currently available data enables the network team to assess network quality of service), with 15 networks scoring the midpoint or lower. Many participants questioned the extent to which currently available data enabled them to monitor the serv-ice at the level of multi-disciplinary team (groups of health professionals at the hospital trust level who are ultimately responsible for delivering services). Only 35% (24/68) said that the data were useful at this level. The most positive attitudes were among Lead Managers (46% (12/26), saying the data were useful, compared to only 28% (5/18) of Lead Clinicians and 39% (7/18) Informa-tion/Data Leads/Others respectively.
• Perceived barriers
[image:5.612.55.295.108.270.2]More than half the respondents (57%, 39/68) thought that people in their network do not generally trust the quality of available data. This figure was higher amongst Lead Clini-cians (66.7% 12/18). However, they considered that trust was increasing. Two thirds (65%, 44/68) thought that peo-ple in their network worry about how comparative data could be used, reporting worries of simplification, misin-terpretation, and suspicion that data could be used against them (e.g. to withdraw resources). Again, this was most common amongst Lead Clinicians (83% 15/18). Sixty per-cent (41/68) of participants thought that the relevance of some data is not always clear; however, one participant acknowledged that the data were relevant but said that "we
Table 3: Main reasons for data not having been disseminated to user groups
Reason No. of participants
reporting reason§
No means or forum to present the data to user groups
8
User groups are not ready 10 Data are not relevant to user groups 3 Users would not understand the data 3 Users haven't asked for the data/wouldn't
want it
4
We just haven't thought about it/got around to it
4
Other 2
Don't Know 2
N/A 46
§Reasons were given by the participants and were not fixed response
are not that clever at using some data". More Lead Clinicians thought that the data were not relevant (78% 14/18) than Lead Managers (58% 15/26) or Information/Data Leads/ Others (67% 12/18).
Rather fewer respondents thought that Government priori-ties prevented them from using data as they would like to, with just over 35% (24/68) responding "neither/nor" and the remainder divided fairly equally between agreeing and disagreeing. In response to an open question around barri-ers to data use a broader range of issues were also proposed as preventing respondents from using data as they would like to, including poor or uncertain data quality (16 partic-ipants), lack of timeliness and/or being out of date (13 par-ticipants), general distrust of the data (8 parpar-ticipants), and not being able to access data sources easily/not receiving data routinely or automatically (16 participants).
• Receptivity to new comparative data
We were particularly interested in what participants would think about being given a new set of aggregated cancer data to allow comparisons of performance across hospitals within their network and nationally. The large majority (87%, 59/68) thought such a dataset would be a good rather than bad idea: 81% (55/68) thought it could be useful for monitoring quality of service at network level, 78% (53/68) thought it could be useful for monitor-ing quality of service at hospital trust level, and 88% (60/ 68) thought that it could be useful in their role. However, only half (49%, 33/68) of participants thought that such as dataset would be welcomed by others, and only 21% (14/68) thought that the data would be trusted by clini-cians. Creating a composite measure of 'receptivity to lim-ited dataset' (mean score of all six items on perceptions of a new comparative limited dataset), the average score across network teams was 5.2 out of 7 (with 7 indicating higher receptivity), but team averages ranged from lowest 2.8 to highest 6.5.
Concerns about the dataset largely related to inadequate resources: participants expressed concerns about what such a dataset would mean in the long term and how its collection would be overseen. They also wanted to know how labour intensive it would be to analyse it:
"the amount of time it would take to produce, the amount of time spent collecting and justifying it and the amount of arguments over it would not be worth it...it would make my life [as Information/Data Lead] more difficult"
Concerns were also raised about potential misinterpreta-tion and misuse:
"it could be incredibly damaging [if not contextualised]"
Thus participants made a number of recommendations if such a dataset were to be accepted and used effectively by network teams. These included: the importance of consid-ering contextual detail; the importance of assessing, and giving assurance about, the quality of the data; and pre-senting the data as a prompt for further investigation rather than as a definitive judgment of quality.
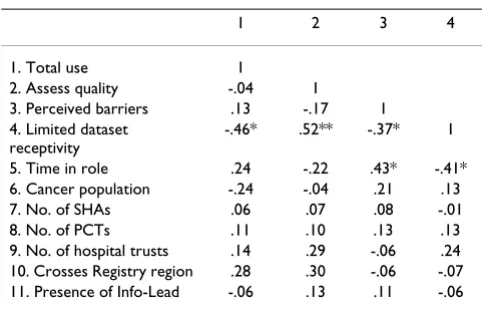
[image:6.612.313.554.569.724.2]Relationships between data use, perceptions, and network context We examined whether perceptions of usefulness in assess-ing quality, barriers to usassess-ing the data, and receptivity to a new limited dataset, were associated with the use of seven key data sources by the network team. In addition, we also examined whether data use and perceptions of data were associated with individual and organisational network factors including length of time respondent has been in their role, presence of an information lead in the network, cancer population of network area, number of Strategic Health Authorities (performance management bodies) in network, number of Primary Care Trusts covered by the network, number of Hospital Trusts covered by the net-work, and whether the network crosses Cancer Registry regional boundaries (see Table 4). We created four com-posite measures of perceptions of data sets: 'Total use' (additive score of the number of data sources used, out of 7); 'Assess quality' (mean score of answers to 'Perceptions of the usefulness of current data to assess quality of net-work service'); 'Perceived barriers' (mean score of answers to "People in this network do not trust the quality of the data" and "People in this cancer network worry about how data will be used"); and 'Receptivity to limited data-set' (mean score of all six items on perceptions of a new comparative limited dataset). Pearson's r correlations were used for normally distributed interval level data and Spearmans Rho correlations were used for non non-nor-mally distributed and ordinal level data. Associations were examined at individual and network level. Relation-ship trends and significant associations were the same at
Table 4: Network level correlations: data use, perceptions about data use, and organisational contextual factors
1 2 3 4
1. Total use 1
2. Assess quality -.04 1
3. Perceived barriers .13 -.17 1 4. Limited dataset
receptivity
-.46* .52** -.37* 1
5. Time in role .24 -.22 .43* -.41* 6. Cancer population -.24 -.04 .21 .13 7. No. of SHAs .06 .07 .08 -.01 8. No. of PCTs .11 .10 .13 .13 9. No. of hospital trusts .14 .29 -.06 .24 10. Crosses Registry region .28 .30 -.06 -.07 11. Presence of Info-Lead -.06 .13 .11 -.06
network and individual level (only network level will be reported). Small sample sizes led to few significant findings.
The composite value 'Receptivity to limited dataset' was negatively correlated with 'Total use' (rho = -0.46, p < 0.05), suggesting that the more data sources currently used by the team, the less receptive network teams are to a new dataset. It was also positively associated with 'Assess quality' (rho = 0.52 p < 0.01) and negatively associated with 'Perceived barriers' (rho = -0.37 p < 0.05) suggesting that respondents who perceive that currently available comparative data allow them to assess service quality, and perceive few barriers to using the data, are more receptive to a new dataset.
Small (although non-significant) effects were also seen for some organisational contextual factors including data use with: average length time in post (r = .24), cancer popula-tion size of the network (-.24) and the network crosses a Registry region (r = .28). No other organisational factors appeared to be related to data use. Time in post was also positively correlated with perceived barriers to using data (rho = .43 p < .05) and negatively correlated with receptiv-ity to limited dataset (rho = -.41 p < .05) (and this was par-ticularly so amongst Lead Clinicians).
Discussion
Cancer networks are an important innovation in inte-grated management of health services in England. How-ever, the information strategy for cancer [3] addressed primarily clinical and administrative data within hospi-tals and at national level, rather than promotion of inte-grated care through the cancer networks. We identified information strategies in only just over half the networks. Participants in our study were concerned about data qual-ity, and relevance to their particular areas of work. They were, however, generally receptive to new comparative data.
Use of the seven national data sets relating to cancer serv-ices that we described varied from over 90% for Cancer Waiting Times and Cancer Registry data, to less than 30% the Healthcare Commission Acute Hospital Portfolio and Minimum Data Set. Use seemed to be closely related to current national cancer services targets and directives, with networks prioritizing data relating to immediate per-formance issues on which networks could be held accountable. Similar 'tunnel vision' effects have been observed in other studies of information use, for example in performance indicators [16] and the Government's focus on waiting time targets has been found in other services to have complex, perhaps unexpected, clinical impacts [17].
Local data, individual expertise, and organisational and individual relationships were more important than com-parative data in decision making and have been shown elsewhere to be a major influence in healthcare manage-ment [7,8]. Only half the respondents thought that cur-rently available national or regional comparative data enabled them to assess the quality of service in their net-work and fewer than 40% of respondents always saw the relevance of currently available data. There needs to be more discussion between data collation agencies and those expected to use the data (e.g. managers, decision makers, policy makers) to ensure that data being collected include measures that are valuable and useful.
Our respondents were concerned about the quality of national data sets, and how data may be used. This lack of trust appeared in the interviews to be most acute amongst network clinicians. Lead Clinicians more often reported that data sets were of little use and expressed their lack of trust in them. Resistance to data use by practitioners has been well documented [7,18,19]. However, greater use of data sets can contribute to recognition of their place in NHS management, while more discussion is needed with clinicians in supporting their own information needs. Sta-tistical analysis of the responses from team members is, however, limited by the size of the samples.
Members in longer serving roles reported more use of data but also had stronger perceived barriers to using data and were less receptive to a new limited dataset. These associ-ations were greater for the Lead Clinicians. Few other organisational or network contextual factors were associ-ated with data use or perceptions, and it is possible to sup-pose that greater encouragement by government to use datasets for management would be accepted. Cancer net-works with smaller cancer populations and those crossing health care administrative boundaries tended to be more positive towards using data. Other contextual factors, for example network budgets, management ethos, and team relationships and structures might be investigated in future as determinants of information use.
Conclusion
Comparative data are underused for managing integrated cancer services in England. The priority given by cancer network managers to collection of data by services, rather than to the use of data for management, reflected the pri-orities of central government, which had set targets for completeness (especially for waiting times) rather than supporting networks in the more complex role of under-standing and interpreting available data.
Publish with BioMed Central and every scientist can read your work free of charge
"BioMed Central will be the most significant development for disseminating the results of biomedical researc h in our lifetime."
Sir Paul Nurse, Cancer Research UK
Your research papers will be:
available free of charge to the entire biomedical community
peer reviewed and published immediately upon acceptance
cited in PubMed and archived on PubMed Central
yours — you keep the copyright
Submit your manuscript here:
http://www.biomedcentral.com/info/publishing_adv.asp
BioMedcentral using data and turning it into meaningful information
and action. Increased engagement with data within the network teams may lead to increased dissemination and information sharing amongst other cancer network stake-holders. Promisingly, our results showed that network team members would be receptive to new comparative data collating information from currently available data sources, and would find it useful in their roles. There is reason to believe that such data would be used if the teams were better resourced for data management, if the data were relevant, quality assured and contextualised with network-specific information.
Competing interests
The author(s) declare that they have no competing inter-ests.
Authors' contributions
DW carried out the design of the questionnaires, inter-views, analysis of data, and writing up the paper. MM con-ceived of the study, participated in its design and coordination and contributed to writing up. Both authors read and approved the final manuscript.
Acknowledgements
We thank the cancer network teams that participated in this study and the expert advisers of the Research Team of the 'Measures of Quality in Cancer Services' study – Susan Michie, Ewan Ferlie and Rachael Addicott, Michel Coleman and Bernard Rachet, Chris Sherlaw-Johnson, and team colleagues Arturo Gonzalez-Isquierdo, Preeti Datta, Artak Khachatryan, Marina Tho-mas and Ainsley Hardy. Thanks also to the reviewers for their comments and suggested improvements of this paper. This research was commis-sioned by the National Institute for Health Research (NIHR) Service Deliv-ery and Organisation (SDO) Programme. The views expressed in this publication are those of the authors and not necessarily those of the NHS, the NIHR or the Department of Health. The NIHR SDO programme is funded by the English Department of Health.
References
1. UK Department of Health: The NHS Cancer plan: a plan for investment, a plan for reform. London, Department of Health; 2000.
2. UK Department of Health: Manual for cancer services. London, Department of Health; 2004.
3. UK Department of Health: NHS Cancer Information Strategy.
London, Department of Health; 2000.
4. Iezzoni LI: Assessing quality using administrative data. Annals of Internal Medicine 1997, 127:666-674.
5. Jarman B, Gault S, Alves B, Hider A, Dolan S, Cook A, Hurwitz B, Iez-zoni LI: Explaining differences in English hospital death rates using routinely collected data. British Medical Journal 1999,
318:1515-20.
6. Guven-Uslu P: Uses of performance metrics in clinical and managerial networks. Public Money and Management 2006,
26:95-100.
7. Mannion R, Goddard M: Impact of published clinical outcomes data: case study in NHS hospital trusts. British Medical Journal 2001, 323:260-63.
8. Marshall MN, Hiscock J, Sibbald B: Attitudes to the public release of comparative information on the quality of general prac-tice care: qualitative study. British Medical Journal 2002, 325:1278.
9. Wilkinson D, Ferlie E, Addicott R, McCarthy M: The organizational context and use of routine data for cancer service manage-ment. Submitted to Public Money and Management 2007.
10. Wilkinson D, Michie S, McCarthy M: The use and perceptions of routine health data: a qualitative study of four cancer net-work teams in England. Health Serv Manage Res 2007,
20(4):211-219.
11. Addicott R, McGivern G, Ferlie E: Networks, Organizational Learning and Knowledge Management: NHS Cancer Net-works. Public Money and Management 2005, 26:87-94.
12. Bloom Y, Figgs LW, Baker EA, Dugbatey K, Stanwyck CA, Brownson RC: Data uses, benefits, and barriers for the behavioral risk factor surveillance system: a qualitative study of users. J Public Health Manage Pract 2000, 6(1):78-86.
13. McCarthy M: Measures of quality in cancer services. Scientific summary. London. 2003 [http://www.sdo.lshtm.ac.uk/ sdo652003.html]. NHS National Institute for Health Research 14. National Cancer Services Analysis Team Cancer networks
by PCT 2006 [http://www.canceruk.net/natcansat/location.htm]. 15. Department of Health: Manual of Cancer Services. [http://
www.dh.gov.uk/en/Policyandguidance/Healthandsocialcaretopics/ Cancer/index.htm].
16. Goddard M, Mannion R, Smith P: Enhancing performance in health care: A theoretical perspective on agency and the role of information. Health Economics 2000, 9:95-107.
17. Appleby J, Boyle S, Devlin N, Harley M, Harrison A, Thorlby R: Do English NHS waiting times targets distort treatment priori-ties in orthopaedics? Journal of Health Services Research and Policy 2005, 10:167-72.
18. Carrilio TE, Packard T, Clapp JD: Nothing in – nothing out: Bar-riers to the use of performance data in social service pro-grams. Administration in Social Work 2003, 27:61-75.
19. Exworthy M, Wilkinson EK, McColl A, Moore M, Roderick P, Smith H, Gabbay J: The role of performance indicators in changing the autonomy of the general practice profession in the UK.
Social Science and Medicine 2003, 56:1493-504.
Pre-publication history
The pre-publication history for this paper can be accessed here:
http://www.biomedcentral.com/1472-6963/7/204/pre pub
Publish with BioMed Central and every scientist can read your work free of charge
"BioMed Central will be the most significant development for disseminating the results of biomedical researc h in our lifetime."
Sir Paul Nurse, Cancer Research UK
Your research papers will be:
available free of charge to the entire biomedical community
peer reviewed and published immediately upon acceptance
cited in PubMed and archived on PubMed Central
yours — you keep the copyright
Submit your manuscript here:
http://www.biomedcentral.com/info/publishing_adv.asp