Open Access
Research article
Cost savings associated with improving appropriate and reducing
inappropriate preventive care: cost-consequences analysis
William Hogg*
†1, Neill Baskerville
†2and Jacques Lemelin
1Address: 1Department of Family Medicine, University of Ottawa, Canada and 2Department of Health Studies and Gerontology, University of
Waterloo, Canada
Email: William Hogg* - [email protected]; Neill Baskerville - [email protected]; Jacques Lemelin - [email protected] * Corresponding author †Equal contributors
Abstract
Background: Outreach facilitation has been proven successful in improving the adoption of clinical preventive care guidelines in primary care practice. The net costs and savings of delivering such an intensive intervention need to be understood. We wanted to estimate the proportion of a facilitation intervention cost that is offset and the potential for savings by reducing inappropriate screening tests and increasing appropriate screening tests in 22 intervention primary care practices affecting a population of 90,283 patients.
Methods: A cost-consequences analysis of one successful outreach facilitation intervention was done, taking into account the estimated cost savings to the health system of reducing five inappropriate tests and increasing seven appropriate tests. Multiple data sources were used to calculate costs and cost savings to the government. The cost of the intervention and costs of performing appropriate testing were calculated. Costs averted were calculated by multiplying the number of tests not performed as a result of the intervention. Further downstream cost savings were determined by calculating the direct costs associated with the number of false positive test follow-ups avoided. Treatment costs averted as a result of increasing appropriate testing were similarly calculated.
Results: The total cost of the intervention over 12 months was $238,388 and the cost of increasing the delivery of appropriate care was $192,912 for a total cost of $431,300. The savings from reduction in inappropriate testing were $148,568 and from avoiding treatment costs as a result of appropriate testing were $455,464 for a total savings of $604,032. On a yearly basis the net cost saving to the government is $191,733 per year (2003 $Can) equating to $3,687 per physician or $63,911 per facilitator, an estimated return on intervention investment and delivery of appropriate preventive care of 40%.
Conclusion: Outreach facilitation is more expensive but more effective than other attempts to modify primary care practice and all of its costs can be offset through the reduction of inappropriate testing and increasing appropriate testing. Our calculations are based on conservative assumptions. The potential for savings is likely considerably higher.
Published: 09 March 2005
BMC Health Services Research 2005, 5:20 doi:10.1186/1472-6963-5-20
Received: 16 July 2004 Accepted: 09 March 2005 This article is available from: http://www.biomedcentral.com/1472-6963/5/20
© 2005 Hogg et al; licensee BioMed Central Ltd.
Background
A randomized, controlled field trial of a multifaceted intervention to improve preventive care tailored to the needs of participating family practices was conducted in Southern Ontario and delivered by nurses trained in the facilitation of prevention. This report is a cost-conse-quences analysis of the intervention. Specifically, it pro-vides information about the cost of the outreach facilitator intervention and money saved the health care system as a result of reducing inappropriate and increas-ing appropriate preventive screenincreas-ing tests.
Improving preventive performance is both important and necessary. There is substantial room to improve rates of appropriate preventive practice [1]. The Canadian Task Force on the Periodic Health Examination [2,3] has estab-lished guidelines for the delivery of preventive care that are supported by clinical evidence as effective in decreas-ing the impact of disease. However, evidence-based guide-lines are not self-implementing [4-6]. Changing physicians' long-held patterns of behaviour and the envi-ronments in which they work is essential yet complex and difficult. Unless the barriers to change can be overcome and actions taken to put preventive care guidelines into practice, evidence-based guideline development efforts will be wasted and the quality of preventive care will not improve [7].
Several reviews have focussed on the effectiveness of dif-ferent interventions for implementing guidelines and improving care [5,6,8-12]. Multi-faceted outreach facilita-tion intervenfacilita-tions employing trained individuals who meet with providers in their practice setting to provide information and assist the practice in implementing evi-dence-based guidelines have been shown to be more effective than single interventions such as guideline dis-semination efforts or physician prompts [10-14]. Tailor-ing interventions to the requirements of the practice has also been proposed as important in supporting practice changes and in attaining more successful and sustained outcomes in preventive care performance as compared to interventions that are fixed and lack this flexibility [15-19]. Given the diversity of practice environments, it is unlikely that "one size fits all" approaches to improving preventive care will be able to address the needs of all pro-viders and their patients [20,21].
Successful interventions designed to improve compliance with evidence-based guidelines for preventive care could have an important influence on the health of Canadians. In addition, interventions designed to reduce the ordering of inappropriate tests in delivering preventive care have the potential to offset some of the intervention costs.
Economic evaluations of outreach facilitation
By its nature, outreach facilitation is multifaceted. In the United Kingdom and the United States specially trained nurse facilitators organized preventive care in busy practi-tioners' offices through outreach visits and using approaches such as academic detailing, chart audit and feedback for the prevention and early detection of cardio-vascular disease and cancer [22,23]. Very few evaluations of outreach facilitation have studied the costs of deliver-ing these interventions. The Cochrane Effective Practice and Organization of Care Group has concluded that out-reach visits are effective, however, cost-effectiveness needs to be determined [24]. Soumerai and Avorn have sug-gested that the savings from outreach facilitation may out-weigh the costs if the intervention is targeted at inappropriate and costly practice behaviour [25,26].
Cockburn and colleagues conducted a randomized con-trolled trial in which the effectiveness of three approaches to marketing a quit smoking intervention kit to physicians was evaluated [27]. They conclude that educational out-reach facilitators do not appear to be cost effective strate-gies for distributing smoking interventions. The actual use of the kit by the physicians for their smoking patients did not differ significantly across groups. However, there was a trend toward higher use in the facilitation group for one of the components of the kit as compared to those who received the kit by courier or standard mail.
Conversely, McCowan et. al. conducted a randomized controlled trial to examine the effect of a facilitator inter-vention on the management of children with asthma by family physicians [28]. They found that the facilitator intervention reduced asthma care costs in the intervention group as compared to the control resulting in an overall net saving of 12,000 (U.K. 1991) pounds or one pound less per child per annum. The facilitator accomplished this by inserting guidelines for the management of asthma into intervention practices' case records. The authors esti-mate that the net savings to the health system would recoup the facilitator's salary at 1991 rates.
The literature on the costs of outreach facilitation is lim-ited. It can be argued that facilitation is a costly interven-tion [27]. However, a costly interveninterven-tion that achieves success may be preferred to a cheaper one that demon-strates very little or has no lasting effect. More research on the costs of successful facilitation and other effective alter-native interventions to outreach facilitation is necessary.
Intervention description
and tailored a multi-component intervention to the spe-cific needs of the practice [22,23,29,30,17,31-34]. The facilitators completed a 30-week intensive training pro-gram before being assigned to intervention practices. The training covered an orientation session, medical office computer systems, medical practice management, preven-tion in primary care, evidence-based medicine, and facili-tation and audit skills development. Approximately 28 hours per week were spent in training and 7 hours per week in preparation and planning. Six of the 30 weeks of training were spent applying skills in a primary care office setting.
The intervention period was 18 months ending December 1998. During this period each intervention practice was visited an average of 33 times (range 21 to 50) at an aver-age visit length of one hour 45 minutes. The facilitators delivered primarily three intervention strategies to improve preventive care: chart audit and feedback, educa-tional consensus building, and reminder systems. They discussed the strategies with the physicians and practice staff, working with them to adapt the strategies to the practice needs and wishes. All 22 of the intervention prac-tices participated in an initial audit and received feedback on preventive care practice patterns. Twenty practices requested subsequent audits and analyses of data to fol-low their rates of performance. All of the practices were involved in meetings with the facilitator to identify oppor-tunities for improvement, assess needs, receive and dis-cuss critically appraised evidence from the literature for the preventive maneuvers, and select strategies for improving preventive care performance. All of the inter-vention practices implemented some form of a reminder
system as a strategy to improve performance. Eighteen practice sites implemented a preventive care flow sheet; two sites used a chart stamp; and two sites implemented a computerized reminder system.
The facilitators provided management support to prac-tices and followed a quality improvement framework sim-ilar to that proposed by Leininger and colleagues [30]. For each practice the facilitators were to: (1) present preven-tive performance rates prior to the intervention, (2) facil-itate the development of a practice policy for preventive care, (3) assist in the setting of goals and desirable levels of performance, (4) assist in the development of a written plan for implementing preventive care, (5) assist in the development and adaptation of tools and strategies to implement the prevention plan, (6) facilitate meetings to assess progress and modify the plan if necessary, and (7) conduct performance feedback to measure the effect of changes made.
The facilitators had no interaction with control practices. The latter were told that they were involved in a study on prevention but were not told which preventive manoeu-vres were being measured. More details on the multi-com-ponent nature of the intervention are published elsewhere [35].
Setting
The Prevention Facilitator intervention involved Health Service Organizations (HSOs) in Ontario. HSOs are com-munity primary care practices that have a payment system based primarily on capitation and not fee-for-service. At the time of the study, there were 72 physician-sponsored
Table 1: Preventive manoeuvres studied
Level of Evidence Preventive Manoeuvre
AΩ& B¥-categories: (Appropriate) 1. Folic acid for primary prevention of neural tube defects 2. Smoking cessation and nicotine replacement
3. Treatment for Hypertension
4. Mammography and exam in women over 50 5. STD screening for high risk groups
6. Papanicolaou smears for sexually active women 7. Influenza vaccination to patients 65 and older
8. Blood pressure measurement for patients 21 to 64 years of age
Dψ- category: (Inappropriate) 1. Proteinuria screening for general population 2. Blood glucose for the general population 3. Prostate-specific antigen testing for men over 50 4. Chest radiography
5. Mammography in women under 50
ΩThere is excellent evidence from repeated randomized controlled trials to support the manoeuvre. ¥ There is good evidence from cohort and case-control studies to support the manoeuvre.
HSOs located at 100 different sites in Ontario. The study involved 106 physicians from 45 HSOs. All physicians gave informed consent to participate in the trial.
Intervention outcomes
The goal of the intervention was to increase those preven-tive manoeuvres supported by evidence as appropriate and decrease those preventive manoeuvres supported by evidence as inappropriate. Eight grade A and B, and 5 grade D preventive manoeuvres were chosen by a panel of practicing family physicians from the Canadian Guide to Clinical Preventive Health Care[3] to represent a broad spectrum for both male and female adult patients (see
Table 1). The grade A and B manoeuvres are supported by evidence as appropriate and the grade D manoeuvres are supported by evidence as inappropriate. As determined by chart audit, an absolute change overtime of 11.51% in preventive care performance in favour of intervention practices was achieved. More detailed outcome results of the randomized controlled trial are reported elsewhere [36].
[image:4.612.55.560.99.246.2]We wanted to estimate the cost savings associated with an effective outreach facilitation intervention designed to reduce inappropriate and improve the delivery of appro-priate preventive care.
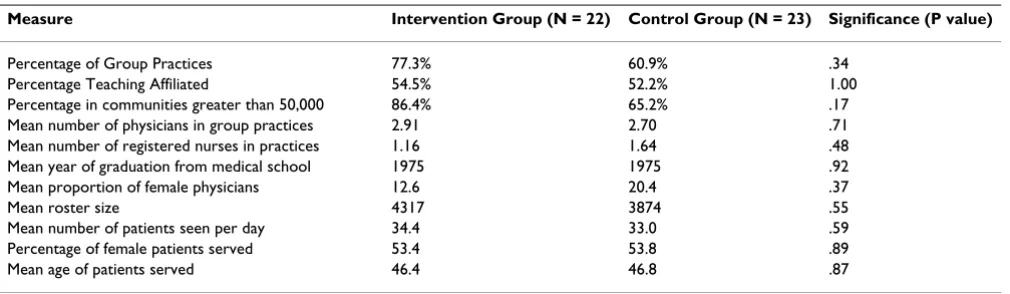
Table 2: Demographic profile comparison of intervention and control practices
Measure Intervention Group (N = 22) Control Group (N = 23) Significance (P value)
Percentage of Group Practices 77.3% 60.9% .34
Percentage Teaching Affiliated 54.5% 52.2% 1.00
Percentage in communities greater than 50,000 86.4% 65.2% .17
Mean number of physicians in group practices 2.91 2.70 .71
Mean number of registered nurses in practices 1.16 1.64 .48
Mean year of graduation from medical school 1975 1975 .92
Mean proportion of female physicians 12.6 20.4 .37
Mean roster size 4317 3874 .55
Mean number of patients seen per day 34.4 33.0 .59
Percentage of female patients served 53.4 53.8 .89
[image:4.612.59.553.304.508.2]Mean age of patients served 46.4 46.8 .87
Table 3: Comparison of intervention and control practices on delivery of preventive manoeuvres to eligible patients post intervention (N = 4501)
Preventive Manoeuvres Proportion of Eligible Patients
Intervention (n = 2201) Control (n = 2300) Significance
A & B Manoeuvres % (N) % (N)
Folic Acid Pre-conception 15.4% (325) 4.9% (369) .0001
Cessation Counselling 41.7% (571) 40.6% (549) N.S.
Mammography 50 to 69 68.3% (325) 57.5% (358) .005
Hypertension Treatment 79.7% (169) 82.7% (185) N.S.
STD Screening 23.3% (382) 19.1% (366) N.S.
BP Measurement 74.6% (1666) 72.5% (1781) N.S.
FLU Vaccination 66.0% (692) 53.8% (652) .0001
Cervical Cytology 66.2% (826) 60.2% (958) .01
D Manoeuvres
Blood glucose screening 32.8% (1844) 38.7% (1980) .0001
PSA Testing 30.6% (379) 30.0% (393) N.S.
Mammography 40 to 49 1 11.6% (267) 9.1% (309) N.S.
Chest X-Ray 3.7% (571) 4.9% (549) N.S.
Urine proteinuria screening 16.5% (1772) 29.8% (1887) .0001
1This was a grade D manoeuvre at the time of the study; the Canadian Task Force on Preventive Health Care has recently changed it to a Grade C
Table 4: Input variables and cost estimates for appropriate manoeuvres (1999 dollars)
Variable Value and Rangea Source
A & B Manœuvres
Folic Acid
Difference in no. of eligible patients counseled 1495 (854, 2136) (36)
Probability of reducing neural tube defects .00058 (55)
Life-time treatment costs of Spina Bifida $201,822b (51)
Smoking Cessation Counselling/NRT
Difference in no. of eligible patients counseled 253 (-1072, 1577) (36)
Efficacy of NRT .06 (3)
Incidence of lung cancer in smokers .0024 (48)
Treatment costs for lung cancer $7,074 (56)
Mammography 50 to 69 years of age
Difference in no. of eligible women screened 1513 (505, 2521) (36)
Incidence of breast cancer .003165 (42)
Cost of a mammogram $76.54 (57)
Treatment costs saved for each breast cancer $2,522 (42)
Hypertension Treatment
Difference in no. of eligible patients treated -145 (-739, 449) (36)
Efficacy of treatment of stroke .42 (3)
Incidence of stroke .0018 (47)
Efficacy of treatment of heart disease .14 (3)
Incidence of heart disease .00196 (47)
Treatment cost per case for stroke $3,815 (56)
Treatment cost per case for heart disease $3,303 (56)
STD Screening
Difference in no. of eligible patients screened 645 (-253, 1542) (36)
Cost of gonorrhoeae and chlamydia culture $55 (57)
Incidence of gonorrhoeae or Chlamydia infection .08 (49)
Pelvic inflammatory disease (PID) prevented .14 (50)
Treatment cost per case for PID $1,782 (49)
Flu Vaccination
Difference in no. of eligible patients vaccinated 3364(1928,4799) (36)
Cost of flu vaccination $3.75 (43)
Pneumonia hospitalizations averted 4.1 per 1000 (43)
Chronic respiratory hospitalizations averted 10.4 per 1000 (43)
Congestive heart failure hospitalizations averted 2 per 1000 (43)
Emergency room visits avoided 21.6 per 1000 (43)
Emergency room visit cost $76.00 (44)
Cost of pneumonia hospitalization $4,462 (56)
Cost of chronic respiratory hospitalization $4,445 (56)
Cost of heart failure hospitalization $5,417 (56)
Cervical Cytology
Difference in no. of eligible patients screened 2196 (559, 3833) (36)
Cost of PAP test $57.17 (57)
Incidence of cervical cancer .00013 (46)
Treatment costs saved for each women screened $9,813 (41)
Methods
The analysis was part of a randomized controlled trial to determine if outreach facilitation was effective in improv-ing prevention in primary care. The design of the trial and details of the method have been described in full else-where [36]. Practices were randomized to either interven-tion (22 practices) or control status (23 practices).
Patient eligibility
Patients eligible for the intervention were greater than 19 years of age, asymptomatic and had received the interven-tion for screening and preveninterven-tion purposes.
Cost analysis methodology
We performed a cost-consequences analysis to evaluate the outreach facilitation intervention [37]. We deter-mined the incremental costs of the preventive manoeuvres performed and the overall cost of the inter-vention. We estimated the cost-savings as a result of hav-ing improved appropriate preventive care and reduced inappropriate preventive care between intervention and
[image:6.612.62.552.97.431.2]control conditions. All of the appropriate and inappropri-ate preventive manoeuvres from the trial were included in the analysis, not only those that showed significant improvement. Multiple data sources were used to deter-mine the costs of preventive procedures, treatment, and efficacy of preventive manoeuvres (see Tables 4 and 5). We determined the costs and savings associated with out-reach facilitation by calculating the mean difference between intervention and control groups in the number of eligible patients screened or treated for appropriate pre-ventive manoeuvres and the mean difference in the number of eligible patients not screened for inappropriate preventive care. The cost-consequences analysis is con-ducted from the perspective of the Ontario Government. All costs are presented on the basis of one year rather than over the 18-month period of the intervention to corre-spond with the government one-year planning and budg-eting cycle. Costs were converted into Canadian dollars using the nominal rate method and adjusted for inflation (1999 current dollars) where necessary. The net cost sav-ings per patient and per facilitator are presented.
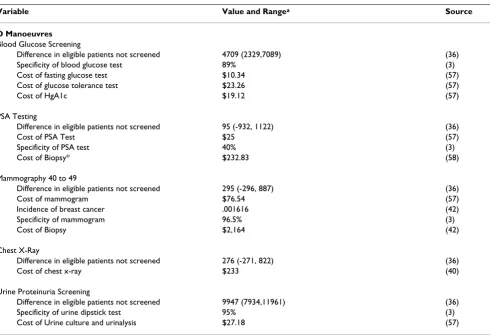
Table 5: Input variables and cost estimates for inappropriate manoeuvres (1999 dollars)
Variable Value and Rangea Source
D Manoeuvres
Blood Glucose Screening
Difference in eligible patients not screened 4709 (2329,7089) (36)
Specificity of blood glucose test 89% (3)
Cost of fasting glucose test $10.34 (57)
Cost of glucose tolerance test $23.26 (57)
Cost of HgA1c $19.12 (57)
PSA Testing
Difference in eligible patients not screened 95 (-932, 1122) (36)
Cost of PSA Test $25 (57)
Specificity of PSA test 40% (3)
Cost of Biopsy* $232.83 (58)
Mammography 40 to 49
Difference in eligible patients not screened 295 (-296, 887) (36)
Cost of mammogram $76.54 (57)
Incidence of breast cancer .001616 (42)
Specificity of mammogram 96.5% (3)
Cost of Biopsy $2,164 (42)
Chest X-Ray
Difference in eligible patients not screened 276 (-271, 822) (36)
Cost of chest x-ray $233 (40)
Urine Proteinuria Screening
Difference in eligible patients not screened 9947 (7934,11961) (36)
Specificity of urine dipstick test 95% (3)
Cost of Urine culture and urinalysis $27.18 (57)
a 95% Confidence Intervals
Intervention costing methodology
The actual cost of the intervention over 18 months was gathered from administrative expenditure records for labour, supplies, telephone and travel. The investigation team determined that the cost of training the nurse facili-tators was important to include but that the investment in training was worth more than the 18-month period of the intervention. Therefore, the cost of the training of the three nurse facilitators was depreciated over a 5-year life at a discount rate of 5% using the double-declining balance method for the 18-month period of the intervention. To correspond with the government planning and budgeting perspective, research costs were not included but supervi-sion was. The justification for excluding research costs and including supervision was to model the program as if it were implemented as an actual government sponsored intervention. As a government sponsored program there would be no research salary and operations costs, but there would still be the need to supervise the facilitators. In addition, the cost of physician time for administering preventive manoeuvres was not included. The rationale for excluding physicians' time for administering preven-tive manoeuvres is based upon the fact that the physicians were not reimbursed on a fee-for-service basis but rather were reimbursed on a capitation basis and the interven-tion did not result in an increased number of visits keep-ing costs the same in both the intervention and control groups. Within a capitation based system, physicians are reimbursed according to the size of their patient roster and not by fee-for-service. Physicians within a capitation based system do not receive additional fees for providing preventive services, nor do they receive any additional remuneration from seeing a patient more frequently. Therefore, this is not an additional cost to the Ontario provincial government.
Preventive manoeuvre costs
Using the most recent fee schedule for laboratory services, published by the Ontario Ministry of Health in April of 1999, we calculated the direct costs of performing seven appropriate and five inappropriate measures. Where cost estimates were unavailable from these two sources, pub-lished estimates for the cost of bilateral mammogra-phy[38], administering a flu shot[39], a chest x-ray[40] and cervical cancer screening[41]were used. The cost of folic acid, nicotine replacement therapy, hypertensive medication and antibiotics were not included since from the perspective of the Ontario government we determined that these costs would be substantially paid for directly by patients. The measurement of blood pressure was included as a case finding manoeuvre for hypertension as described by the Canadian Task Force on Preventive Health Care [3] but was not costed as 80% of eligible patients in treatment and control groups received a blood pressure measurement and as a consequence did not
impact the cost analysis. Calculations were performed using Microsoft Excel Version 7.0.
Direct costs associated with inappropriate tests avoided are considered savings to the government whereas the costs associated with increasing the number of appropri-ate tests are considered costs to the government (see Tables 4 and 5). The direct cost for each inappropriate test, according to the Ontario Ministry of Health, includes not only the test cost for performing the manoeuvre but also a "Patient Documentation and Specimen Collection Fee" which can be applied to a test or series of tests performed for one patient. The costs for appropriate tests were gath-ered from the estimates of other relevant cost studies (see Table 4). For the purpose of calculating costs, the total population of 184,670 patients as of November 1998 for all 45 HSO practices was used to estimate the total number of intervention patients eligible (90,283) to receive a test according to the patients eligible for the selected tests from the study sample of 4,501 patients (2,201 intervention patients, 2300 control patients).
The cost of the initial visit to the physician was not included given that this cost would have been included whether a test was performed or not and these costs would be similar between the intervention and control groups and thus would not significantly impact the cost analysis. In addition, direct costs to the patient such as travel time to a laboratory to have a blood test have not been included. However, down-stream costs (follow-up visits and further tests) for the subsequent follow-up of false positive results for all screening manoeuvres where appro-priate have been included. The down-stream costs included the cost of biopsies to determine breast cancer and prostate cancer as well as the cost of follow-up glu-cose tolerance tests to screen for diabetes. Any down-stream costs associated with other preventive manoeuvres were not considered for the analysis.
patient visit. For estimating the total costs of performing follow-up on a positive PSA result, it was assumed that 90% of patients would be referred to an urologist [58]. The cost of family physician follow-up visits was not included given that the HSO physicians were not reim-bursed on a fee-for-service basis. The input variables and cost estimates for appropriate and inappropriate manoeu-vres are provided in Tables 4 and 5.
Preventive manoeuvre savings
The input variables and cost estimates for savings associ-ated with preventive manoeuvres are provided in Tables 4 and 5. The difference in the number of patients receiving preventive manoeuvres between the intervention and control practices gave us the increase in savings to the gov-ernment. Mammography can reduce breast cancer mortal-ity by 20% to 30% [3]. For savings associated with Mammography in women 50 to 69, Salzmann et al. [42] was used to determine the difference in lifetime treatment costs of screened and unscreened women with breast can-cer. The estimated difference is $1,682 $US 1995 or con-verted and inflated to 1999 dollars $2,522 $Can less for the screened group. It is assumed that the incidence of breast cancer in women 50 to 69 is 3.165 per thousand [42].
For savings associated with administering flu vaccine in the elderly, Nichol et. al.[43] provided the data on the number of hospitalizations of the elderly averted due to flu vaccination for pneumonia (4.1 per 1,000), chronic respiratory conditions (10.4 per 1,000), congestive heart failure (2 per 1,000) and the number of emergency room visits avoided (21.6 per 1,000). The estimated cost of an emergency room visit of $76.00 $Can 1999 as determined by Jacobs and Hall was used [44]. The Ontario Case Cost-ing project provided the average length of stay and the total cost of hospitalization for pneumonia ($4,462 $Can 1999), chronic respiratory conditions ($4,445 $Can 1999) and congestive heart failure ($5,417 $Can 1999) for patients 65 years of age and older.
Performing Pap tests every three years reduces invasive cervical cancer by 91.2% [45]. Fahs et al. [46] provided the cervical cancer incidence rate (10 per 100,000 women) and Helms et al.[41] provided the difference in cervical cancer treatment at stage of diagnosis. The difference between the net costs of treatment for patients in the ini-tial stages of cervical cancer and more invasive cancer is $6,368 ($US 1988) or $9,813 ($Can 1999).
For determining savings associated with smoking cessa-tion counselling and treatment of hypertension, the Cana-dian Task Force on Preventive Health Care [3] provided the percent efficacy of cessation counselling and the treat-ment of hypertension for stroke and heart disease. The
Canadian Institute for Health Information [47] provided the incidence of stroke and heart disease and Statistics Canada provided the incidence of lung cancer in smokers [48]. The Ontario Case Costing project provided the total cost for lung cancer hospitalization ($7,074 $Can 1999), stroke hospitalization ($3,815 $Can 1999), and hospital-ization for heart disease ($3,303 $Can 1999) for deter-mining overall treatment cost savings.
For savings associated with STD screening, Gift et. al.[49] provided the figure for the incidence of gonorrhoeae or chlamydia infection for eligible women as well as the cost to treat a case of pelvic inflammatory disease (PID) and the Centers for Disease Control and Prevention provided the figure for the prevention of pelvic inflammatory dis-ease from treatment [50].
Finally, for determining the costs averted as a result of increasing folic acid intake, Waitzman et. al.[51] provided the data on the net direct medical costs associated with Spina Bifida ($123,485 $US 1996 or $201,822 $Can 1999) and the Canadian Task Force on Preventive Health Care and the CDC provided the estimates for the reduc-tion in neural tube defects due to folate, an estimated 50% of all neural tube defects or 500 per million births [3].
After calculating the current (1999) cost of the interven-tion and the cost of the increase in delivery of recom-mended preventive manoeuvres we calculated the potential direct savings to the government for increased appropriate and decreased inappropriate preventive care by multiplying the costs with the estimated difference in patients screened or treated using the estimates and input variables provided in Tables 4 and 5. We also calculated a low and high estimate of costs using the 95% confidence intervals of the difference in patients screened between intervention and control groups. These calculations are summarised mathematically in Appendix – [see Addi-tional file 1].
Sensitivity analysis
assessed individually on the ranges of the net savings out-come generated by the simulation to generate a Tornado diagram. Percent variance was used to determine the degree to which the outcome net savings was sensitive to the values of each input parameter and to determine which input parameter had the greatest impact on net savings.
Results
Intervention (n = 22) and control (n = 23) group practices did not differ significantly on any of the demographic characteristics presented in Table 2.
Intervention effect
Table 3 presents the proportion of eligible patients that received recommended (A & B Manoeuvres) and inappro-priate (D Manoeuvres) preventive care for both interven-tion and control groups of patients after the outreach facilitator intervention.
For inappropriate testing there was a statistically signifi-cant but small reduction in the proportion of eligible patients that received a random blood glucose test to screen for diabetes (32.8% vs. 38.7%) and a larger reduc-tion for urine protein testing to screen for kidney disease (16.5% vs. 29.8%). There were no significant differences for PSA testing to screen for prostate cancer, mammogra-phy for women 40 to 49, or chest radiogramammogra-phy to screen for lung cancer in smokers. For appropriate preventive manoeuvres there was a statistically significant difference for folic-acid counselling, mammography for women 50 to 59, flu vaccination, and cervical cytology.
Intervention costs
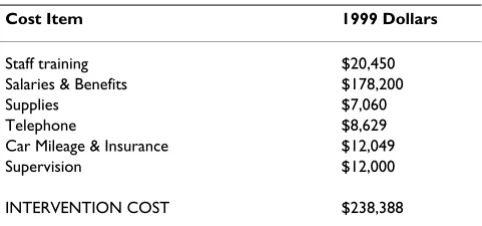
Table 6 provides data on the costs of the outreach facilita-tor intervention in 1999 dollars. The 18-month intervention cost a total of $357,583.00 for three nurse facilitators including all travel, telephone, supplies and supervision or $238,388 per year. Telephone costs include the cost of a cellular phone as well as the long distance costs of a home telephone. Supply costs include the costs
of home-office supplies as well as the cost of materials for intervention purposes in the practices. The cost of the intervention on a yearly basis equates to $10,835 per intervention practice (n = 22) or $4,584 per intervention physician (n = 52) or $328 per visit based on an average of 33 visits to the practice per year.
Table 7 provides the costs of providing recommended pre-ventive care. The intervention resulted in 1,513 more mammograms having been done which is estimated to be an additional cost to the government of $77,192 per year with a range of $25,743 to $128,641 depending on the number of mammograms. 645 additional cultures for gonorrhoeae and chlymadia were carried out in the inter-vention arm resulting in an estimated $23,631 in costs. In addition, 3,364 more flue shots were provided in the intervention arm of the trial costing $8,409 per year and 2,196 more women received a PAP test at a cost of $83,679 per year (see Table 7).
The total cost to the government for the intervention and additional manoeuvres performed was $431,300 (95% CI: $280,969 – $581,630) on a yearly basis, that equates to $19,604 per intervention practice, or $143,766 per facilitator or $4.67 per HSO patient rostered (see Table 10).
Cost savings
Table 8 gives the estimated cost savings in 1999 dollars as a result of having significantly reduced inappropriate care in the intervention group for unrecommended screening manoeuvres. For the laboratory and diagnostic services cost model extrapolated to the entire eligible patient ros-ter for inros-tervention practices there is an estimated $148,568 (95% CI: -$175,898 – $473,035) in total sav-ings including follow-up tests. This represents 34% of the costs of the outreach facilitator intervention and reduces the program to a cost of $282,732.
[image:9.612.56.297.99.212.2]Table 9 provides the cost savings to the government as a result of averted hospitalizations and treatment costs. There is an estimated $455,464 (95% CI: $237,935 -$672,992) per year in averted hospitalization and treat-ment costs as a result of increasing the provision of recommended care to eligible patients. Most of the cost averted ($254,633 per year) is due to the estimated reduc-tion in hospitalizareduc-tions for pneumonia [14], acute chronic respiratory conditions [35], and cases of conges-tive heart failure [7]. The treatment costs saved of an esti-mate of one case of Spina Bifida equated to $174,999. Costs averted due to hospitalizations and treatment equate to $20,703 per practice, $151,821 per facilitator, and $4.93 per patient.
Table 6: Intervention costs over 12 months
Cost Item 1999 Dollars
Staff training $20,450
Salaries & Benefits $178,200
Supplies $7,060
Telephone $8,629
Car Mileage & Insurance $12,049
Supervision $12,000
Table 7: Costs associated with the increase of appropriate preventive manoeuvres (1999 Dollars)
Manoeuvre Baseline Low High
STD Screening $23,630.87 -$9,268.28 $56,530.01
Mammography 50 to 59 $77,192.11 $25,742.87 $128,641.34
Influenza shot $8,409.23 $4,820.83 $11,997.62
Pap Test $83,679.41 $21,286.01 $146,072.81
[image:10.612.55.555.253.356.2]TOTAL $192,911.62 $42,581.43 $343,241.78
Table 8: Savings associated with the reduction of inappropriate preventive care (1999 Dollars)
Manoeuvre Baseline Low High
Chest X-Ray $42,827.36 ($42,065.12) $127,719.83
Mammography 40 to 49 $16,107.12 ($16,131.58) $48,345.82
PSA Testing $16,125.11 ($158,156.15) $190,406.37
Blood glucose $59,990.54 $29,672.59 $90,308.49
Urine Protein $13,518.31 $10,782.33 $16,254.29
TOTAL $148,568.44 ($175,897.93) $473,034.80
Table 9: Savings from the provision of appropriate preventive care (1999 Dollars)
Condition Baseline Low High
Breast Cancer $12,075.20 $4,026.97 $20,123.44
Influenza $254,633.54 $145,976.01 $363,291.07
Neural Tube Defects $174,999.39 $99,997.21 $250,001.56
Cervical cancer $2,154.49 $548.05 $3,760.92
Lung Cancer $122.27 ($518.51) $763.06
Heart Disease ($808.13) ($4,116.12) $2,499.86
STD Treatment $12,862.75 ($5,044.91) $30,770.42
Stroke ($575.90) ($2,933.28) $1,781.48
TOTAL $455,463.61 $237,935.42 $672,991.81
Table 10: Estimated cost savings
Baseline Low High
Costs
Intervention Cost $238,388 $238,388 $238,388
Manoeuvre Costs $192,911.62 $42,581.43 $343,241.78
Total Costs $431,299.62 $280,969.43 $581,629.78
Savings
Inappropriate manoeuvre savings $148,568.44 ($175,897.93) $473,034.80
Treatment cost savings $455,463.61 $237,935.42 $672,991.81
Total Savings $604,032.05 $62,037.49 $1,146,026.61
[image:10.612.55.553.406.541.2] [image:10.612.57.556.583.715.2]Table 10 shows that the cost of the program over one year combined with the increased costs associated with deliv-ering more recommended preventive care is $431,300. The costs averted from reducing inappropriate tests and the reduction in hospitalization and treatment are $604,032. This is a net cost savings to the government of $172,732 (95% CI: -$218,932 – $564,397) per year as a result of the intervention with 22 practices and equates to $1.87 per patient saved or $3,321 per physician, an esti-mated return on the intervention and investment in addi-tional manoeuvres of 40%. Based on a Consumer Price Index of $1.11 the net cost savings to the government in 2003 dollars are $191,733 per year or $8,715 per practice, $3,687 per physician, or $2.08 per patient.
Sensitivity analysis
The sensitivity analysis using Monte Carlo simulation revealed that the mean net savings in 1999 dollars to the government would be $175,510 and that 90% of the expected net savings to the government would fall between $-43,000 and $394,000 (see Figure 1). Based upon 1,000 iterations of the cost model and the assump-tions regarding input costs, it is unlikely that the govern-ment would not receive some return on its investgovern-ment in outreach facilitation. Finally, Figure 2 shows the relation-ship between each of the input variables to net savings. As would be expected net savings is very sensitive to PSA
test-ing with the more men tested the less net savtest-ings account-ing for 47.4% of the variance. Flu vaccination also impacts net savings in terms of pneumonia prevented and accounting for 18.4% of the variance in net savings. Due to the poor specificity of the PSA test and the non signifi-cant effect of the intervention to reduce PSA tests in eligi-ble men, the cost associated with the PSA test varies considerably and its reduction is critical for attaining cost savings whereas the increase of PSA tests is negatively associated with savings. In contrast, PAP testing and mam-mography for 50 to 59 year old women in the cost model are not as negatively associated with net savings despite the increase in costs as more of these manoeuvres are performed.
Discussion
The primary objective of this study was to determine if decreasing inappropriate preventive tests and increasing appropriate testing performance could offset the cost of an outreach facilitation intervention to improve preven-tive practice. The significant reduction in inappropriate testing and increase in appropriate testing resulted in net savings of $191,733 per year in 2003 dollars to the gov-ernment or a return on investment of 40%. The limita-tions of the cost analysis are typical to this type of economic evaluation [37]. They include:
Distribution of outcome for net savings Figure 1
• the perspective of the government necessitated not hav-ing included all possible costs in the model. For example, the cost for patient time, travel or patient discomfort and anxiety associated with the manoeuvre were not included;
• the total indirect costs associated with hospitalizations averted were not included;
• the estimate of the frequency of downstream events was based on a panel of experts;
• the estimate for screening for cervical cancer was based on a yearly screening rather than once every three years;
• downstream costs were estimated and included in the model for follow-up visits as a result of a false positive test only. Other possible downstream costs such as visits to other allied health professionals or consults to specialists were not included;
• the benefit of inappropriate screening tests for some patients and the associated cost savings have been ignored; and
• rates of delivery for preventive screening tests were from a randomized controlled trial in a HSO setting. Therefore, caution must be used when generalizing the potential cost savings to other settings.
Sensitivity analysis for net savings Figure 2
Our cost estimates in this analysis are conservative since patient costs and other downstream costs were not included. Nonetheless, the analysis shows that all of the costs of the outreach facilitator intervention can be recouped as a result of having reduced inappropriate test-ing and increased appropriate testtest-ing for the manoeuvres under study. Similarly, McCowan et. al. were able to show that a facilitation intervention was able to improve pri-mary care asthma management and that the cost savings to the health care system could completely offset the annual salary of one facilitator serving a large number of family physicians [28]. McCowan's study also included the costs associated with hospital admissions and second-ary costs and involved the improvement in treatment of an acute illness and not prevention in primary care. Including the downstream costs associated with inappro-priate tests averted for the outreach facilitator intervention has allowed for an additional 35% in estimated cost sav-ings and the inclusion of costs averted associated with appropriate testing has completely offset the cost of out-reach facilitation.
The successful outreach facilitator intervention described in this study was a very intensive intervention with each practice being visited an average of 33 times over 18 months. This compares to other successful trials such as Dietrich et. al. [23] where outreach facilitators visited only 3 times over a three-month period at an average of 120 minutes per visit and Hulscher et. al. [32] where facilita-tors visited practices an average of 25 times with an aver-age duration of only 73 minutes. Both of these studies used outreach facilitation to improve preventive practice for a number of different maneuvres. Unfortunately, the cost of outreach facilitation was not included in these less intensive studies.
The cost of an outreach facilitator in our study per year was over $4,497 per physician but resulted in an overall net savings to the government of $3,289 per physician. In comparison, Cockburn et. al. tested an educational out-reach facilitator intervention to improve physician smok-ing cessation counsellsmok-ing performance which cost $A142 in 1992 per practitioner [27]. However, the facilitator only visited each physician twice at an average of 12 min-utes per visit or $A72 per visit and achieved very little in the way of improved outcomes. As a consequence, unsuc-cessful outreach facilitation was shown to be not cost-effective compared to other alternatives. In our interven-tion the cost per visit was $590 and nothing after having adjusted for cost savings associated with a successful inter-vention. Our intervention was targeted at changing the entire practice and not just physician behaviour for a number of preventive measures, and as a result more time was spent on-site and more visits were required. More
research is necessary to determine the most appropriate intensity of intervention for a given level of outcome.
The Cochrane Effective Practice and Organization of Care Group has compiled evidence that supports outreach vis-its combined with additional interventions as effective in improving professional practice and health outcomes [13]. Our study has demonstrated the effectiveness of outreach facilitation in improving overall preventive care performance. This is the first cost-consequences analysis of an outreach facilitation intervention that we are aware of and we have shown that the savings attributable to the reduction in inappropriate testing and increases in appro-priate testing can offset all of the intervention cost and in fact result in a net savings to the government of approxi-mately two dollars for every rostered patient. Further, the sensitivity analysis has revealed that the likelihood of net savings to the government is substantial despite variation in the inputs. However, it has also revealed that the appropriate primary preventive manoeuvres such as vacci-nation of the elderly contribute more to net savings to the government than some secondary preventive manoeuvres such as Pap testing and mammography. The net savings associated with primary prevention help to cover the net costs to the government associated with secondary pre-vention. As well, in the case of PSA testing even greater cost savings may be possible by significantly reducing this and other inappropriate tests and the consequent down-stream costs.
Conclusion
This paper has provided information on the cost of out-reach facilitation and the potential for cost savings to the health system. The results can be considered an underesti-mate of the true potential cost savings given that not all the costs associated with inappropriate and appropriate preventive care were considered. Further, this was an effi-cacy trial and as a consequence there is potential for reducing the cost of the intervention through efficiency improvements such as increasing the number of practices per facilitator as well as savings in administration and training through economies of scale. In addition, addi-tional savings to the health system may be possible through on-going outreach facilitation for chronic illness care.
There are no magic bullets to changing primary care prac-tice patterns [9]. However, a facilitation approach that incorporates a number of intervention strategies tailored to the environment and needs of the practice holds prom-ise. The literature has shown that outreach facilitation is one of the most effective means of improving the delivery of primary care preventive health services [13]. Further economic evaluations of outreach facilitation and other intervention alternatives are needed to assist in important public policy and administrative decision-making on get-ting preventive care guidelines into practice.
Competing interests
The research project was funded by a grant from the Ontario Ministry of Health. All of the authors were involved in the research project to evaluate the effectiveness of outreach facilitation in improving the delivery of preventive health care guidelines. WH and JL are practicing family physicians, professors with the Uni-versity of Ottawa and were investigators on the project. NB is a PhD candidate at the University of Waterloo and was employed as the project co-ordinator for the evaluation.
Authors' contributions
WH is the Principal Investigator for the Closing the Loop on Prevention project. WH and JL conceived the eco-nomic evaluation study, participated in the study design, preparation of first drafts and critical revisions of the man-uscript and contributed to all other aspects of the study. NB contributed to the economic study design, acquired the economic data, performed the economic analysis and interpretation, prepared, and revised the manuscript.
Additional material
References
1. Hutchison B, Woodward C, Norman G, Abelson J, Brown J: Provi-sion of preventive care to unannounced standardized patients.CMAJ 1998, 158(2):185-193.
2. Spitzer WO: The Canadian Task Force on the Periodic Health Examination.Can Med Assoc J 1979, 121:1193-1254.
3. Canadian Task Force on the Periodic Health Examination: The Cana-dian guide to clinical preventive health care Ottawa: Health Canada; 1994.
4. Tamblyn R, Battista RN: Changing clinical practice: What inter-ventions work?J Cont Edu Hlth Prof 1993, 13:273-288.
5. Davis DA, Thompson MA, Oxman AD, Haynes RB: Changing phy-sician performance. A systematic review of the effect of con-tinuing medical education strategies.JAMA 1995, 274:700-705. 6. Bero LA, Grilli R, Grimshaw JM, Harvey E, Oxman AD, Thomson MA:
Closing the gap between research and practice: an overview of systematic reviews of interventions to promote the imple-mentation of research findings. The Cochrane Effective Practice and Organization of Care Review Group.BMJ 1998,
317:465-480.
7. The University of York: Effective Health Care: Getting evidence into practice. NHS Centre for Reviews and Dissemination 1999,
5(1):1-16.
8. Lomas J, Haynes RB: A taxonomy and critical review of tested strategies for the application of clinical practice recommen-dations: from official to individual clinical policy.Am J Prev Med
1988, 4(Suppl 4):77-94.
9. Oxman AD, Thomson MA, Davis DA, Haynes B: No Magic Bullets: A Systematic Review of 102 Trials of Interventions to Improve Professional Practice.CMAJ 1995, 153(10):1423-1452. 10. Wensing M, Grol R: Single and combined strategies for imple-menting changes in primary care: A literature review.Int J Qual Health Care 1994, 6(2):115-132.
11. Wensing M, van der Weijden T, Grol R: Implementing guidelines and innovations in general practice: which interventions are effective?Br J Gen Pract 1998, 48:991-997.
12. Hulscher MEL, Wensing M, Grol R, Weijden T, van Weel C: Inter-ventions to improve the delivery of preventive services in primary care.Am J Public Health 1999, 89(5):737-746.
13. Thomson MA, Oxman AD, Davis DA, Haynes RB, Freemantle N, Harvey E: Educational outreach visits: effects on professional practice and health care outcomes (Cochrane Review). In The Cochrane Database of Systematic Reviews Volume 2. Oxford: The Cochrane Library; 1999.
14. Sanci LA, Coffey CM, Veit FC, Carr-Gregg M, Patton GC, Day N, Bowes G: Evaluation of the effectiveness of an educational intervention for general practitioners in adolescent health care: randomised controlled trial.BMJ 2000, 320:224-230. 15. Cohen SJ, Halvorson HW, Gosselink CA: Changing physician
behavior to improve disease prevention. Prev Med 1994,
23:284-291.
16. Main DS, Cohen SJ, DiClemente CC: Measuring physician readi-ness to change cancer screening: preliminary results.Am J Prev Med 1995, 11:54-58.
17. Hulscher MEJL, Van Drenth BB, Mokkink HGA, Van de Lisdonk EH, Van der Wouden JC, van Weel C, Grol RPTM: Tailored outreach visits as a method for implementing guidelines and improv-ing preventive care.Int J Quality Hlth Care 1998, 10(2):105-112. 18. Stange KC, Goodwin MA, Zyzanski SJ, Dietrich AJ: Sustainability of
a practice-individualized preventive service delivery intervention.Am J Prev Med 2003, 25(4):296-300.
Additional File 1
Mathematical Summary Click here for file
19. Goodwin MA, Zyzanski SJ, Zronek S, Ruhe M, Weyer SM, Konrad N, Esola D, Stange KC: A clinical trial of tailored office systems for preventive service delivery. The Study to Enhance Preven-tion by Understanding Practice (STEP-UP).Am J Prev Med
2001, 21(1):20-28.
20. Stange KC: One size doesn't fit all: Multimethod research yields new insights into interventions to increase prevention in family practice.J Fam Pract 1996, 43(4):358-360.
21. Carpiano RM, Flocke SA, Frank SH, Stange KC: Tools, teamwork, and tenacity: an examination of family practice office system influences on preventive service delivery. Prev Med 2003,
36(2):131-140.
22. Fullard E, Fowler G, Gray J: Facilitating prevention in primary care: a controlled trial of a low technology, low cost approach.BMJ 1987, 294:1080-1082.
23. Dietrich AJ, O'Connor GT, Keller A, Karney PA, Levy D, Whaley F:
Cancer: Improving Early Detection and Prevention. A Com-munity Practice Randomised Trial.BMJ 1992, 304:687-691. 24. O'Brien T, Oxman AD, Davis DA, Haynes RB, Freemantle N, Harvey
E: Educational outreach visits: effects on professional prac-tice and health care outcomes (Cochrane Review). In The Cochrane Database of Systematic Reviews Volume 2. Oxford: The Cochrane Library; 1999.
25. Soumerai SB, Avorn J: Economic and policy analysis of univer-sity-based drug "detailing".Med Care 1986, 24(4):313-31. 26. Soumerai S, Avorn J: Principles of educational outreach
"Aca-demic Detailing" to improve clinical decision making.JAMA
1990, 263(4):549-556.
27. Cockburn J, Ruth D, Silagy C, Dobbin M, Reid Y, Scollo M, Naccarella L: Randomized trial of three approaches for marketing smoking cessation programmes to Australian general practitioners.BMJ 1992, 304:691-694.
28. McCowan C, Neville RG, Crombie IK, Clark RA, Warner FC: The facilitator effect: results from a four-year follow-up of chil-dren with asthma.Br J Gen Prac 1997, 47:156-160.
29. Fullard E, Fowler G, Gray J: Facilitating Prevention in Primary Care.BMJ 1984, 289:1585-1587.
30. Leininger LS, Leonard F, Larry D, Dietrich AJ, Foxhall L, Garr D, Stew-art B, Wender R: An Office System for Organizing Preventive Services. A Report by the American Cancer Society Advi-sory Group on Preventive Health Care Reminder Systems.
Arch Fam Med 1996, 5:108-115.
31. Kottke TE, Solberg LI, Brekke ML: A controlled trial to integrate smoking cessation advice into primary care: doctors helping smokers, round III.J Fam Pract 1992, 34:701-708.
32. Hulscher ME, van Drenth BB, van der Wouden JC, Mokkink HG, van Weel C, Grol RP: Changing preventive practice: a controlled trial on the effects of outreach visits to organise prevention of cardiovascular disease.Qual Health Care 1997, 6:19-24. 33. Dietrich AJ, Sox CH, Tosteson TD, Woodruff CB: Durability of
improved physician early detection of cancer after conclu-sion of intervention support. Cancer Epidemiol Biomarkers Prev
1994, 3:335-340.
34. Dietrich AJ, Tobin JN, Sox CH, Cassels AN, Negron F, Younge RG, Demby NA, Tosteson TD: Cancer early-detection services in community health centers for the underserved. A rand-omized controlled trial.Arch Fam Med 1998, 7:320-327. 35. Baskerville NB, Hogg W, Lemelin J: Process evaluation of a
tai-lored multi-faceted approach to changing family physician practice patterns and improving preventive care.J Fam Pract
2001, 50(3):W242-249.
36. Lemelin J, Hogg W, Baskerville N: Evidence to action: a tailored multifaceted approach to changing family physician practice patterns and improving preventive care. CMAJ 2001,
164(6):757-763.
37. Drummond MF, O'Brien B, Stoddart GL, Torrance GW: Methods for the Economic Evaluation of Health Care Programmes New York: Oxford University Press; 1997.
38. Olivotto IA, Kan L, Mates D, King S: Screening Mammography Program of British Columbia: pattern of use and health care system costs.CMAJ 1999, 160(3):337-41.
39. Helliwell BE, Drummond MF: The costs and benefits of prevent-ing influenza in Ontario's elderly. Can J Public Health 1988,
79(3):175-180.
40. Porter GA, Cantor SB, Ahmad SA, Lenert JT, Ballo MT, Hunt KK, Feig BW, Patel SR, Benjamin RS, Pollock RE: Cost-effectiveness of
stag-ing computed tomography of the chest in patients with T2 soft tissue sarcomas.Cancer 2002, 94(1):197-204.
41. Helms LJ, Melnikow J: Determining costs of health care services for cost-effectiveness analyses: the case of cervical cancer prevention and treatment.Med Care 1999, 37:652-671. 42. Salzmann P, Kerlikowski K, Phillips K: Cost-effectiveness of
extending screening mammography guidelines to include women 40 to 49 years of age. Ann Intern Med 1997,
127(11):955-965.
43. Nichol K, Margolis K, Wouremna J, von Sternberg T: Effectiveness of influenza vaccine in the elderly.Gerontology 1996, 42:274-79. 44. Jacobs P, Hall EM: Estimating the cost of outpatient hospital
care.Healthc Manage Forum 1995, 8(4):36-38.
45. International Agency for Research on Cancer Working Group on Evaluation of Cervical Screening Programmes: Screening for squamous cervical cancer: duration of low risk after negative result of cervical cytology and its implications for screening policies.BMJ 1986, 293:659-664.
46. Fahs MC, Mandelblatt J, Schechter C: Cost effectiveness of cervi-cal cancer screening for the elderly. Ann Intern Med 1992,
117:520-527.
47. Canadian Institute for Health Information. Circulatory Sys-tem Diseases per 100,000 Population by Province [http:// qstat.cihi.ca/]
48. Gaudette LA, Altmayer CA, Wysocki M, Gao R: Cancer incidence and mortality across Canada.Health Reports 1998, 10(1):51-66. 49. Gift T, Walsh C, Haddix A, Irwin KL: A cost-effectiveness
evalu-ation of testing and treatment of Chlamydia trachomatis infection among asymptomatic women infected with Neisse-ria gonorrhoeae.Sex Transm Dis 2002, 29(9):542-551.
50. Centers for Disease Control and Prevention: Recommendations for the prevention and management of Chlamydia trachom-atis infections.MMWR Recomm Rep 1993, 42(RR-12):1-39. 51. Waitzman NJ, Scheffler RM, Romano PS: The Cost of Birth Defects:
Esti-mates of the Value of Prevention Lanham, Maryland: University Press of America; 1996.
52. Filak AT, Ricer JS, Ricer RE: Lifetime costs for preventive medi-cal services: A Model.J Fam Pract 1999, 48(9):706-10.
53. Earle C, Coyle D, Wells GA, Papadimitropoulous E: A needs based assessment of breast cancer in Canada: the economic burden of illness Vol-ume 15. Annual Meeting of the International Society of Technology Assessment in Health Care; 1999:87.
54. Lave JR, Fine MJ, Sankey SS, Hanusa BH, Weisfeld LA, Kapoor WN:
Hospitalized pneumonia: Outcomes, treatment patterns, and costs in urban and rural areas. J Gen Intern Med 1996,
114:15-22.
55. CDC: Recommendations for the use of folic acid to reduce the number of cases of spina bifida and other neural tube defects.MMWR Recomm Rep 1992, 14(RR-14):1-7.
56. Ontario Case Costing Initiative [http://www.occp.com.] 57. Ontario Health Insurance Schedule of Benefits and Fees
[http://www.health.gov.on.ca/english/providers/program/ohip/sob/ sob_mn.html]
58. Krahn MD, Coombs A, Levy IG: Current and projected annual direct costs of screening asymptomatic men for prostate cancer using prostate specific antigen. CMAJ 1999,
160(1):49-57.
59. Hogg W, Baskerville N, Nykiforuk C, Mallen D: Improved preven-tive care in family practices with outreach facilitation: under-standing success and failure. J Health Serv Res Policy 2002,
7(4):195-201.
Pre-publication history
The pre-publication history for this paper can be accessed here: