Rochester Institute of Technology
RIT Scholar Works
Theses
Thesis/Dissertation Collections
6-25-1990
Preparation of a bank of cloned genes from the
chromosome of Agrobacterium tumefaciens and
the isolation of genes involved in DNA repair and
genetic recombination
Geoffrey A. Bartholomeusz
Follow this and additional works at:
http://scholarworks.rit.edu/theses
This Thesis is brought to you for free and open access by the Thesis/Dissertation Collections at RIT Scholar Works. It has been accepted for inclusion
in Theses by an authorized administrator of RIT Scholar Works. For more information, please contact
ritscholarworks@rit.edu
.
Recommended Citation
Rochester Institute of Technology
College of Science
Preparation of a bank of Cloned Genes from the Chromosome
of
Agrobacterium Tumefaciens
and the Isolation of Genes
involved in DNA Repair and Genetic Recombination
by
Geoffrey A. Bartholomeusl
A master's thesis, submitted to
The Faculty of the College of Science,
in partial fulfillment of the requirements for the degree of
Master of Science in Clinical <;hemistry
25th June 1990
Thesis Committee:
Dr. Robert Rothman
Dr. Howard Harrison
Form
10
M.S. Clinical Chemistry
ROCHESTER INSTITUTE OF TECHNOLOGY
Rochester, New York
14623
Department of Clinical Sciences
STATEMENT FOR GRANTING OR DENYING PERMISSION TO REPRODUCE THESIS
The author of a thesis or formal research report should complete one of the
following statements and include this statement as the page of the document
following the title page.
If the author does not wish to give permission to
reproduce the document, then the first page will be both statements typed but
not fi lled in.
Title of Thesis or Research Report
Preparation of a bank of Cloned
Genes from the Chromosome of Agrobacterium tumefaciens and the
Isolation of Genes
involved
in DNA Repair and Genetlc Recomblnatlon.
I,
Geoffrey A.
Bartholomeusz
, hereby (grant,
'iEl£R)t)
permission
to the Wallace Memorial Library of R.I.T., to reproduce the document titled
above in whole or in part.
Any reproduction will not be for commercial use
or profit.
OR
I,
GeoffreyA Bartholomell57
,
prefer to be contacted each time
a request for reproduction is made.
I can be reached at the following address:
ABSTRACT
The
virulentproperty
ofthe
Agrobacterium
tumefaciens
is
associated withits
tumor
inducing
(Ti)
plasmid.Recent
studies onthe
virulence ofthis
bacterium
has
shownthat
genes
located
onits
chromosome also contributeto this
property.One
such geneis
thought
to
produce a proteinthat
has
properties similarto that
ofthe
recA protein ofE.
colt.This
thesis
outlinesthe
techniques that
were usedto
try
andisolate
the
recA-like genefrom
the
chromosome ofthe
Agrobacterium
tumefaciens.
All
the techniques
usedin
this
study
are outlined
in detail
and an explanation givenfor
the
choice of eachtechnique.
For
reasons notcompletely
understood, we were unableto
isolate
the
recA-like gene eventhough
a genebank
wassuccessfully
constructed andappropriately
sizedfragments
extracted.Attempts
were madeto
explain some ofthe
unexpected results and appropriate steps were proposedto
ACKNOWLEDGEMENTS
To
begin
withI
recordmy
deep
appreciationto my
supervisorDr.
Robert Rothman for
granting
methe
opportunity
to
work onthis
project.I
thank
him
for
the
unfailing courtesy
andgenerosity
with whichhe
extendedto
methe
benefits
ofhis
guidance, experience, and advice.I
oweDr. Joseph
Devine
my
thanks
for
granting
me permissionto
conductthis
research projectin
the
area ofMolecular Biology.
I
also recordmy
specialthanks to
Frank Pendola
for his
ready
helpfulness,
andfor
the
many
profitablediscussions
wehad
on matters connected withmy
work.I
would alsolike
to
expressmy
thanks to
Beverly Frisell-Fleig
for
the willing
assistance she gave mein
the
early
stages ofthis
project.I
owe a special expression ofthanks to
my
brother Brian
for his
generosity
in
granting
mehis
time
and expertisein
the
final
presentation ofthis
research project.My
wifeChandra
was a great supportto
meby
her
confidence and understanding.I
oweher
morethan
I
can express.TABLE OF
CONTENTS
TABLE
OF
CONTENTS
i
TABLE
OF
FIGURES
ii
TABLE
OF TABLES
iii
CHAPTER 1.
INTRODUCTION
1
(1.1)
Background
1
(1.2)
Purpose
ofResearch
10
CHAPTER 2.
MATERIALS AND METHODS
11
(2.1)
Table
ofBacterial Strains
11
(2.2)
Properties
ofthe
Restriction
Enzymes
11
(2.3)
Restriction
digestions
ofthe
Agrobacterium
chromosome12
(2.4)
Sucrose
Gradient
12
(2.5)
Restriction
Digestion
of pUC913
(2.6)
Bacterial
Alkaline Phosphatase Reaction
ofthe
Restricted
puC913
(2.7)
Ligation Mix
14
(2.8)
Transformation
ofE.
coli14
(2.9)
Plasmid Mini
Prep
15
(2.10)
Isolation
ofPlasmid DNA
16
(2.11)
Conjugation
17
(2.12)
Replica
Plating
17
(2.13)
Preparation
ofIngredients
18
CHAPTER 3. RESULTS
20
(3.1)
Preparation
ofthe
Chromosomal Fragment
20
(3.2)
The Sucrose Gradient
24
(3.3)
Restriction Digestion
of pUC928
(3.4)
Transformation
ofE.
coli28
(3.5)
Mini
Prep
oftransformed
E.
coli33
(3.6)
Isolation
of plasmidDNA
39
(3.7)
Conjugation
40
CHAPTER 4. DISCUSSION AND CONCLUSIONS
43
(4.1)
Discussion
43
(4.2)
Summary
andConclusions
45
TABLE
OF
FIGURES
Figure 1.
LexA
controlled recombination3
Figure 2.
RecA
controlled recombination6
Figure 3.
RecA
controlled repair ofDNA dimer
causedby
UV
exposure7
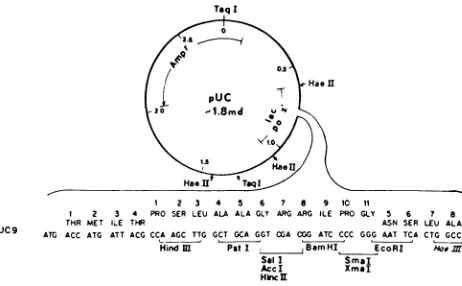
Figure 4.
Genomic
construction of pUC99
Figure
5.
Techniques
ofReplica
Plating
18
Figure
6a.
An
0.8%
agarose gelshowing
fragment distribution
of sampleswith
varying
enzyme concentrations andtime
ofincubation
22
Figure 6b.
An
0.8%
agarose gelshowing
fragment distribution
of sampleswith
varying
enzyme concentrations andtime
ofincubation
(contd.)
23
Figure 7.
The
loading
ofthe
sucrose gradient25
Figure 8.
An
0.8%
gel of sucrose gradient26
Figure 9.
An
0.8%
gel ofclosely
related samples27
Figure 10.
An
0.8%
gel ofthe
dialyzed
sample29
Figure
11.
An
0.8%
gel of a second sucrose gradient30
Figure 12.
An
0.8%
gel of purified chromosomalfragment
31
Figure
13.
Formation
of a recombinantDNA
library
32
Figure
14.
Pattern
ofthe
parent platecontaining
transformed
E.
coliharboring
the
recombinant plasmid34
Figure 15a.
An
0.8%
gel of recombinant plasmids37
Figure
15b.
An
0.8%
gel of recombinant plasmids38
Figure
16.
Conjugation
ofJC 8563
andBRC 49
42
Figure 17.
An
0.8%
gel of recombinant plasmids withinadequate
fragment inserts
44
TABLE
OF TABLES
Table 1.
Restriction
digestions
ofthe
Agrobacterium
chromosome12
Table 2.
Amplified
restrictiondigestion
24
CHAPTER
1
INTRODUCTION
(1.1)
Background.
Since
1907.
Agrobacterium tumefaciens.
a gram negative soil organismhas been
recog
nized asthe
etiological agent ofCrown
gall.Crown
gallis
a neoplasticdisease induced in
a widevariety
of gymnosperms anddicotyledonous
angiospermsby
the
inoculation
of wound sites withthe
bacterium. The
virulencetrait
ofthis
bacterium is
carried on one of a numberof
tumor
inducing
(Ti)
plasmids.23This Ti
plasmidis
large,
and rangesin
sizefrom
90
x 106to
150
x 106 daltons.23It is
essentialfor
tumorigenesity.10The
Ti
plasmid ofAgrobacterium
tumefaciens
containstwo
major groups of genesthat
areimportant for
the
establishmentof neoplastic growth of
infected
tissue
in many diverse
plants.3The first
group
of genesis
contained withinthe
T-region
ofthe
Ti
plasmid.This is
the
segment ofthe
Ti
plasmidthat
is
transferred
to the
host
plant andbecomes
integrated
in
the
genome ofthe
host
plantduring
tumorigenesis.3'25These
genesdirect
the
production ofopines,namely
octopine and nopaline, as well asthe
production of growthregulating
hormones.3They
alsodetermine
the
morphology
ofthe
tumor that
resultsfrom
the
infection.3The T-DNA is flanked
onthe
Ti
plasmid
by
short,imperfect
repeatsthat
comprisethe
structural andfunctional
termini
ofthe
T-DNA.25The
secondgroup
of genes onthe
Ti
plasmidis
containedin
the
virulence(vir)
region.This
regionis 35 kilobases
long
andis
situated outsidethe
T-DNA
region.21The
vir regionis
expressedin
the
bacterium
particularly
during
the
interaction
between
the
bacterium
and
the
plant cell.3Mutations
in
the
vir region resultin
the
loss
ofvirulence.3The
vir genesare
thought to
encodefunctions
that
arenecessary
for
the
transfer
ofthe
Ti
plasmidsinto
plant cells, although,
they
themselves,
have
notbeen found in
tumor
cells.7Most
Ti
plasmidsfall into
oneoftwo
groupsdepending
on whetherthey
codefor
octopine or nopaline catabolism.23Strains
harboring
an octopine-typeTi
plasmidgenerally
induce
un organizedtumors
that
produceoctopine. while strainsharboring
the
nopaline-typeTi
plasmidusually
induce
teratomas,
althoughthey
too
can produce unorganizedtumors.
Ornithine is
animportant intermediate
of octopine and nopaline degradation.20Ornothine
is degraded
to
glutamic semialdehyde which
in
turn
is
convertedto
glutamate.This
glutamate providesthe
carbon source
for
the
bacterium.20Although
the
Ti
plasmidis
clearly
aprimary
determinant
of virulence.16there
is
nowto
the
plant cells.17Most
ofthe
evidence suggeststhat
chromosomally
encodedfunctions
areprimarily
responsiblefor
the
attachmentability
ofAgrobacterium
tumefaciens.7As is
the
casein E.
coli.there
may
alsobe chromosomally
encoded genesin
Agrobacterium
tumefaciens
that
codefor
the
function
ofDNA
repair and genetic recombination.If
the
Agrobacterium
tumafaciens
are exposedto
U.V. light
or mitomycinC
priorto
their
infection
of plantsthey
acquire an enhancedtumor
forming
ability.11The
precise mechanism ofthis
enhancedtumor
forming
ability
in
Agrobacterium
tume
faciens is
notclearly
understood,
but it is
thought
to
be
very
similarto the
inducible
DNA
repair system of
E.
coli.namely
the
S.O.S.
repairsystem.29A
discription
of some well studiedDNA
repair systems ofE.
coliis
necessary
atthis
point, sinceit
will give me abasis for
comparison
in
my
endeavourto
try
and explainthe
mechanismsinvolved in
genetic recombination and ultravioletlight
resistanceby
the
Agrobacterium
tumefaciens.
Since
anE.
coli cell can often regulatethe
expression of a geneaccording to
a need ofits
productsit is
notsurprising
that
many
DNA
repair enzymes areinduced
by
DNA
damage.
The
mostimportant
and extensive
group
consists ofthe
S.O.S.
genes,that
areinduced
by
damage
severe enoughto
stop
DNA
synthesis.27For
example, when exposedto
U.V. light
pyrimidinedimers
areformed in
aDNA
strand.These dimers
cannotbase
pair.When
areplicating
fork
meets such adimer,
replication stops andis
re-initiated a shortdistance
pastthe
dimer.27The
resultis
agap
in
the
newly
synthesized strand and an exposed single strandedDNA
template.
RecA,
one ofthe
moreimportant
E.
coliSOS
proteins recognizesthis
single strandedDNA
andbinds
ontoit. Besides
initiating
DNA
strand exchange andthus
recombinational repair,the
recA proteinhas
athird
enzymaticfunction
entirely
separatefrom
recombination.It
acquires a proteolyticfunction
anddestroys
the
lex A
repressor.When
present,the
lexA
protein maintainsthe
S.O.S
genes
in
a state of repression.27In
this
mannerthe
recA protein promotesDNA
repairboth
by
recombination andby
initiating
the
induction
of aboutfifteen S.O.S.
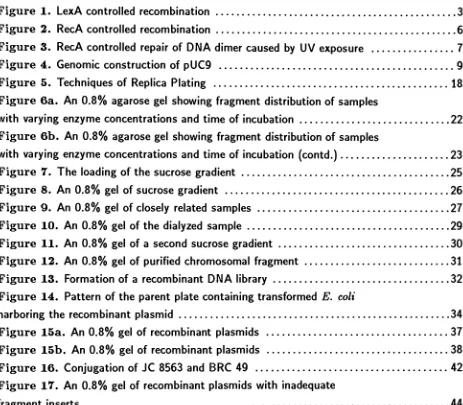
genes.By destroying
the
repressor action oflexA,
recA alsoincreases
the
synthesis ofitself
(see
Fig.
I).27The
increase
concentration of recAin
the
cell will enhancethe
recombination ofthe
bacterial
genes withthat
ofthe
plant genome.This
couldbe
the
reasonbehind
the
enhancedtumor
forming
ability
ofthe
bacteria
after exposureto
ultravioletlight. Although
the
responseto
U.V.
light
is
considerably
more effectivein E.
coli as compared withAgrobacterium
tumafaciens}9it
has been
clearly
demonstrated
that
like E.
colithe
genesresponding
to
U.V. light
and mitomycin
C in
Agrobacterium
tumafaciens
arelocated
in
the
chromosome.19
Such
genes arevery
important for
the
survival ofthe
bacterium.
In
E.
colithese
geneshave been
very extensively
studied.8'18'26
Pari
ofexcisionrepairenzyme
Unknown
Unknown
Repressor
Unknown
Pari
ofexcision repairenzymeCell division
control Error-pronerepair
[image:11.531.83.454.152.494.2]correction enzymes and
the
S.O.S.
repair proteins such as umuC and umuD.8'26Among
this
collection of gene productsit is
the
rec proteinsthat
play
animportant
rolein DNA
recombination and repair.
To date 13
rec proteinencoding
genesinvolved
in DNA
repairand recombination
have
been
identified.18These
are recA, B. C. D, E, F. J, N, 0.
ruv,
sbcb and csb.18
The
recA protein plays perhapsthe
mostimportant
rolein DNA
repair andrecombination
in
this
group.The
recA gene wasfirst isolated
by
Clark
andhis
colleaguesin
1965.
8The
normallevel
ofthis
proteinin
the
cellsis
about2000
molecules per cell.This level
increases
to
ashigh
as50.000
molecules per cellfollowing
the
exposure ofthe
cellto
DNA
damaging
agents.18Some
of
these
agents are ultravioletlight,
nalidixicacid,
bleomycin
and mitomycin C.18Before
trying
to
understandhow
the
recA proteinfunctions
in DNA
repairit is important
to
understandits
mode of actionduring
DNA
recombination.DNA
recombinationis
afundamental
reactionin providing
diversity
to
genes.In
basic
terms, DNA
recombinationinvolves
the
making
of abase-pair
hybrid
by joining
two
DNA
molecules.26In
orderfor
the
recA proteinto
be
ableto
function
effectively
the
DNA
has
to
be
single stranded.This
was shownto
be
the
case whenit
was observedthat
no reaction occurred whentwo
homologous,
but completely
base-paired
helixes
were mixed with recA protein.26When
the
recA protein encounters a single stranded piece ofDNA it binds
to
it. The
ratio of
binding
is
approximately
one polypeptideto
five
nucleotides.26The
recA proteinscompletely
coverthe
DNA
strand.This
single strandedDNA
withthe
bound
recA proteinsis
referred
to
asthe
recA filament.26As
every
recA proteinbinds
ontothe
single strandedDNA
it simultaneously binds
a molecule ofATP
At
this
stage ofthe
reactionthe
ATP
attachedonto
the
recA proteinis
nothydrolyzed but is instead
carriedalong
unchanged.26The
ATP
bound
recAfilament
next wraps around ahomologous
strand ofdouble helical DNA. The
bonds
holding
the
recAfilament
ontothe
double
strandedDNA
areformed
between
the
nucleotides ofthe
single strandedDNA
andthe
nitrogen and oxygen atoms ofthe
bases
ofthe
double
strandedDNA
that
extendinto
its
groves.26
Thus
the
recAfilament
andthe
double
stranded
DNA
are notheld
together
by
the
usualWatson/Crick
base
pairing.Once
binding
has
occurredthe
recAfilament
then
movesalong
the
double
helix
untilit
reaches a region ofbase
complementation.
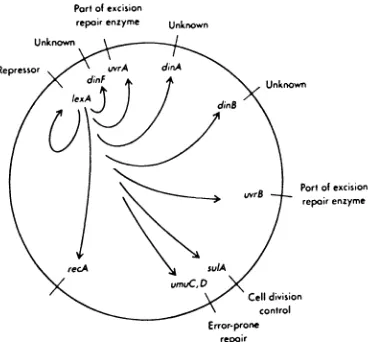
When
this
has been
achievedthe
recA protein meltsthe
double
helix
atthe
point on complementation.
This leads
to the
separation ofthe
strands ofthe
double
helix.
The
recA protein
then
initiates
the
annealing
ofthe
single strandedDNA
ontoits complementary
sequence of
the
melteddouble helix.
Once
a small segment ofthe
single strandedDNA is
properly
annealed ontothe
double
helix,
the energy
generatedfrom
the
hydrolysis
ofthe
ATP
bound
to
the
recA proteindrives
the
pairing
reactionto
completion,moving in
the
5'to
3'direction
relativeto
the
singlestrand.26
is formed. While
the
hybrid
is
being
formed,
the
non-complementary
strandis
displaced
suchthat
whenthe
new single strandis completely
annealedto
its
complementary
strandthe
displaced
strandforms
aloop
aroundthe
hybrid.26This
loop
is
referredto
asthe
D-loop.
This
D-loop
is
cut outby
the
action of nucleases andthe
gapsformed
by
its
removal arefilled
by
the
DNA
polymerase.The
free
ends ofthe
newly
inserted
single strandedDNA
arejoined
by
DNA
ligase,
completing
the
process ofrecombination
(see
Fig.
2).27This
same reaction canform
abridge between
two
separateduplex DNA's if
one ofthem
contains a single stranded region.
Breaks
as well as gapsin
DNA initiate
recombinationbecause
they
provide sitesfor
nucleasesto
degrade
one strand ofthe
duplex.
These
gapsalso enable
unwinding
enzymesto
enterthe
duplex
and startto
unwindthe
duplex,
giving
rise
to
single strandedDNA.
whichthe
recA protein canbind
onto.A
goodinitiator
of recArecombinational repair
is damage
causedto
duplex DNA
onbeing
exposedto
ultravioletlight.
This leads
to
the
production of pyrimidinedimers in
the
DNA. Most
ofthese
dimers
areremoved
by
the
excision repair enzymes.8'26This is
usually
the
casein
aDNA
strandthat
has
not yet
been
replicated.Post
replication repair ofDNA
onthe
otherhand is
carried outby
the
recA protein.8'26
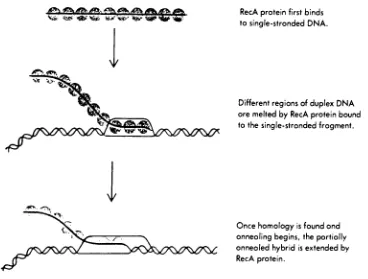
The
mechanism of recA controlled post replication repairis
diagrammatically
presented
in
Figure
3.8Post
replication repairdeals
with a pyrimidinedimer
(A)
that
interferes
with replicationduring
whichthe
parental strands are synthesized..1.Other dimers
(B
andC)
arehandled
by
excision repair enzymes.Dimer(A)
preventsbase-pairing
along
a stretch of one parentalstrand,
producing
a post replicationgap
opposite a stretch of single strandedDNA.
.2.RecA
protein
binds
to this
single stranded region..3., and alignsit
with ahomologous
region ofthe
sister
duplex.
When homologous
pairing
is
achieved, an enzyme nicksthe
duplex.
.4.RecA
protein switches
the
free
end ofthe
duplex's
parental strandinto
the
gap.producing
a crossedstrand exchange..5.
The
upperheteroduplex
can nowbe
repairedby
DNA
polymerase1. With
the
correct sequencein
place oppositedimer
(A),
and with recA released,dimer
(A)
is
dealt
with
by
excision repair enzymes..6.Finally,
two
cuts are madeby
an enzyme atthe
site ofthe
crossed strand exchange..7.,
resolving
the
recombination process andproducing two
intact
heteroduplex
molecules..8.Another important
role playedby
the
recA proteinis in
the
S.O.S.
repair system.8'26This is
a systemthat
is found in
cells and used as afinal
effortby
a cellto
remain viableafter all
the
other repair systemshave been
overpoweredby
the
DNA
damage.
These S.O.S.
enzymes
have
the
ability
to
alterthe
function
ofthe
DNA
polymerase111.,
sothat
it bypasses
the
dimer
site.It does
this
by
placing
bases
at random oppositethe
dimer.26
Although
this
procedure
leads
to the
formation
ofmutations atthe
site ofdamage,
it
protectsthe
cellfrom
VA- ' iSfe1^ --'*' *>>.'
qfp
qp
^
V
.4**..<^,!^oW?<^Ai<i7<^:
RecA
proteinfirst binds
tosingle-stranded
DNA.
Different
regions ofduplex DNA
aremelted
by
RecA
proteinbound
to thesingle-stranded
fragment.
Once
homology
isfound
andannealing
begins,
thepartiallyannealed
hybrid
isextendedby
[image:14.531.87.455.225.504.2]RecA protein.
111111111111111111111111
rmnt^>iiuiiiiiiiiiiiiiiiiOiiiiii^?_
^"*^ __T\
^^lllllllllOnTTTTTI
><<ymiiiiiiiiiiiiiiiiiiiiiiiiiiiiiiiiiiiiMin
ftsgai
1 11
11 1 1 mnr
EXCISIONREPAIR
^m
1-llui aiirm1 1 1 1 1 1 1 1 11 11D$j|Hgp[
rrmrEXCISIONREPAIR
<^T LLLL1IILLLUJIIIIIIIIIIIIIIIIIIIIIIIIIIIIIIIIIIIIIII <<V
LLii.i,ui,Trmiiiiiiiiiiiiii
iiiiiii
RecAPROTEIN
I1IIIIIIIIIIIIIIIIIIII^~~T
1 1 1 1 IIi.,,llllllllllllllllllllll
IIIIIIIIIIIIIIIIIHIIIIITTTT1
1
11 1 1
11 1 1 1 1 1 1 1 1 1 1 1 1 1 1 1 1
1 1 1 1 1iTi
IIIIIIIIIIMIIIMIIIIIIIIIIIIIQ/-1,,,,,,,/
V\Im'f rrrra rm < ! ln 11111111111111111111111111111,'nm
lhhd
HETERODUPLEX
IIIIIIIIIIIIITnilllllllllllllimillllTTTT
IIIIIIIIIIIIIII1IIIIIIIIIIIITTTTT
HETERODUPLEX
1 1 1 1 1 1 1 1 1 1 1 1 1 1 1 1 1 1 1 111 11 111 1111 1 1 11 11 1 11
1 1
1 111 1 1 1 111 1 1 ITT\ /11 1 1 1 1 1 1 1 1 1 1 1 cut v( CUTD
i nirrm
11 1 1 1 1 1 1 1 1 1 1 1 1
1 1 I irrm
i";'''n 1 1 111 1 1 1 1 1 1 1 1,,
JHU
i iii
11n
1 1 1 1 1 1 1 1 1 1 1 1 1 111 1 11 1 1 1 1 1 1 11 1 1 ITTTm mmmi in iTTTTTl1 1 1 1 1 1 1 1 1 1 1 11
[image:15.531.118.403.30.560.2]i
li u j jjj 1 1
1
iiiJiii
j
iLnuiin Jij
1 1 1 1 li lljj 1 1
u
1 1 hi in ljj i
j
iTirrirrrEiTTiDNA is
that
it
nowfunctions
as a protease.In
this
form
it
then
binds
to the
lexA
repressorof
the
S.O.S.
system andinactivates it.
This
enablesthe
S.O.S.
systemto
be
turned
on.8'26In
orderto
be
ableto
identify
the
recA-like genefrom
among
the
very
large
collection ofchromosomal
fragments,
eachfragment
has
to
be
inserted into
a plasmid(see
Fig.
13). The
vector with
its inserted
fragment
can nowbe introduced into
the
host
bacteria
by
the technique
of
in-vitro
transformation.
The
vector usedin
this
experimentis
a plasmid.The
plasmidis
capable of autonomous extrachromosomal replication within
the
cellthereby
ensuring
the
introduction
ofthe
recombinant plasmidinto
every
daughter
cellduring
celldivision.
Thus,
asingle plasmid
introduced into
abacterium
will after afew
generations ofbacterial
growthbe
multiplied
into
alarge
number of copies.In
deciding
upon which vectorto
usefor
the
experimenttwo
important
criterianhad
to
be
taken
into
account.First,
the
bacteria
containing
the
plasmidhas
to
be
selectedfrom
those
that
do
not.This is done
by
introducing
a genecoding
for
the
resistance of a specific antibioticinto
the
vector.Thus,
by
growing
the
bacteria
on a mediumcontaining
this
specific antibioticit
willbe
noticedthat
only
the
bacteria
containing
the
vector will growin
this
medium.The
second criterion
is
to
be
ableto
identify
the
bacterial
cellscontaining
the
recombinant plasmidfrom
those
cellsthat
only
containthe
plasmid.That
is,
the
plasmid withoutthe
inserted
fragment.
A
plasmidthat
fits
these two
criteriais
the
plasmid pUC9(see
Fig.
4).
A
goodaccount on
the
geneology
ofthe
pUC plasmidsis
givenin
reference22.
The
pUC9is
a plasmidcontaining
2768 base
pairs.5
This
plasmidis
a modified pBR322
vector
containing the
ampicillin gene and an added polylinker site similarto that
ofthe
M13
MP
vector.5The
plasmid also containsthe
a peptide ofthe
lac
Z
gene.This
peptideis
276
base
pairs long,2 andis
situated about90
base
pairsdown
streamfrom
the
start codon ofthe
Lac Z
gene.When
pUC9is introduced into
ahost
E.
colithat
lacks
the
alpha peptidethat
is
astrain
that
produces a mutatedlacZ
protein andis
thus
unableto
produce3
galactosidace,the
a peptide of
the
pUC9 complements withthe
deleted
gene ofthe
host
chromosomeenabling
it
to
produce3
galactosidase.This
a complementation occursbetween
the
plasmid andthe
deleted host lacZ
genecausing
the
latter
to
become functional.
3
galactosidaseproducing
colonies can
be
easily
identified
by
one of afew
colortests
usedto
identify
the
presence ofthe
enzyme.In
this
experiment,the
bacterial
cells were grown onMacConkey
and ampicillinplates
[see
Sec.
(2.12)].
Colonies
producing the
enzyme were ableto
break down
the
lactose
present
in
the
mediainto
glucose and galactose.This
reaction reducesthe
acidity
ofthe
medium,
activating
a pHindicator
whichis
responsiblefor
the
red coloration ofthe
colonies.When
afragment
is
inserted into
the
vectorit does
soin
the
lacZ
generendering this
geneinactive.
Thus,
insert
bearing
plasmids willfail
to
complementthe
lac-genotype of an a
complementary
E.
colihost. The
plasmid transformants remain
TaqI
Haell
7 8 ARG ARG
9
ILE
1C 11
PRO GLY
mp9/pUC9
1 2
9
45
61 2 3 4 PRO SER LEU ALA ALA GLY ARG ARG ILE PRO GLY 5 6 7 6
THR MET ILE THR ASN SER LEU ALA
ATG ACC ATG ATT ACG CCA AGC TTG GCT GCA GGT CGA COG ATC CCC GGG AAT TCA CTG
GCC
Hind m
Pt I
BamHI
EcoRI
Ha* mSell
Ace I
HlncS
SmI
Xmil
[image:17.531.49.511.231.517.2]take
onthe
red coloration onthe
MacConkey
andlactose
plates4and appear as white colonies
on
the
medium.Other
tests that
canbe
usedto
identify
the
presence of3
galactosidase arethe
X-gal
test13'14and
the
lacZ
assay.14(1.2)
PURPOSE OF RESEARCH.
The
aim ofthis
projectis
to
prepare a genomiclibrary
from
the
chromosome ofthe
Agrobacterium tumefaciens.
andisolate
from it
a recA-like gene.CHAPTER
2
MATERIALS AND METHODS
(2.1)
Table
ofbacterial
strains.(Bethesda
Research
Laboratories
Catalog
andReference
Guide 1988).
JM 83: F-ara
A(lac
-proAB)
rpsl <80d/acZAM15 rm
HB
101:
F-hsdS20
r^m^
recA13/euB6
ara-14 proA2/acYl
galK2'
rpsL20(str+)zy/-5 mtll
DH 5
a:
F-<80d
/acZAml5
endAl recAlhsdRll
(r^m^)
supE44thi-2\~
gyrA96 reiki
A(/acZYA
araF) U169
BRC 49:
recA-. amp",isoleucine-.
valine-, meth-.JC 8563:
amp-, arg. pro.leu.
thr.
xyleneis
anHfr
strain withthe
fori
situated nearthe
progene.
(2.2)
Properties
ofthe
restriction enzymes.(New
England Biolab.
Catalog
1988-1989)
BamH 1 isolated from Bacillus
amyloliquefaciens.enzyme recognition site
I
5'
GGATCC
3'3'
CCTAGG
5'the
enzyme cleavesthe
recognition siteto
leave
a5'
GATC
extension which canbe
efficiently
ligated
to
DNA fragments
generatedby
BamHl.
Bell, Mbol,
Sau3A
1,
and
Xholl.
Sau3A 1
isolated from
Staphylococcus
aureus3A.
enzyme recognition site
5'...TGATC
3' 3'CTAG
5't
buffers
containing
6mM
of2-mercaptoethanol
have been
observedto
decrease
the
enzyme
activity
by
as much as50%.
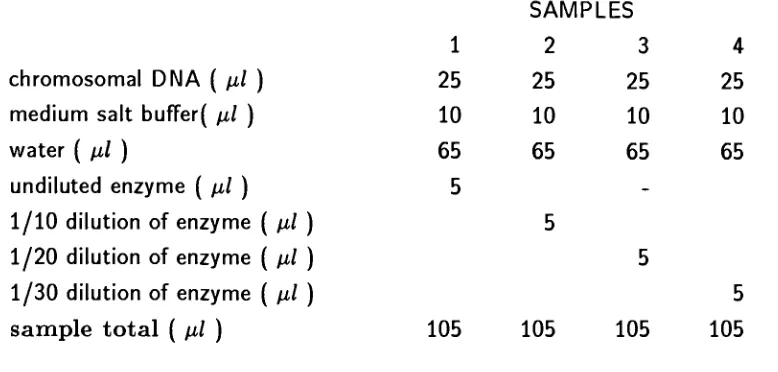
Table
1.
Restriction
digestions
ofthe
Agrobacterium
chromosome.chromosomal
DNA
(
pi)
medium salt
buffer(
pi)
water
(
pi)
undiluted enzyme
(
pi)
1/10 dilution
of enzyme(
pi)
1/20
dilution
of enzyme(
pi)
1/30 dilution
of enzyme(
pi)
sample
total
(
pi)
SAMPLES
1
2
3
4
25
25
25
25
10
10
10
10
65
65
65
65
5
_105
105
105
5
105
*
The
concentration of
the
chromosomalDNA in
the
25
pi wasapproximately
2.5
pg
(Stock
of chromosomal concentration;10
pi =1pg
ofDNA)
Hind 111 isolated from Haemophilus influenza Rd.
enzyme recognition site i
5'
AAGCTT
3'3'
TTCGAA
5'(2.3)
Restriction digestions
ofthe Agrobacterium
chromosome.The
restrictiondigestions
ofthe
Agrobacterium
chromosome aretabulated
in
table
1.
The
enzyme usedin
this
restrictiondigest
wasSau
3A 1
(see
section3.3)
The
digestion in
column
1 is
a complete restrictiondigestion.
In
this
casethe
enzymeis
undiluted and cuts allthe
available restriction sites onthe
DNA.
The digestion in
columns2
to
4
are partialdigestions.
In
this
casethe
enzymes arediluted
sothat their
concentrations arelow
and cutonly
afew
ofthe
restriction sites onthe
DNA.
(2.4)
Sucrose
Gradient.
10%
solution-20g
of sucrosedissolved in 200m/
ofthe
sucrose gradientbuffer
40%
solution80g
of sucrosedissolved
in
200m/
ofthe
sucrose gradientbuffer
[image:20.531.53.442.101.287.2]Preparation
ofthe
sucrose gradientbuffer:
IM NaCI
100ml
20mM Tris
pH7.6
10ml
5mM EDTA
5ml
water
385ml
total
volume500ml
-prepare a
35m/
sucrosegradient(10-40%
w/v)
in
a polypropylenetube(Beckman
S W
25).
-carefully
load
the
samplebeneath
the
meniscus ofthe
gradienttaking
care notto
disturb
the
gradient.load
the
gradient andDNA into
aS.W. 25
rotortogether
withtwo
other similartubes
containing
17m/
ofthe
40
%
sucrose solution and18m/
ofthe
10
%
sucrose solution.The latter
two tubes
serve asbalances.
-centrifuge
in
aBeckman
LS-50
at40.000
rpmfor 24 hrs
at15C.
collect
approximately 0.5m/
samplesstarting from
the
bottom
ofthe tube
andmoving
upwards.
(2.5)
Restriction digestion
of pUC9medium salt
buffer
2.5
piwater
9.5
pipUC9
10
piundiluted enzyme
(Bam)
3.0
piTotal
25.0
piThe
mixture wasincubated
at 37C for
two
hours.
(2.6)
Bacterial
Alkaline
phosphatase reaction of restricted pUC9.Two different
alkaline phosphatases are availablefor
this
reaction.These
arebacterial
alkaline phosphatase
(BAP),
and calfintestinal
alkaline phosphatase(CIP).
CIP is
usually
the
preferred enzyme
because
it is
thermolabile.
Upon
completion of aPhosphatase
reaction,
it is
necessary
to
remove orinactivate
the
enzyme.CIP
canbe inactivated
by heating
at68C
for
thirty
minutesin
the
presence of sodiumdedocylsulfate.
BAP
onthe
otherhand is
resistantto this treatment
and canbe
removedonly
by
several phenol extractions.In
this
experimentBAP
was usedto treat the
cut vector andthe
protocolfollowed
is
outlinedbelow.
1.
Add 5-10
units ofBAP
perpg
ofrestricted
DNA
2.
Incubate
at65C
for 45
minutes.3.
Extract
once withphenol,
once with a1:1
mixture
of phenol chloroform andonce with chloroform
(chloroform/isoamyl
alcohol24:1).
4.
Adjust
the
salt concentrationto
0.1 M NaCI.
5. Add
twice the
volume ofice
cold ethanol and placethe
mixture onice
for 10
minutes.
6. Centrifuge
the
mixturefor 5
minutesin
an eppendorf centrifuge.After
the
centrifugation,
removethe
supernatant and allowthe
pelletto
dry.
7.
Resuspend
the
dried
pelletin 50
pi ofTE
buffer.
The
vectoris
nowready
for
the
ligation
reaction withthe
fragment.
(2.7)
Ligation Mix.
The final
step
in
forming
the
recombinant plasmidis
the
insertion
ofthe
fragment into
the
Bam/BAP
treated
pUC9 vector plasmid.This
reactionis
carried outin
the
presence ofATP
andligase.
which areimportant
in assuring
atight
fix
ofthe
free
ends ofthe
fragment
and vector
to
form
a stable recombinant plasmid.The ligation
mix was prepared as outlinedbelow.
vector(pUC9)
34
pitarget(fragment)
34
piligation buffer
6
piATP
9
piT4
ligase
2
pisample
total
85
piThe ligation
mix was allowedto
react at refrigeratortemperature
overnight.On
the
nextday
the
ligation
mix washeated
at65C
for 20
minutes.This
wasdone in
orderto
denature
the
remaining T4
ligase.
The
recombinant plasmidis
nowready
to
be
introduced
into
the
host
E.
colicell.(2.8)
Transformation
ofE.
coli.-
4m/
of
LB broth
wasinoculated
with cellstaken
from
a singlecolony
ofE.
coli andincubated
at37C
overnight.-
0.2m/
ofthe
overnight culture was mixedinto 20m/
offresh LB broth
and ampicillin(50
pg
/ml)
andincubated
at37C
untilthe
opticaldensity
ofthe
cells reached about0.2.
-spin
down
the
cells at7000
rpmfor 10
minutes.
-resuspend
the
pelletin 0.05 M
calcium chloride and place onice for
onehour.
-spin
down
the
cells at7000
rpmfor 10
minutes.- resuspend
the
pelletin 1.5m/ 0.05 M
calcium chloride.
mix
100
pi of competent cells and10
pi ofthe
recombinant plasmid and placethe
mixture on
ice for 30
minutes.heat
shockthe
mixturefor
2
minutes at37C.
-mix
100
pi oftransformed
E.
coliinto 2m/
offresh LB
and ampicillin andincubate
at37C for 90
minutes.prepare
10-1. 10-2,
10-3 dilutions
of cells and plate eachdilution
on aMacConkey
ampicillin plate.
incubate
the
plates at37C for 48 hours.
(2.9)
Plasmid Miniprep.
-
inoculate 4m/
ofLB
and ampicillin with a singletransformed
colony
andincubate
the
culture at
37C
overnight.
-add
1.5m/
ofthe
overnight cultureinto
an eppendorftube
and spindown
the
cellsin
amini centrifuge
for
5
minutes.- resuspend
the
pelletin
100
pi ofGET buffer
andlet
the
mixture stand at roomtemper
ature
for 5
minutes.- add
200
pi offreshly
preparedSDS+NaOH
solution.Mix
by
gently
inverting
the tubes
a
few
times
and placethe tubes
in ice for
5
minutes.
-add
150
pi of cold potassium acetate pH4.8.
Mix
by
vortexing
the tube
upside andplace
in ice for 5
minutes.- centrifuge
for 10
minutes and transferthe
supernatantinto
a new eppendorftube.
-add an equal volume of a
1:1
phenol/chloroform extraction .Mix
by
vortexing
andcentrifuge
for 5
minutes.-
transfer
the
upper aqueouslayer into
a neweppendorf
tube
and repeatthe
phenol/chloroformextraction.
-transfer
the
upper aqueouslayer
into
a neweppendorf
tube
and add1ml
of95%
ethanol.Vortex
to
mix andlet
the
mixture stand at roomtemperature
for 5
minutes.- spin
down
the
cellsfor 5
minutes.- pour off
the
supernatant anddry
the
pellet.resuspend
the
pelletin
50
pi ofTE buffer
andRNase.
(
2.10)
Isolation
ofPlasmid
DNA.
-spin
down
the
overnight culture of200m/
in
aSorvall GS-A
rotor at7000
rpmfor 10
minutes.
-resuspend
the
pelletin ice
coldLB broth
andtransfer
the
mixtureto
a clean50m/
polypropylene centrifuge
tube.
spin
the
cellsdown
in
aSS-34
rotor at10,000
rpmfor 15
minutes resuspendthe
cellsin lml ice-cold
25
%
sucrose andkeep
onice
for
30
minutes.
-add
0.2m/
lysozyme.
mix well and place onice
for 10
minutes, add0.4m/ EDTA
mixwell and place
the
mixture onice for 10
minutes.add
1.6m/
ofTriton-100 lytic
mix.Mix
carefully
by
gently
inverting
the tube
afew
times
and
then
placethe tube
onice for 20
minutes.
-centrifuge at
17,000
rpmfor
30
minutes.
-transfer the
supernatantto
a clean plasticdisposable
tube.
-add
2m/ TES
and4.9
g
ofcesium chloride and shake
the
mixturegently
to
dissolve
the
cesium chloride.transfer the
sampleinto
aBeckman
"Ouick-Seal"
tube
andthen
add200
pi ofethidiumbromide.
fill
the
remaining
space ofthe
tube
with mineral oil.seal
the
top
ofthe tube
and placethe tube
in
aBeckman
ultracentrifuge rotor
-centrifuge at
40.000
rpmfor 48 hours
at15C.
at
the
end ofthe
centrifugation.carefully
removethe tube
from
the
rotor andcarefully
clamp
it
onto aring
stand.
-using
ahypodermic
needle,
puncturethe
top
ofthe tube
in
orderto
let
air enterthe tube.
-in
the
presence
of ultravioletlight,
identify
the
plasmidband. Then
using
a21-22
gaugeneedle attached onto a
5m/
syringe,
carefully
penetratethe tube
a centimeterbelow
the
plasmid
band.
angle
the
needleup
into
the
plasmidband
andcarefully
withdrawthe
band.
extract
the
ethidiumbromide
three
orfour
times
withisopropanol
saturated with cesiumchloride
dialize
the
samplein TE buffer
overnight with2
to
3
buffer
changes.(2.11)
Conjugation:
donor
strain:-J.C. 8563
recipient strain:-
BRC 49
procedure.
Transform
BRC 49
with recombinant plasmid.-
2m/
of
the transformed
cells arediluted into
8m/
offresh LB
and ampicillinbroth.
At
the
same
time
inoculate
4m/
ofLB broth
without ampicillin withJC
8653.
-
incubate
both
cultures at
37C
for 24
hrs.
transfer
lml
ofthe
overnight culture ofJC 8653 into 20m/
offresh LB broth
and growthe
cellsto
mid-log
phase.centrifuge
10m/
of overnightBRC
49
and resuspendthe
pelletin 10m/
offresh LB
withoutampicillin.
-mix
5m/
ofBRC 49
preparedin
step
six with10ml
ofJC 8563
preparedin
step
5.
incubate
the
mixture withoutshaking
at37C for 60
minutes.streak
the
mixture of cells on minimal selective agar plates andincubate
the
plates at37C
for 24
hours.
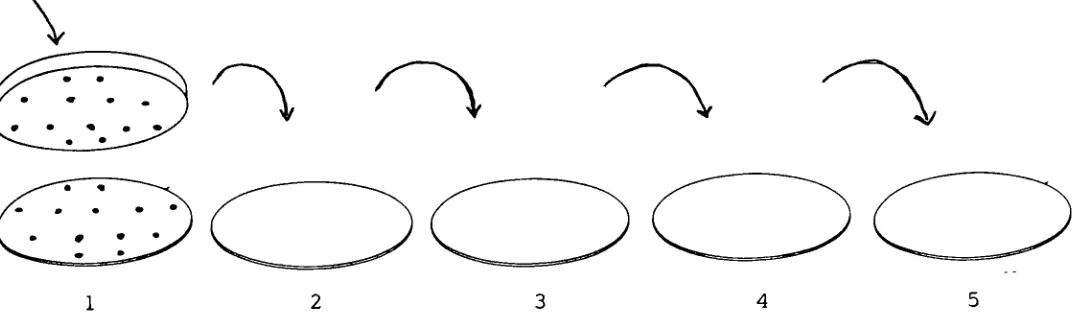
(2.12)
Replica
Plating
[see
Fig.
5].
Place
the
bottom
ofthe
woodenblock
whichis
coveredby
a piece of sterilized velvetfirmly
wrapped aroundit.
ontothe
surface ofthe
parent agar plate.Apply
sufficient pressureto
ensurethat
a significant amount of eachcolony
onthe
surface ofthe
agar adheres ontothe
velvet.Carefully
lift
the
block
away
from
the
parent platetaking
care notto
changethe
orientation of
the
print.Maintaining
this
orientation,carefully
placethe
velvet onthe
surface:rom
the
parent plateFigure 5.
Technique
of
Replica
Plating
of
the
fresh
plates.Apply
just
enough pressureto
makesurethat the
colony
printonthe
velvetis
transferred
to
each plate.The five
plates are printedin
turn
withoutreplacing
the
block
onthe
parent plate.By
maintaining the
same orientation ofthe
block
during
each print ensuresthat the
pattern ofcolony
distribution
in
each plateis identical
to
that
ofthe
parent plate.Incubate
the
five
plates at37C
for
24 hours.
(2.13)
Preparation
ofthe Ingredients.
MacConkey
andAmpicillin
agar plates.peptone
17g
proteose peptone
03g
bile
salts no.3
1.5g
sodium chloride
05g
agar
13.
5g
neutral red
0.003g
crystal violet
O.OOlg
N.B. All
these
ingredients
were premixedinto
adehydrated
powderby
the
manufacturer.40
g
ofthe
mixis
rehydratedin
aliter
ofdistilled
water and autoclaved.When
the
mixtureis
cool ampicillin
is
added sothat
its
final
concentrationis 50
pi/ml.
Pour into
platesbefore
the
agar solidifies.LB Broth
tryptone
10g
yeast extract
05g
sodium chloride
05g
water
1
liter
Mix
and autoclave.If LB
agarhas
to
be
prepared,
add15
g
ofagarinto
the
above mixbefore
autoclaving.
Pour into
platesbefore
the
agarhardens.
TE
Buffer
Tris
IM
(pH
7.6)
2
m/EDTA 0.5M
(pH
8)
0.4m/
water
197.6m/
GET Buffer
glucose
0.8g
Tris IM
(pH
8)
5
m/EDTA 0.5M
(pH
8)
4m/
water
191m/
Minimum-Selective
mediumpreparation of
the
medium:1000m/ distilled
water mix and autoclavefor 20
minutes50m/ 10x56 buffer
20 g
agarWhen
the
agar mixis
sufficiently
cool,but
warm enoughto
preventthe
agarfrom
solidifying
add
the
following
into
the
mixture.10m/
20
%
glucose0.2m/
0.1
%
vitBl
10m/
1
%
threonine
10m/
1
%
leucine
10m/
2
%
argenine02m/
2.5
%
thymidine
02m/
ampicillin(25
mg/ml)
mix well and pour
into
sterilized plates.CHAPTER
3.
RESULTS
(3.1)
Preparation
ofthe
Chromosomal
fragment.
In
orderthat the
genesbearing
the
recA-likeproperty
are not cutduring
digestion.it
becomes
essentialto
cutthe
chromosome ofthe
Agrobacterium
tumefaciens
into fragments
large
enough sothat
they
contain a complete gene.If
the
geneis
cutinto
separatefragments
it
becomes inactive.
Thus,
in
orderto
preventthe
cutting
ofthe
gene,
fragment
sizesranging
from
between
6
kilobases
to
14
kilobases
were chosen.The
chromosomalDNA
wasdigested
withthe
restriction enzymeSau3A 1
[see
Sec.
(2.3)].
In setting
up the
restrictiondigestion
it
becomes important
to
cutthe
chromosomeinto fragments
ofvarying
sizes sothat
eventually
the
appropriatefragment
range canbe
isolated. In
orderto
do
this, two
important
variableshave
to
be
taken
into
account.The
first
variable
is
the
concentration ofthe
enzyme.Before
deciding
uponthe
concentration ofthe
enzyme
to
be
usedit is important
that
oneis
aware ofthe
property
ofthe
particular enzyme.Sau3A
1 isolated from
Staphylococcus
aureusSa.
is
afour base
cutter whose recognitionsite
is
5'....GATC
3'.
One
unit ofthe
enzymeis defined
asthe
amount of enzyme requiredto
digest
one microgram ofDNA
in
onehour
atthirty
sevendegrees
centigradein
fifty
pi ofassay buffer
(New
England Biolab.).
Since
Sau3A
1 is
afour base
cutter,it becomes
obviousthat
if
the
concentration ofthe
restriction enzymeis
too
high,
the
chromosomalDNA
willbe
cut
into
avery large
number of smallfragments
being
oflittle
useto the
experiment.The
concentration ofthe
enzyme used was eight units of enzyme per pi .In
orderthat
the
chromosomebe
cutinto
appropriately
sizedfragments,
samples of chromosomes weremixed with
varying
concentrations ofthe
enzyme.The
concentrations ofthe
enzyme usedin
this
experiment are outlinedbelow;
5
pi of undiluted enzyme enzyme concentration =40
units5
pi of1/10 dilution
enzyme concentration =4
units5
pi of1/20
dilution
enzyme concentration =2
units5
pi of1/30
dilution
enzyme concentration =1.33
unitsThe
complete restrictiondigestion
is
tabulated
in
table
1
(see
page12).
The
second variableis
the
duration
ofincubation
ofthe
restrictiondigest
at37C. An
appropriate
time
spanhas
to
be determined
sothat the
chromosomewillbe
cutinto
fragments
of
the
desired
size range.(i.e:
6Kb-14kb)
All 4
samples outlinedin
table
2
were placedin
a37C
waterbath
together.
After
one minute of
incubation. 20
pi of each sample wastaken
out andintroduced into
a cleaneppendorf
tube.
The
restrictiondigestion
reactionin
eachtube
wasterminated
by
adding
40
pi of
1:1
phenolchloroform
mixture.This
same procedure was carried out after3.
5. 10,
and20
minutes ofincubation.
The
end result wastwenty
samplesdivided into five
groups.Group
1.
samples1-4
wherethe
reaction was stopped after1
minuteGroup
2.
samples5-8
wherethe
reaction was stopped after3
minutesGroup
3.
samples9-12
wherethe
reaction was stopped after5
minutesGroup
4.
samples13-16
wherethe
reaction was stopped after10
minutesGroup
5.
samples17-20
wherethe
reaction was stopped after20
minutesHaving
collectedthe
samplesin
eachgroup,
the
nextstep
wasthe
separation ofthe
fragments
in
each ofthe
twenty
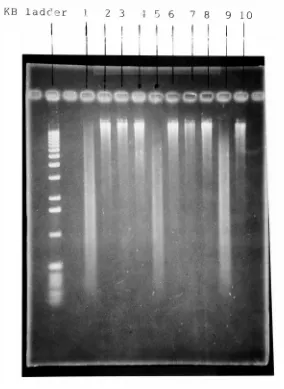
samples.This
was achievedby
running
the
samples on an0.8%
agarose gel electrophoretic plate.
The
result ofthis
gelis
shownin Figure 6.
(Figure
6b is
acontinuation of
Figure 6a).
By
observing
the
fragment distribution
onthe
electrophorized gelit
becomes
very
evidentthat
the
fragment distributions
of wells4,
5
and17
cover avery
wide range offragment
size.In
well4
almost allthe
fragments
arelarge
whilein
well17
almost allthe
fragments
weresmall.
Well
5
onthe
otherhand
containedfragments
ofintermediate
size.The
reasonwhy
the
samplesin
these
three
wells were chosenis
that there
is
anoverlap
offragment
size withinthese
wells.Thus,
pooling
these
samples preventsthe
possibility
ofleaving
out a samplecontaining
the
requiredfragment
size.From
the
results ofthis
initial digestion it
nowbecomes
possibleto
choosethe
appropriatereaction conditions
that
will producefragments
of uniform sizedistribution
ranging
from
smallto
large fragments.
These
reaction conditions canbe determined
by
going
back
to the
samplesthat
wereloaded into
wells4.
5
and17
ofthe
agarose gel.(a)
Well 4
contained sample4
(see
table
1.)
after one minute ofincubation.
(b)
Well 5
contained sample1
(see
table
1.)
afterthree
minutes ofincubation
(c)
Well 17
contained sample1
(see
table
1.)
aftertwenty
minutes ofincubation.
The
abovethree
reaction conditions were now repeatedbut
this time the
restrictiondigests
wereincreased
twenty
fold
so asto
contain about50
pg
of chromosomalDNA in
each sample
(see
table
2).
After
the
appropriate periods ofincubation
the
reactionsin
each samples wereterminated
by
adding
4200
pi of a1:1
phenol chloroform mixture.The
three
samples werethen
pooled.The
nextstep
in
the
experiment wasto
separatethe
fragments
of appropriate size contained
in
the
new mixture.A
precise separation ofthese
fragments
was achievedby
the
sucrose gradient sedimentation procedure
[see
Sec.
(2.4)].
KB
ladder
1
2
3
15
6
79
LO
Figure
6a.
An
0.8%
agarosegelshowing
fragment distribution
ofsamples withvarying
enzyme concentrations and
time
ofincubation.
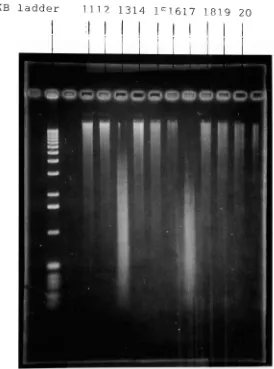
[image:30.532.113.397.81.470.2]KB
ladder
1 1
1
2
1314
1*1617
1819
20
1
1
[image:31.532.100.374.87.456.2]LMJ
|iiilwOQCOeGOOCi
Htf
1
Figure
6b.
An 0.8%
agarosegelshowing
fragment distribution
ofsamples withvarying
enzyme concentrations and
time
ofincubation,
(contd.)
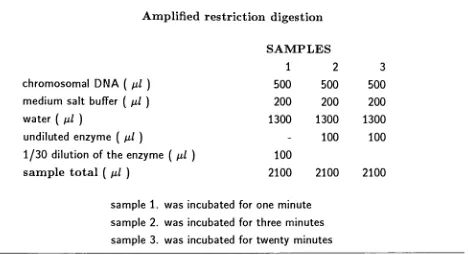
Table
2.
Amplified
restrictiondigestion
SAMPLES
1
2
3
chromosomal
DNA
(
pi)
500
500
500
medium salt
buffer
(
pi)
200
200
200
water
(
pi)
1300
1300
1300
undiluted enzyme
(
pi)
-100
100
1/30 dilution
ofthe
enzymeM)
100
sample
total
(
pi)
2100
2100
2100
sample
1.
wasincubated for
one minutesample
2.
wasincubated for
three
minutessample
3.
wasincubated for
twenty
minutes(3.2)
The
Sucrose Gradient.
The
two
concentrations of sucrose usedfor
the
gradient were a10%
solution and a40%
solution of sucrose.
Preparation
ofthe
sucrose solutions:When
the
sucrose gradient was prepared,the
sample of chromosomalfragments
wascarefully
loaded
ontothe
gradient.This
wasdone
by
gently
introducing
the
chromosomalfragments just beneath
the
meniscus ofthe
sucrose gradient.If
the
loading
step
is
correctly
executed,
the
DNA
canbe
seen as a concentrated massresting
ontop
ofthe
gradient(see
Fig. 7).
At
the
end ofthe
period of centrifugationthe
sucrose gradient wascarefully
taken
outof
the
ultra centrifuge.This
step
has
to
be
carried out with utmost carein
orderto
preventmixing
ofthe
fragments dispersed
withinthe
gradient.Using
the
narrow gaugedtube
whichis
once again passedthrough the
peristaltic pump,the
sucrose gradient andits
contents areemptied
(commencing
from
the
bottom
andmoving
upwards),into
acollecting
tray
containing
120
wells.Twelve
to
thirteen
drops
ofthe
extracted gradient wereintroduced
into
each well.The
first
well ofthe collecting
tray
contained a40%
sucrose solution.The
concentrationof
the
sucrose solutionthen
decreased
in
a gradientending
at a10%
sucrose solutionin
the
final
well ofthe
collecting
tray.
A
total
of120
wells wereloaded from
this
sucrose gradient. [image:32.531.33.501.57.312.2]DNA
sucrose gradient
Figure
7.
The
loading
ofthe
Sucrose
Gradient.
The
nextstep
wasto
determine
the
range ofthe
fragment
sizesin
each well.To be
ableto
detect
a changein fragment
size,
samples weretaken
from
every
fifth
wellstarting
withthe
first
well.20
pi samples were extractedfrom
the
chosen wells andintroduced into
an eppendorftube.
Into
eachtube
was also added5
pi oftracking
dye.
The
twenty
samples werethen
loaded
onto an0.8%
agarose gel.The
gel was run at120
volts untilthe
tracking
dye left
the
gel.
The
result ofthe
gelis
shownin Figure 8.
As
seenin
the
gel.
the
fragments
containedin
sample16
andbeyond
were so smallthat
they
mostlikely
moved offthe
gel.Using
the
Kb
ladder
as a size markerit is
notedthat the
fragments
containedin
sample10
rangedfrom
about6kb
to
14kb.
In
orderto
determine
a more precisefragment
rangethe
wellcorresponding
to
sample10
was
identified
onthe
collecting
tray.
Next,
samples weretaken
from
the
five
wellsimmediately
preceding
this
well andimmediately
following
this
well.These
eleven new samples were nowloaded
onto a gelin
the
sameway
as was outlined earlier.The
results ofthis
second gelis
shown
in Figure 9.
After
observing
the
secondgel.
samples1, 2, 3. 6. 8.
and11
werechosenfor
the
remaining
[image:33.531.136.404.31.308.2]0 rik\ 3r -fi ~o
Figure 8. An
0.8%
gel of sucrosegradient.sample
10
in
figure
8