RESEARCH NOTE
A training manual for event history analysis
using longitudinal data
Philippe Bocquier
1,2*, Carren Ginsburg
2and Mark A. Collinson
2,3Abstract
Objective: This research note reports on the activities of the Multi-centre Analysis of the Dynamics of Internal Migra-tion And Health (MADIMAH) project aimed at collating and testing of a set of tools to conduct longitudinal event history analyses applied to standardised Health and Demographic Surveillance System (HDSS) datasets. The methods are illustrated using an example of longitudinal micro-data from the Agincourt HDSS, one of a number of open access datasets available through the INDEPTH iShare2 data repository. The research note documents the experience of the MADIMAH group in analysing HDSS data and demonstrates how complex analyses can be streamlined and con-ducted in an accessible way. These tools are aimed at aiding analysts and researchers wishing to conduct longitudinal data analysis of demographic events.
Results: The methods demonstrated in this research note may successfully be applied by practitioners to longitudi-nal micro-data from HDSS, as well as retrospective surveys or register data. The illustrations provided are accompanied by detailed, tested computer programs, which demonstrate the full potential of longitudinal data to generate both cross-sectional and longitudinal standard descriptive estimates as well as more complex regression estimates. Keywords: Longitudinal data analysis, Demographic rates, Event history analysis, Health and Demographic Surveillance System
© The Author(s) 2019. This article is distributed under the terms of the Creative Commons Attribution 4.0 International License (http://creat iveco mmons .org/licen ses/by/4.0/), which permits unrestricted use, distribution, and reproduction in any medium, provided you give appropriate credit to the original author(s) and the source, provide a link to the Creative Commons license, and indicate if changes were made. The Creative Commons Public Domain Dedication waiver (http://creativecommons.org/ publicdomain/zero/1.0/) applies to the data made available in this article, unless otherwise stated.
Introduction
The Multi-centre Analysis of the Dynamics of Internal Migration and Health (MADIMAH) project was con-ceived in 2011 to provide much-needed evidence on relationships between migration and health in sub-Saha-ran Africa [1]. The project recognised the potential for Health and Demographic Surveillance Systems (HDSS) data to be employed using a standardised methodology and analytical framework to generate comparative results across diverse settings. HDSS monitor all births, deaths and in- and out-migrations in a geographically-defined population, generating prospective longitudinal data with a precise temporal dimension. Employing these data to produce evidence on migration dynamics has been the focus of the MADIMAH project.
Following the experience of the MADIMAH project, the International Network for the Demographic Evalu-ation of PopulEvalu-ations and their Health (INDEPTH) have facilitated the public release of HDSS data from low- and middle-income countries (LMIC) through the iSHare data repository [2]. To date there are 34 core standard-ised longitudinal datasets from HDSSs located in the African, Asian and Pacific Regions available in this open resource [3].
A central aim of MADIMAH has been to advance a set of tools for data management and application of event history analysis (EHA) to encourage the use of these high quality, publically available data. This initiative seeks to fill the gap in longitudinal population data available in LMIC, which are crucial to understanding popula-tion dynamics and their consequences. The objective of this research note is to document a set of EHA tools to produce reliable and comparable statistical results. The research note is accompanied by a training manual (Additional file 1) that guides the user through EHA, illustrating how to produce standard cross-sectional
Open Access
*Correspondence: [email protected]
1 Centre de Recherche en Démographie, Université Catholique de
Louvain, Place Montesquieu, 1 bte L2.08.03, 1348 Louvain‐la‐Neuve, Belgium
and longitudinal demographic rates and advanced EHA using individual-level datasets. These tools build on a previously published data management training manual [4] that was developed to guide users through a set of procedures to produce HDSS datasets in a harmonised structure.
The EHA methods illustrated in this research note and described in detail in the accompanying training manual (Additional file 1), represent a collection of tools for anal-ysis of longitudinal HDSS data. The MADIMAH project team has collated these methods based on its experi-ences of conducting multi-centre analyses of migration and mortality. The methods described have been tested on and applied to more than 30 HDSS datasets. Over the past 8 years, the MADIMAH team has brought together data managers, analysts and students from HDSS centres across sub-Saharan Africa to train on and apply these techniques to HDSS data. The accompanying manual, written in an accessible language but with the necessary statistical rigour, is targeted at researchers and analysts from multidisciplinary backgrounds (including demog-raphy, public health, epidemiology and statistics) who are interested in conducting longitudinal data analysis of demographic events.
Main text Methods
Traditionally, demographic estimates have been based on cross-sectional or aggregate data. These calculations of demographic rates, dominant in publications, usually involve estimating the population at mid-period of inter-est as well as a count of the number of events of interinter-est over the period. For example, a death rate that is com-puted according to the following formula requires that the total number of deaths in a population be counted and divided by the total mid-year population:
This is often estimated based on the population at the start of the year added to the population at the end of the year, divided by two. These methods suffer from inaccu-racies regarding the handling of events such as migra-tion, and cannot easily deal with the issue of censoring [5]. Also, with such aggregates, it is not straightforward to obtain cohort measures of probabilities except through the application of formulas that convert rates to prob-abilities using approximate average person-years lived in the age interval [5]. The event history analyses (EHA)
Crude death rate
= Total number of deaths in a given year total mid−year population
= D(t,t+n) (Pt+Pt+n)/2
approach allows for the computation of exact person-years, and can successfully handle right- and left-cen-sored data to produce estimates based on both calendar years and age groups. In addition to the computation of descriptive indicators (such as birth, death, in- and out-migration rates and probabilities), longitudinal data sources may be effectively utilised for more sophisticated EHA [6].
The analytic methods presented in this research note are illustrated using HDSS data but can also be applied to register or retrospective survey data. We use the Agincourt HDSS core micro dataset available for down-load through the INDEPTH iSHARE2 data repository [3]. The analytical dataset was extended to include data on causes of death (CoD) to exemplify the analysis of competing risks in the last section of the attached man-ual (Additional file 1), and these data are available upon reasonable request to the Agincourt HDSS site (https :// www.aginc ourt.co.za/). The Agincourt HDSS was estab-lished in 1992 and is located in the rural north-east of South Africa. The surveillance population currently com-prises over 90,000 individuals living in 11,500 households [7].
The core micro dataset, or core residency file, is a standardised file format containing the key events for each individual in the surveillance population with each event being documented as a single record. This type of dataset considers events that change the residency sta-tus of the individual (such as: enumeration, birth, death, in-migration, out-migration and end of observation). For each event, a corresponding event date is captured (see the MADIMAH team’s first manual of data management for more detail [4]).
The results below illustrate with the Agincourt HDSS micro data how to use standard commands available in most statistical software packages. Our illustrations and corresponding code in the attached manual (Addi-tional file 1) uses a suite of Stata® version 15 com-mands. We highlight below new techniques such as the cumulative incidence function for competing risks such a causes of death or the reverse-time for the computa-tion of in-migracomputa-tion rates. The results illustrate how a set of techniques applied to longitudinal HDSS data can be integrated to avoid unnecessary division between descriptive and more complex analyses.
Results
However, the hazard function need not be represented by age. Using the same data, one can represent the haz-ard function by calendar time, for the whole population but more often for a specific age group. Figure 1 is an illustration of hazard curves, with infant and child death hazards from 1 January 2013 to 31 December 2015.
One can clearly see a drop in infant mortality from 2009 (antiretroviral treatment were largely made avail-able free-of-charge from 2008 in the study area). The attached manual (Additional file 1) gives time-scale rec-ommendations for smoothing hazard rates in a mean-ingful way in relation to data collection precision in dates and proportion of events.
The above figure is for data exploration and for com-munication (to show levels and changes in trends) but may also be presented in tables. Two different indicators are used in the literature: rates and probabilities. Rates (nmx) most closely correspond to hazard rates except that
they are usually defined for conventional age groups [5]. They are defined as the number of events over the total person-years accounted for in a given age interval, as exemplified in Table 1. The attached manual (Additional file 1) shows how to produce such a table for each cal-endar periods to identify mortality, migration or fertility trends, e.g. by 5-year age group and 5-year period.
The other way to represent event intensity is through the survivor function that represents the probability to survive until a given age (nqx) for a synthetic cohort, i.e. a cohort
of individuals that would have been subjected over their lifetimes to the conditions prevailing over the observed
20
40
60
80
100
2005 2010 2015
analysis time
95% CI 95% CI
Infant death 1q0 Child death 4q1 Trends in Infant and Child Mortality per 1000 PYAR
Fig. 1 Infant and child death hazard functions by calendar time (source: Agincourt HDSS 2003–2015)
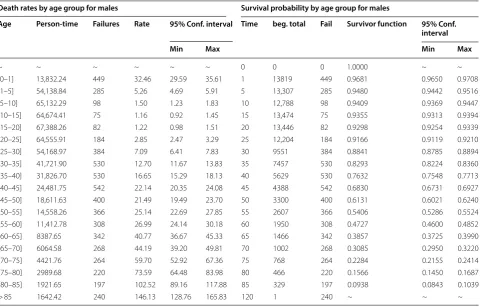
Table 1 Death rates and survival probability by age group for males. Source: Agincourt HDSS 2003–2015
Death rates by age group for males Survival probability by age group for males
Age Person-time Failures Rate 95% Conf. interval Time beg. total Fail Survivor function 95% Conf.
interval
Min Max Min Max
~ ~ ~ ~ ~ ~ 0 0 0 1.0000 ~ ~
(0–1] 13,832.24 449 32.46 29.59 35.61 1 13819 449 0.9681 0.9650 0.9708
(1–5] 54,138.84 285 5.26 4.69 5.91 5 13,307 285 0.9480 0.9442 0.9516
(5–10] 65,132.29 98 1.50 1.23 1.83 10 12,788 98 0.9409 0.9369 0.9447
(10–15] 64,674.41 75 1.16 0.92 1.45 15 13,474 75 0.9355 0.9313 0.9394
(15–20] 67,388.26 82 1.22 0.98 1.51 20 13,446 82 0.9298 0.9254 0.9339
(20–25] 64,555.91 184 2.85 2.47 3.29 25 12,204 184 0.9166 0.9119 0.9210
(25–30] 54,168.97 384 7.09 6.41 7.83 30 9551 384 0.8841 0.8785 0.8894
(30–35] 41,721.90 530 12.70 11.67 13.83 35 7457 530 0.8293 0.8224 0.8360
(35–40] 31,826.70 530 16.65 15.29 18.13 40 5629 530 0.7632 0.7548 0.7713
(40–45] 24,481.75 542 22.14 20.35 24.08 45 4388 542 0.6830 0.6731 0.6927
(45–50] 18,611.63 400 21.49 19.49 23.70 50 3300 400 0.6131 0.6021 0.6240
(50–55] 14,558.26 366 25.14 22.69 27.85 55 2607 366 0.5406 0.5286 0.5524
(55–60] 11,412.78 308 26.99 24.14 30.18 60 1950 308 0.4727 0.4600 0.4852
(60–65] 8387.65 342 40.77 36.67 45.33 65 1466 342 0.3857 0.3725 0.3990
(65–70] 6064.58 268 44.19 39.20 49.81 70 1002 268 0.3085 0.2950 0.3220
(70–75] 4421.76 264 59.70 52.92 67.36 75 768 264 0.2284 0.2155 0.2414
(75–80] 2989.68 220 73.59 64.48 83.98 80 466 220 0.1566 0.1450 0.1687
(80–85] 1921.65 197 102.52 89.16 117.88 85 329 197 0.0938 0.0843 0.1039
[image:3.595.57.293.183.349.2] [image:3.595.59.540.419.726.2]period (see Table 1). Both the death rates (nmx) and
sur-vival probabilities (nqx) may be computed from the same
data without resorting to conversion formulas as necessary with aggregates. The distribution of events by age interval is the same for nmx and nqx. Aggregates (column 8) are not
accurate since, as noted in the Stata output, the “survivor function is calculated over full data and evaluated at indi-cated times; it is not calculated from aggregates.” More reliable are the person-years displayed in column 2. Com-mon summary cohort measures, such as life expectancy or median age at death are derived from the probabilities.
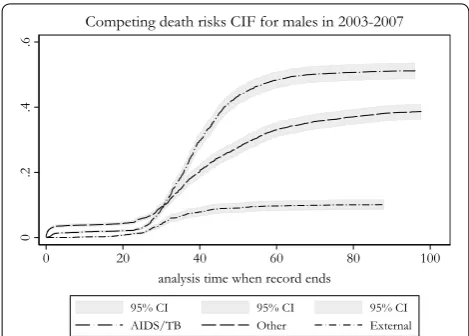
Another useful synthetic cohort descriptive tool is the cumulative incidence function (CIF) [8] that has not so far been presented in published manuals. We recommend this over the cumulative hazard function also known as the Nelson-Aalen function (NAF) to analyse compet-ing events such as causes of death, which is based on the assumption of independence between competing events that doesn’t always hold. The advantage of the CIF over the NAF is that the sum of CIF for each competing event is equal to the Kaplan–Meier failure function, unlike the NAF whose scale has no clear interpretation (it frequently exceeds the value 1). However the NAF is still useful for repeatable events (competing or not) since the CIF does not handle repeatable events. Figure 2 presents the CIF for large categories of death. AIDS/TB represents about half of the mortality intensity in the 2003–2007 period.
An original contribution that the MADIMAH team has streamlined is the detailed procedure to analyse in-migration [9, 10]. This is a special case in event history analysis that involves reversing analysis time to com-pute rates using destination population at risk instead of the origin population at risk (as done for out-migration analysis).
The full potential of longitudinal data relates not only to the ability to produce standard descriptive estimates as we have seen above, but also to the ability to produce more complex regression estimates. The well-known Cox model (semi-parametric proportional hazard model is its full name) and the less known Fine and Gray model for non-independent competing risks [11] can easily be implemented using the same micro data that we used to produce rates and probabilities. The MADIMAH team has successfully applied these methods to analyses of determinants and outcomes of demographic processes, to produce results that are comparable across diverse set-tings [12, 13].
Limitations
The computer programs and analyses outlined in this research note are flexible and can be applied to renew-able or renewrenew-able events, competing risks or non-competing risks. However, consideration should be given as to the time-precision of the data, the precision of recorded dates for data collection (e.g., days) should always be higher than the unit of time of analysis (e.g., years). The manual (Additional file 1) has been designed for Stata users and the provided computer programs would require adaptation for use in other statistical soft-ware packages. The manual follows the previously pub-lished “Manual of event history data management using HDSS data” [4], which outlines the steps to structure the data into the required format for EHA.
Supplementary information
Supplementary information accompanies this paper at https ://doi. org/10.1186/s1310 4-019-4544-1.
Additional file 1. Manual of event history data analysis using longitudinal data.
Abbreviations
CIF: cumulative incidence function; CoD: cause of death; EHA: event history analysis; HDSS: Health and Demographic Surveillance System; INDEPTH: Inter-national Network for the Demographic Evaluation of Populations and their Health; LMIC: low- and middle-income countries; NAF: Nelson-Aalen function.
Acknowledgements
We further acknowledge institutional support from the School of Public Health, Faculty of Health Sciences, University of the Witwatersrand, South Africa; Centre de Recherche en Démographie et Sociétés, Université Catholique de Louvain, Louvain-la-Neuve, Belgium; the South African Medical Research Council and the INDEPTH Network.
Authors’ contributions
PB conceptualised the methods and processes outlined in the manual and was a major contributor in writing the manual and research note. CG contributed to the writing of the manual and research note, and reviewed and checked the methods, computer programs and results outlined in the manual. MC contributed to the conceptualisation of methods outlined in the manual, provided team leadership, and reviewed the manuscript. All authors read and approved the final manuscript.
[image:4.595.56.291.87.255.2]•fast, convenient online submission
•
thorough peer review by experienced researchers in your field
• rapid publication on acceptance
• support for research data, including large and complex data types
•
gold Open Access which fosters wider collaboration and increased citations maximum visibility for your research: over 100M website views per year
•
At BMC, research is always in progress.
Learn more biomedcentral.com/submissions
Ready to submit your research? Choose BMC and benefit from:
Funding
The work on this research note and training manual forms part of the activities of the INDEPTH Multi-centre Analysis of the Dynamics of Internal Migration And Health (MADIMAH) project. The project has received funds from the Swedish International Development Agency (Sida: 2012-000379) as well as joint financial support from the National Research Foundation, South Africa, and the Wallonia‐Brussels Federation of Belgium (Joint NRF-FNRS Grant No: 95284). Further support was received from another Wallonia‐Brussels Federa-tion of Belgium grant (FNRS Grant No: 29137033). We gratefully acknowledge the South African Medical Research Council (SAMRC) for funding Carren Ginsburg’s Career Development Award. None of the listed funding agencies interfered in the design of the study and collection, analysis, and interpreta-tion of data and in writing the manuscript.
Availability of data and materials
The Agincourt micro data analysed during the current study is available in the INDEPTH iShare2 repository, (http://www.indep th-ishar e.org/index .php/ home). South Africa-Agincourt INDEPTH Core Dataset 1993–2015 (Release 2017) DDI.INDEPTH.ZA011.CMD2015.v1. Data on causes are death are avail-able from the Agincourt HDSS on reasonavail-able request.
Ethics approval and consent to participate
The Agincourt HDSS data collection activities, including the collection of verbal autopsies, were reviewed and approved by the Human Research Ethics Committee (Medical) of the University of the Witwatersrand (Proto-cols M960720 and M110138).Informed verbal consent is obtained at each surveillance visit from the head of the household (or an eligible adult in the household). The verbal informed consent process is conducted by a trained local fieldworker, using the local language. The purpose and aims of the interview are explained and confidentiality for the individual and the right to refuse to participate or withdraw from the study are communicated. Consent is obtained before conducting interviews.
Consent for publication
Not applicable.
Competing interests
The authors declare that they have no competing interests.
Author details
1 Centre de Recherche en Démographie, Université Catholique de Louvain,
Place Montesquieu, 1 bte L2.08.03, 1348 Louvain‐la‐Neuve, Belgium. 2 Medical
Research Council/Wits Rural Public Health and Health Transitions Research Unit (Agincourt), School of Public Health, Faculty of Health Sciences, University of the Witwatersrand, Johannesburg, South Africa. 3 Department of Science
and Technology/Medical Research Council, South African Population Research Infrastructure Network, Johannesburg, South Africa.
Received: 1 July 2019 Accepted: 6 August 2019
References
1. Gerritsen A, Bocquier P, White M, Mbacke C, Alam N, Beguy D, Odhiambo F, Sacoor C, Phuc HD, Punpuing S, Collinson MA. Health and Demo-graphic Surveillance Systems: contributing to an understanding of the dynamics in migration and health. Global Health Action. 2013;6:21496. https ://doi.org/10.3402/gha.v6i0.21496 .
2. Sankoh O, Byass P. The INDEPTH Network: filling vital gaps in global epi-demiology. Int J Epidemiol. 2012;41(3):579–88. https ://doi.org/10.1093/ ije/dys08 1.
3. Herbst K, Juvekar S, Bhattacharjee T, Bangha M, Patharia N, Tei T, et al. The INDEPTH Data Repository: an international resource for longitudinal population and health data from Health and Demographic Surveillance Systems. J Empir Res Hum Res Ethics. 2015;10(3):324–33. https ://doi. org/10.1177/15562 64615 59460 0.
4. Bocquier P, Ginsburg C, Herbst K, Sankoh O, Collinson MA. A training manual for Event History Data Management using Health and Demo-graphic Surveillance System data. BMC Res Notes. 2017;10:224. https :// doi.org/10.1186/s1310 4-017-2541-9.
5. Preston SH, Heuveline P, Guillot M. Demography: measuring and model-ling population processes. Oxford: Blackwell; 2001.
6. Cleves M, Gould W, Gutierrez R, Marchenko Y. An introduction to survival analysis using Stata. 3rd ed. Texas: Stata Press; 2010.
7. Kahn K, Collinson MA, Gomez-Olive FX, Mokoena O, Twine R, Mee P, et al. Profile: Agincourt Health and Socio-Demographic Surveillance System. Int J Epidemiol. 2012;41:988–1001. https ://doi.org/10.1093/ije/dys11 5. 8. Coviello V, Boggess M. Cumulative incidence estimation in the presence
of competing risks. Stata J. 2004;4(2):103–12.
9. Baydar N, White M. A method for analyzing backward recurrence time data on residential mobility. Sociol Methodol. 1988;18:105–35. https :// doi.org/10.2307/27104 6.
10. Beguy D, Bocquier P, Zulu EM. Circular migration patterns and determi-nants in Nairobi slum settlements. Demogr Res. 2010;23:549–86. https :// doi.org/10.4054/DemRe s.2010.23.20.
11. Fine JP, Gray RJ. A proportional hazards model for the subdistribution of a competing risk. J Am Stat Assoc. 1999;94(446):496–509.
12. Ginsburg C, Bocquier P, Béguy D, Afolabi S, Orvalho A, Derra K, Herbst K, Lankoandé B, Odhiambo F, Otiende M, Soura A, Wamukoya M, Zabré P, White MJ, Collinson MA. Healthy or unhealthy migrants? Identifying selection, adaptation and propagation effects on mortality in local popu-lations using longitudinal data. Soc Sci Med. 2016;164:59–73. https ://doi. org/10.1016/j.socsc imed.2016.06.035.
13. Ginsburg C, Bocquier P, Béguy D, Afolabi S, Khan K, Obor D, Tanser F, Tomita A, Wamukoya M, Collinson MA. Association between internal migration and epidemic dynamics: an analysis of cause-specific mortality in Kenya and South Africa using health and demographic surveillance data. BMC Public Health. 2018;18:918. https ://doi.org/10.1186/s1288 9-018-5851-5.
Publisher’s Note