R E S E A R C H A R T I C L E
Open Access
Development of a prediction model for
breast cancer based on the national cancer
registry in Taiwan
Ching-Chieh Huang
1, Soa-Yu Chan
2, Wen-Chung Lee
1,3, Chun-Ju Chiang
1,3, Tzu-Pin Lu
1,4*and
Skye Hung-Chun Cheng
5*Abstract
Background:This study aimed to develop a prognostic model to predict the breast cancer-specific survival and overall survival for breast cancer patients in Asia and to demonstrate a significant difference in clinical outcomes between Asian and non-Asian patients.
Methods:We developed our prognostic models by applying a multivariate Cox proportional hazards model to Taiwan Cancer Registry (TCR) data. A data-splitting strategy was used for internal validation, and a multivariable fractional polynomial approach was adopted for prognostic continuous variables. Subjects who were Asian, black, or white in the US-based Surveillance, Epidemiology, and End Results (SEER) database were analyzed for external validation. Model discrimination and calibration were evaluated in both internal and external datasets.
Results:In the internal validation, both training data and testing data calibrated well and generated good area under the ROC curves (AUC; 0.865 in training data and 0.846 in testing data). In the external validation, although the AUC values were larger than 0.85 in all populations, a lack of model calibration in non-Asian groups revealed that racial differences had a significant impact on the prediction of breast cancer mortality. For the calibration of breast cancer-specific mortality,Pvalues < 0.001 at 1 year and 0.018 at 4 years in whites, andPvalues≤0.001 at 1 and 2 years and 0.032 at 3 years in blacks, indicated that there were significant differences (Pvalue < 0.05) between the predicted mortality and the observed mortality. Our model generally underestimated the mortality of the black population. In the white population, our model underestimated mortality at 1 year and overestimated it at 4 years. And in the Asian population, allPvalues > 0.05, indicating predicted mortality and actual mortality at 1 to 4 years were consistent. Conclusions:We developed and validated a pioneering prognostic model that especially benefits breast cancer patients in Asia. This study can serve as an important reference for breast cancer prediction in the future.
Keywords:Breast cancer, Prognosis, Asian, Taiwan Cancer Registry, SEER, Survival, Mortality, Model
Background
Globally, breast cancer is the most common incident cancer. In 2017, cancer was the leading cause of death in Taiwan, and this has been the case for the past 36 years as well as the leading cause of cancer deaths and disability-adjusted life years in women [1]. Interestingly, Asians constitute the lar-gest proportion of breast cancer patients worldwide [2].
Consequently, it is essential to assess prognostic risk factors, treatment effects, and survival rates in women with breast cancer in Taiwan or, more broadly, in Asia.
In recent years, several research studies have been per-formed to predict the survival rates of breast cancer pa-tients. For example, PREDICT [3–5] is a useful prognostic algorithm implemented online to predict the breast can-cer-specific survival and overall survival of female patients with early-stage breast cancer in Britain. This web-based tool can help breast cancer patients and physicians to esti-mate survival rates in the next few years, as well as predict treatment effects. However, most of the prognostic models
© The Author(s). 2019Open AccessThis article is distributed under the terms of the Creative Commons Attribution 4.0 International License (http://creativecommons.org/licenses/by/4.0/), which permits unrestricted use, distribution, and reproduction in any medium, provided you give appropriate credit to the original author(s) and the source, provide a link to the Creative Commons license, and indicate if changes were made. The Creative Commons Public Domain Dedication waiver (http://creativecommons.org/publicdomain/zero/1.0/) applies to the data made available in this article, unless otherwise stated.
* Correspondence:tplu@ntu.edu.tw;skyecheng@gmail.com;skye@kfsyscc.org
1
Institute of Epidemiology and Preventive Medicine, Department of Public Health, College of Public Health, National Taiwan University, Taipei, Taiwan
5Department of Radiation Oncology, Koo Foundation Sun Yat-Sen Cancer
for breast cancer patients focus only on Western popula-tions, and previous studies indicate that breast cancer sur-vival rates vary greatly between Asian and European people, due not only to treatment or environmental fac-tors, but also to fundamental genetic variation [6–9].
In light of this concern, the first aim of this study was to develop a prognostic model to predict the overall survival and breast cancer-specific survival in Taiwan. Based on the results, we are able to predict the mortality of breast cancer patients in Asia. The data used for model develop-ment were from a large cohort followed by the Taiwan Cancer Registry (TCR) and included systemic treatments, site-specific factors, and long-term outcome tracking in 20 hospitals nationwide from 2011 to 2015. The second aim of this study was to assess the impact of racial differ-ences based on model validation in different populations. We verified our model through the model discrimination and calibration against the Asian, white, and black popula-tions in the US-based Surveillance, Epidemiology, and End Results (SEER) database [10].
Methods
Data source and sample selection
The original data for our primary analysis were retrieved from the TCR database. The TCR provides complete core information for cancer cases in Taiwan that meet the cri-teria for high data quality [11,12]. Its data source consists
of 19 medical centers and a district hospital specializing in cancer research, Koo Foundation Sun Yat-Sen Cancer Center. A total of 90,841 patients diagnosed with breast cancer from January 1, 2011, to December 31, 2015, were recruited, and the last follow-up date was December 31, 2017. The study flow is illustrated in Fig.1.
The exclusion criteria included death before receiving treatment, not engaging in any treatment at the reporting hospital, having tumor size ≥989 mm or a cancer of un-known primary origin, transferring to other hospitals, suf-fering from other malignant tumors, receiving radiation therapy before surgery, and being male. Also, excluded were cases with pathologic stage 0; patients whose date of death was earlier than the date of diagnosis; cases without surgery; patients whose cancer genotype was human epi-dermal growth factor receptor 2-negative (HER2−) but who still received targeted therapy; patients with hormone receptor-negative (HR−) cancer, i.e., estrogen receptor-negative (ER−) and progesterone receptor-negative (PR−), who received hormone/steroid therapy; cases with a diag-nosis not confirmed by histology; and patients under age 18 at diagnosis. The number of patients excluded for each reason is presented in Fig.1. The ER+ and PR+ genotypes were defined as more than one tumor specimen, as the definition in SEER Registrar Staging Assistant (SEER*RSA). HER2+ status was required to be established by immuno-histochemistry, chromogenic in situ hybridization, fluores-cence in situ hybridization, or similar methods.
[image:2.595.56.539.439.718.2]Prognostic model development and internal validation
We considered overall survival and breast cancer-specific survival as study endpoints. A Cox proportional hazards model was adopted in R using the package“survival”[13] to estimate the hazard ratio associated with various risk factors or clinical treatments. Chemotherapy, radiation therapy, hormone/steroid therapy, and targeted therapy were treated as binary variables, expressed as yes/no an-swers to the question, “Did the patient receive this ther-apy?”On the other hand, age at diagnosis, tumor size, and the node-positive ratio (regional lymph nodes positive/re-gional lymph nodes examined) were continuous variables. Tumor grade, lymph vessel or vascular invasion, breast cancer subtype, and pathologic stage were categorical vari-ables. Breast cancer subtypes were categorized as proposed by Blows [12] and Cheng [13], with grouping into three major subtypes: (1) luminal-like subtype (HR+ and HER2
−), (2) HER2 subtype (HER2+), and (3) triple-negative sub-type (HR−and HER2−). For tumor grade, 1 means the well differentiated or differentiated; 2 means moderately differ-entiated, moderately well differdiffer-entiated, or intermediate differentiation; and 3 means poorly differentiated, dediffer-entiated, undifferdediffer-entiated, or anaplastic. Lymph vessel or vascular invasion defined“Yes” as having lymph vessel or vascular invasion and defined“No”as otherwise.
We used a data-splitting strategy, first randomly separat-ing the TCR data into trainseparat-ing and testseparat-ing datasets with the ratio 2:1 [14]. The training data were used to construct our prognostic model and to estimate the variable coeffi-cients; the testing data were analyzed for internal valid-ation. In addition, one previous report demonstrated that the effect of the continuous variables, e.g., age at diagnosis and tumor size, was not linear [4]. Therefore, we used the following methods to deal with this issue.
A multivariable fractional polynomial (MFP) approach is commonly adopted in medical research [4,15,16] to deter-mine the importance of variables and their functional forms (nonlinear forms) for model development. Among the prognostic variables that we considered, age at diagnosis, tumor size, and the node-positive ratio were continuous variables that were further transformed by the MFP ap-proach. The MFP approach was carried out in R using the package“mfp”[17]. Because the SEER data did not include information on hormone/steroid therapy, targeted therapy, and lymphatic vessel or vascular invasion, we developed an-other prognostic model which contained all prognostic fac-tors for overall and the breast cancer-specific survival.
External model validation
Our model was validated against the white, the black, and the Asian subpopulations in the SEER database. The follow-up cutoff date of the SEER data was December 31, 2015, and the diagnosis year was from 2011 to 2015. The definition of“Asian”in this study included Chinese,
Japanese, Korean, Vietnamese, and Laotian ethnicity. We again emphasize that the model validation based on the SEER data could only be implemented using prognostic factors that were also available in SEER data for both overall survival and breast cancer-specific survival (model 1 and model 3 presented in Fig.1).
Model discrimination and calibration were evaluated separately in our study. For discrimination, the area under the receiver operating characteristic curve (AUC) was assessed. The concordance probability was one primary indicator to assess the discriminatory power and to predict the AUC of a Cox model. Harrell’s c-index of concordance [18] was utilized as an alternative measure of discrimin-ation. Harrell’s c-index expresses the probability that the predicted event and the observed event (i.e., survival) are consistent based on informative pairs. A Harrell’s c-index
≤0.5 indicates a poor model, > 0.7 indicates a good model, and > 0.8 indicates a strong model.
Model calibration was also evaluated to explore whether there were significant differences (Pvalue < 0.05) between the predicted mortality and the observed mortality in total or in each category by a given follow-up time after diagno-sis. The predicted mortality for cases was calculated from the coefficient estimated by the Cox model [4,14,16].
Results
Prognostic model development
We summarize the MFP function of continuous vari-ables and the associated logarithmic hazard ratios (logHRs) for breast cancer-specific survival regressed on variables contained in the SEER database (model 1) in Table 1. As mentioned earlier, the SEER database did not contain all prognostic factors present within the TCR. An additional model for the breast cancer-specific survival containing all the important variables in the TCR (model 2) is presented in Table 2. The estimated coefficients in Tables1and2are all in line with observa-tions from clinical practice. Conducting chemotherapy (logHR =−0.4792 in Table 1 and −0.4147 in Table 2), hormone/steroid therapy (logHR =−0.8397 in Table 2), targeted therapy (logHR =−0.4687 in Table 2), or radi-ation therapy (logHR =−0.3316 in Table 1and−0.3203 in Table 2) does indeed improve the survival of breast cancer patients. In terms of the breast cancer subtypes, patients with the triple-negative subtype have a higher risk of mortality (logHR = 1.426 in Table1and 0.6457 in Table 2) than the others, as is expected. In addition, overall survival model containing variables in the SEER database (model 3) is shown in Additional file 1: Table S1, and overall survival model containing all variables (model 4) is presented in Additional file1: Table S2.
the time (days) after diagnosis of the four models is the same and contained two terms:
time1 = (time/1000)2and time2 = log (time/1000)(time/ 1000)2.
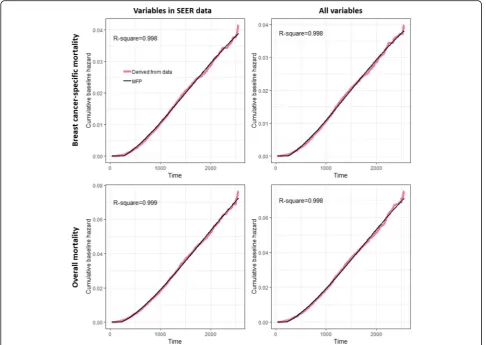
The corresponding time-dependent cumulative baseline hazard functions (CBHt) for models 1 to 4 were as follows:
CBHt model 1ð Þ ¼−0:001446þ0:0121
time1−0:006314time2
CBHt model 2ð Þ ¼−0:001237þ0:01215
time1−0:006522time2
CBHt model 3ð Þ ¼−0:00168þ0:02064
time1−0:009897time2
CBHt model 4ð Þ ¼−0:001563þ0:02077
time1−0:01028time2
[image:4.595.305.539.121.612.2]If the prediction of cumulative baseline hazard was less than 0, it was replaced with 0. The four functions fitted the corresponding cumulative baseline hazard well. As shown in Fig. 2, the R-square values were all nearly equal to 1. Then the survival estimation ^SðtjZ;βÞ given the time tand prognostic variables Z with correspond-ing logHRβcan be calculated by exp (−CBHt×ZTβ).
Table 1Multivariable fractional polynomial functions and logarithm hazard ratios for breast cancer-specific survival using SEER variables
Variables Function logHR Pvalue Continuous variables
Age1 (age/100)−0.5 −13.05 < 0.001 Age2 (age/100)−0.5× log(age/100) 10.42 < 0.001 Tumor size, mm log(size/10) 0.8375 < 0.001 Node-positive ratio ((ratio + 0.1)/0.1)0.5 0.7076 < 0.001 Categorical variables
Chemotherapy
Without – – – With – −0.4792 < 0.001 Radiotherapy
Without – – – With – −0.3316 < 0.001 Grade
1 – – –
2 – 0.6106 0.003 3 – 1.059 < 0.001 Subtype
Luminal-like – – – HER2 – 0.3185 < 0.001 Triple negative – 1.426 < 0.001 Pathological stage
1 – – –
2 – 0.6073 < 0.001 3 – 1.076 < 0.001 4 – 2.044 < 0.001
Derived from model 1
Table 2Multivariable fractional polynomial functions and logarithm hazard ratios for breast cancer-specific survival using all variables
Variables Function logHR Pvalue Continuous variables
Age1 (age/100)−0.5 −10.87 0.0035 Age2 (age/100)−0.5× log(age/100) 8.968 < 0.001 Tumor size, mm log(size/10) 0.7678 < 0.001 Node-positive ratio ((ratio + 0.1)/0.1)0.5 0.5339 < 0.001 Categorical variables
Chemotherapy
Without – – – With – −0.4147 < 0.001 Radiotherapy
Without – – – With – −0.3203 < 0.001 Grade
1 – – –
2 – 0.4795 0.015 3 – 0.818 < 0.001 Subtype
Luminal-like – – – HER2 – 0.1806 0.22 Triple negative – 0.6457 < 0.001 Pathological stage
1 – – –
2 – 0.5311 < 0.001 3 – 1.134 < 0.001 4 – 2.172 < 0.001 Targeted therapy
Without – – – With – −0.4687 0.001 Hormone/steroid therapy
Without – – – With – −0.8397 < 0.001 Lymph vessel or vascular invasion (LVI)
No – – –
Yes – 0.3321 < 0.001
[image:4.595.59.291.122.486.2]Model discrimination and calibration
In follow-up analyses, the Harrell’s c-indices were all higher than 0.8, indicating good discrimination ability across all data (Table 3). However, a significant differ-ence between predicted mortality and observed mortality in calibration was observed for non-Asian groups
(Table 4), indicating that our model generally underesti-mated the mortality of the black population, and in the white population, our model underestimated the mortality at 1 year post-diagnosis and overestimated it at 4 years post-diagnosis. These results show that the estimated risk of death in our TCR-based model is not useful for applica-tion in individuals with non-Asian ethnicity [19]. Although the Harrell’s c-indices performed well, suggest-ing certain prognostic variables remained important for non-Asian patients, the estimation of life expectancy is in-correct due to the low calibration value, especially in the black population [19]. In terms of the Asian population in Table4, although mortality of model 3 calibration at 1 year post-diagnosis for Asians in the SEER database is slightly underestimated, the mortality of model 1 is calibrated well in general. In terms of the training and testing data in Table4or Additional file 1: Table S3, allP values > 0.05, indicating there was no significant difference between pre-dicted mortalities and observed mortalities.
[image:5.595.56.543.88.433.2]Model calibration within the strata of categorical vari-ables is presented in Table5and Additional file1: Tables S4-S20). We calibrated at 3 years for model 1 (Table 5, Fig. 2Cumulative baseline hazard derived from data and the MFP estimation
Table 3Comparison of discrimination (AUCs) by the estimation of Harrell’s c-index
Overall survival Breast cancer-specific survival Variables in SEER data
Training 0.827 0.865 Testing 0.812 0.846 White 0.812 0.882 Black 0.806 0.858 Asian 0.873 0.92 All variables
Training 0.831 0.869 Testing 0.816 0.854
[image:5.595.56.290.576.714.2]Additional file1: Tables S6-S7) and calibrated for 3 years for model 2 (Additional file1: Tables S15-S16), in which age at diagnosis and tumor size were also grouped into categories by referring to the classification of Candido [4]. Additional calibration results for models 1 and 2 at 5 years are shown in Additional file 1: Tables S4-S5 and S13-S14, respectively, as are the calibration results for model 3 (Additional file 1: Tables S8-S12) and model 4 (Additional file1: Tables S17-S20).
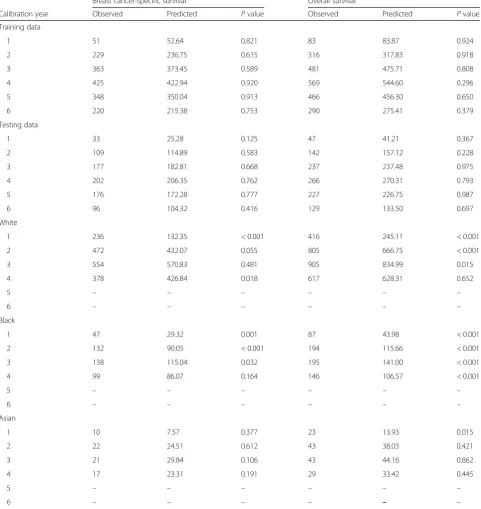
[image:6.595.58.540.105.615.2]For the calibration within each categorical variable at 3 years or 5 years post-diagnosis, although there are someP values < 0.05 in the training data (triple-negative subtype in Additional file 1: Tables S6, S10, S13; hormone therapy in Additional file 1: Table S15), the P values of these variables are not significant in the test-ing data, indicattest-ing that they might be “false positives,” that is, the significance occurred randomly. The model 1 calibration for Asians in the SEER database (Table 5) Table 4Model calibration of breast cancer-specific mortality regressed on prognostic variables in SEER data
Breast cancer-specific survival Overall survival
Calibration year Observed Predicted Pvalue Observed Predicted Pvalue Training data
1 51 52.64 0.821 83 83.87 0.924 2 229 236.75 0.615 316 317.83 0.918 3 363 373.45 0.589 481 475.71 0.808 4 425 422.94 0.920 569 544.60 0.296 5 348 350.04 0.913 466 456.30 0.650 6 220 215.38 0.753 290 275.41 0.379 Testing data
1 33 25.28 0.125 47 41.21 0.367 2 109 114.89 0.583 142 157.12 0.228 3 177 182.81 0.668 237 237.48 0.975 4 202 206.35 0.762 266 270.31 0.793 5 176 172.28 0.777 227 226.75 0.987 6 96 104.32 0.416 129 133.50 0.697 White
1 236 132.35 < 0.001 416 245.11 < 0.001 2 472 432.07 0.055 805 666.75 < 0.001 3 554 570.83 0.481 905 834.99 0.015 4 378 426.84 0.018 617 628.31 0.652
5 – – – – – –
6 – – – – – –
Black
1 47 29.32 0.001 87 43.98 < 0.001 2 132 90.05 < 0.001 194 115.66 < 0.001 3 138 115.04 0.032 195 141.00 < 0.001 4 99 86.07 0.164 146 106.57 < 0.001
5 – – – – – –
6 – – – – – –
Asian
1 10 7.57 0.377 23 13.93 0.015
2 22 24.51 0.612 43 38.03 0.421 3 21 29.84 0.106 43 44.16 0.862 4 17 23.31 0.191 29 33.42 0.445
5 – – – – – –
shows that the breast cancer-specific mortality of grade 2 was slightly overestimated (4 observed versus 12 predicted events,P= 0.026). However, overall, the predicted and ob-served mortalities are approximately consistent.
Discussion
We have developed a prognostic model to predict overall survival and breast cancer-specific survival in women with breast cancer based on the data collated from the TCR. Since external validation can further strengthen the potential applicability of a prognostic model [14,16], we have validated our model using the US-based SEER database. A sophisticated approach, MFP, was adopted
in our Cox proportional hazards model to adjust the continuous variables (age at diagnosis, tumor size, and node-positive ratio) in a non-linear functional form.
[image:7.595.57.543.100.547.2]Previous studies have demonstrated that the survival rates of breast cancer patients were different in patients with distinct ethnic background [20,21]. Hence, the ap-plicability of our model to different races was a pivotal issue to address in our study. The discrimination seemed to perform well in all races. However, in white and black patients, the model was poorly calibrated across different years. These results reveal that non-Asian groups should be evaluated carefully in individual cases. Possible alter-native solutions involve either recalibration using local data or developing a new model based on non-Asian Table 5Model 1 calibration at 3 years in the Asian population of the SEER database
Number of cases Observed events Predicted events Difference (%) Pvalue Subtype
Luminal-like 854 13 15.03 −0.15 0.6
HER2 181 1 5.38 −4.38 0.059
Triple negative 110 7 9.42 −0.34 0.431 Grade
1 261 0 1.52 -Inf. 0.218
2 538 4 11.55 −1.89 0.026
3 346 17 16.76 0.013 0.954
Pathological stage
1 577 0 3.04 -Inf. 0.081
2 457 7 14.35 −1.05 0.052
3 102 11 9.45 0.14 0.164
4 9 3 2.98 0.003 0.995
Chemotherapy
Without 630 4 9.62 −1.4 0.07
With 515 17 20.21 −0.19 0.474
Radiotherapy
Without 397 10 11.15 −0.11 0.73
With 748 11 18.68 −0.7 0.075
Age at diagnosis
< 35 17 1 0.53 0.46 0.522
35 to 49 333 7 7.54 −0.07 0.844 50 to 64 428 7 10.8 −0.54 0.247 65 to 74 206 3 5.59 −0.86 0.272
75+ 161 3 5.37 −0.79 0.306
Tumor size
< 10 260 0 0.9 -Inf. 0.341
10 to 19 388 1 4.57 −3.57 0.095 20 to 29 257 5 6.73 −0.34 0.505 30 to 49 161 10 8.72 0.13 0.665
data [19]. However, PREDICT seems to be a good choice for the non-Asian population.
In addition to the lack of calibration to some racial groups, the current model has some other limitations. Firstly, sequences between surgery and other treatments are not well defined in either the SEER database or the TCR. The sequences between treatments might cause bias. Furthermore, many risk factors related to lifestyle should also be considered in the future. Lastly, it is im-portant to emphasize that the period of follow-up, the years since diagnosis, in our data is not sufficient and will limit our interpretations. It has been recommended that a calibration at 5 to 10 years post-diagnosis [3, 4] would more accurately reflect the survival of patients. In spite of these limitations, this study used the largest number of breast cancer samples in Asia and will have great benefits for breast cancer prediction in the Asian population. The findings from our study are intriguing enough to prompt further research on prognostic models for Asian populations, as well as further research on breast cancer-related racial differences.
Conclusions
In summary, this study demonstrated that a new prognos-tic model could be pracprognos-tically implemented and provided results that have advanced the field of breast cancer re-search. We designed a powerful model that distinguishes the effects of ethnicity on survival rates in breast cancer and that accurately predicts mortality in Asians based on a large cohort of Asian breast cancer patients. We hope that this study will pave the way for new research that will benefit breast cancer patients around the world.
Additional file
Additional file 1:Validation of models 1–4. A series of 20 tables showing the results of the model 3 and the model 4 about their details of development and calibrations. (DOCX 115 kb)
Abbreviations
AUC:Area under the receiver operating characteristic curve; CBH: Cumulative baseline hazard; ER−: Estrogen receptor-negative; HER2−: Human epidermal growth factor receptor 2-negative; HR−: Hormone receptor-negative; logHR: Logarithmic hazard ratio; MFP: Multivariable fractional polynomial; PR
−: Progesterone receptor-negative; SEER: Surveillance, Epidemiology, and End Results; TCR: Taiwan Cancer Registry
Acknowledgements
The authors thank Melissa Stauffer, PhD, for editing the manuscript.
Authors’contributions
C-CH executed the analysis, developed the statistical model, performed the data analyses, and drafted the manuscript. T-PL and Skye H-CC developed the study design, supervised the study, and contributed to the writing of the manuscript. W-CL and C-JC provided the TCR data and helped to interpret the results. S-YC involved in the idea of model validation and literature review. All authors read and approved the final manuscript.
Funding
This study was partly supported by grants from the Health Promotion Administration, the Ministry of Health and Welfare, Taipei, Taiwan (A1051011; the Tobacco Control and Health Care funds); the Ministry of Science and Technology, Taiwan (MOST-106-2314-B-002-134-MY2 and MOST-104-2314-B-002-107-MY2); and the Hammer Family Office. The funders had no role in the study design, data collection and analysis, the decision to publish, or preparation of the manuscript.
Availability of data and materials
The datasets supporting the conclusions of this article are included within the article and its additional files.
Ethics approval and consent to participate
This study was approved by the Koo Foundation Sun-Yat Sen Cancer Center Research Ethnics Committee (20171016A).
Consent for publication
Not applicable.
Competing interests
The authors declare that they have no competing interests
Author details
1
Institute of Epidemiology and Preventive Medicine, Department of Public Health, College of Public Health, National Taiwan University, Taipei, Taiwan.
2
Department of Computing and Information, Koo Foundation Sun-Yat Sen Cancer Center, Taipei, Taiwan.3Taiwan Cancer Registry, Taipei, Taiwan. 4
Department of Surgery, National Taiwan University Hospital, Taipei 100, Taiwan.5Department of Radiation Oncology, Koo Foundation Sun Yat-Sen
Cancer Center, No. 125, Lih-Der Road, Pei-Tou District, Taipei, Taiwan.
Received: 13 March 2019 Accepted: 18 July 2019
References
1. Deaths from cancer hit new high in Taiwan (update). 2018.http:// focustaiwan.tw/news/asoc/201806150009.aspx.
2. Fitzmaurice C, Akinyemiju TF, Al Lami FH, Alam T, Alizadeh-Navaei R, Allen C, et al. Global, regional, and national cancer incidence, mortality, years of life lost, years lived with disability, and disability-adjusted life-years for 29 cancer groups, 1990 to 2016: a systematic analysis for the global burden of disease study. JAMA Oncol. 2018;4(11):1553–68.
3. Wishart GC, Azzato EM, Greenberg DC, Rashbass J, Kearins O, Lawrence G, Caldas C, et al. PREDICT: a new UK prognostic model that predicts survival following surgery for invasive breast cancer. Breast Cancer Res. 2010;12(1):R1. 4. Candido Dos Reis FJ, Wishart GC, Dicks EM, Greenberg D, Rashbass J,
Schmidt MK, et al. An updated PREDICT breast cancer prognostication and treatment benefit prediction model with independent validation. Breast Cancer Res. 2017;19(1):58.
5. Wishart G, Bajdik C, Dicks E, Provenzano E, Schmidt M, Sherman M, et al. Development and validation of a prognostic model for early breast cancer that includes HER2. Br J Cancer. 2012;107(5):800.
6. Leong SP, Shen Z-Z, Liu T-J, Agarwal G, Tajima T, Paik N-S, Sandelin K, et al. Is breast cancer the same disease in Asian and Western countries? World J Surg. 2010;34(10):2308–24.
7. de Bruin MA, Kwong A, Goldstein BA, Lipson JA, Ikeda DM, McPherson L, et al. Breast cancer risk factors differ between Asian and white women with BRCA1/2 mutations. Familial Cancer. 2012;11(3):429–39.
8. Jing L, Su L, Ring BZ. Ethnic background and genetic variation in the evaluation of cancer risk: a systematic review. PLoS One. 2014;9(6):e97522. 9. Fejerman L, Ziv E. Population differences in breast cancer severity; 2008. 10. Surveillance, Epidemiology, and End Results (SEER) Program Research Data
(1973-2015), National Cancer Institute, DCCPS, Surveillance Research Program, released April 2018, based on the November 2017 submission.
http://www.seer.cancer.go. Accessed Nov 2018.
12. Cheng C-Y, Chiang C-J, Hsieh C-H, Chang Y-K, Lai M-S. Is quality of registry treatment data related to registrar experience and workload? A study of Taiwan cancer registry data. J Formos Med Assoc. 2018;117(12):1093–100. 13. Therneau TM, Lumley T. Package‘survival’. Survival analysis Published on
CRAN; 2014.
14. Altman DG, Vergouwe Y, Royston P, Moons KG. Prognosis and prognostic research: validating a prognostic model. BMJ. 2009;338:b605.
15. Royston P, Ambler G, Sauerbrei W. The use of fractional polynomials to model continuous risk variables in epidemiology. Int J Epidemiol. 1999;28(5): 964–74.
16. Royston P, Moons KG, Altman DG, Vergouwe Y. Prognosis and prognostic research: developing a prognostic model. BMJ. 2009;338:b604. 17. Ambler G, Benner A. mfp: Multivariable Fractional Polynomials. R package
version 1.4. 9; 2010.
18. Harrell FE, Lee KL, Mark DB. Multivariable prognostic models: issues in developing models, evaluating assumptions and adequacy, and measuring and reducing errors. Stat Med. 1996;15(4):361–87.
19. Matheny ME, Ohno-Machado L, Resnic FS. Discrimination and calibration of mortality risk prediction models in interventional cardiology. J Biomed Inform. 2005;38(5):367–75.
20. Curtis E, Quale C, Haggstrom D, Smith-Bindman R. Racial and ethnic differences in breast cancer survival: how much is explained by screening, tumor severity, biology, treatment, comorbidities, and demographics? Cancer. 2008;112(1):171–80.
21. Maskarinec G, Sen C, Koga K, Conroy SM. Ethnic differences in breast cancer survival: status and determinants. Women’s Health. 2011;7(6):677–87.
Publisher’s Note