STATISTISCHES AMT DER EUROPÄISCHEN GEMEINSCHAFTEN STATISTICAL OFFICE OF THE EUROPEAN COMMUNITIES OFFICE STATISTIQUE DES COMMUNAUTÉS EUROPÉENNES L-2920 Luxembourg - Tél. 43 01-1 - Télex: Comeur Lu 3423
B-1049 Bruxelles, bâtiment Berlaymont, rue de la Loi 200 (bureau de liaison) — Tél. 235 1 1 1 1
Eurostat hat die Aufgabe, den Informa-tionsbedarf der Kommission und aller am Aufbau des Binnenmarktes Beteilig-ten mit Hilfe des europäischen statisti-schen Systems zu decken.
Um der Öffentlichkeit die große Menge an verfügbaren Daten zugänglich zu machen und Benutzern die Orientierung zu erleichtern, werden zwei Arten von Publikationen angeboten: Statistische Dokumente und Veröffentlichungen. Statistische Dokumente sind für den Fachmann konzipiert und enthalten das ausführliche Datenmaterial: Bezugsda-ten, bei denen die Konzepte allgemein bekannt, standardisiert und wissen-schaftlich fundiert sind. Diese Daten werden in einer sehr tiefen Gliederung dargeboten. Die Statistischen Doku-mente wenden sich an Fachleute, die in der Lage sind, selbständig die benötig-ten Dabenötig-ten aus der Fülle des dargebote-nen Materials auszuwählen. Diese Daten sind in gedruckter Form und/oder auf Diskette, Magnetband, CD-ROM verfüg-bar. Statistische Dokumente unterschei-den sich auch optisch von anderen Veröffentlichungen durch den mit einer stilisierten Graphik versehenen weißen Einband.
Die zweite Publikationsart, die Veröffent-lichungen, wenden sich an eine ganz bestimmte Zielgruppe, wie zum Beispiel an den Bildungsbereich oder an Ent-scheidungsträger in Politik und Verwal-tung. Sie enthalten ausgewählte und auf die Bedürfnisse einer Zielgruppe abge-stellte und kommentierte Informationen. Eurostat übernimmt hier also eine Art Beraterrolle.
Für einen breiteren Benutzerkreis gibt Eurostat Jahrbücher und periodische Veröffentlichungen heraus. Diese enthal-ten statistische Ergebnisse für eine erste Analyse sowie Hinweise auf weiteres Datenmaterial für vertiefende Untersu-chungen. Diese Veröffentlichungen werden in gedruckter Form und in Datenbanken angeboten, die in Menü-technik zugänglich sind.
Um Benutzern die Datensuche zu erleichtern, hat Eurostat Themenkreise, d. h. eine Untergliederung nach Sachge-bieten, eingeführt. Daneben sind sowohl
It is Eurostat's responsibility to use the European statistical system to meet the requirements of the Commission and all parties involved in the development of the single market.
To ensure that the vast quantity of accessible data is made widely avail-able, and to help each user make proper use of this information, Eurostat has set up two main categories of document: statistical documents and publications. The statistical document is aimed at specialists and provides the most com-plete sets of data: reference data where the methodology is well established, standardized, uniform and scientific. These data are presented in great detail. The statistical document is intended for experts who are capable of using their own means to seek out what they re-quire. The information is provided on paper and/or on diskette, magnetic tape, CD-ROM. The white cover sheet bears a stylized motif which distinguishes the statistical document from other publica-tions.
The publications proper tend to be com-piled for a well-defined and targeted public, such as educational circles or political and administrative decision-makers. The information in these docu-ments is selected, sorted and annotated to suit the target public. In this instance, therefore, Eurostat works in an advisory capacity.
Where the readership is wider and less well defined. Eurostat provides the infor-mation required for an initial analysis, such as yearbooks and periodicals which contain data permitting more in-depth studies. These publications are available on paper or in Videotext data-bases.
To help the user focus his research, Eurostat has created 'themes', i.e. a subject classification. The statistical documents and publications are listed by series: e.g. yearbooks, short-term trends or methodology in order to facili-tate access to the statistical data.
Y. Franchet Director-General
Pour établir, évaluer ou apprécier les différentes politiques communautaires, la Commission des Communautés euro-péennes a besoin d'informations. Eurostat a pour mission, à travers le système statistique européen, de répon-dre aux besoins de la Commission et de l'ensemble des personnes impliquées dans le développement du marché unique.
Pour mettre à la disposition de tous l'importante quantité de données acces-sibles et faire en sorte que chacun puisse s'orienter correctement dans cet ensemble, deux grandes catégories de documents ont été créées: les docu-ments statistiques et les publications. Le document statistique s'adresse aux spécialistes. Il fournit les données les plus complètes: données de référence où la méthodologie est bien connue, standardisée, normalisée et scientifique. Ces données sont présentées à un niveau très détaillé. Le document statis-tique est destiné aux experts capables de rechercher, par leurs propres moyens, les données requises. Les informations sont alors disponibles sur papier et/ou sur disquette, bande magnétique, CD-ROM. La couverture blanche ornée d'un graphisme stylisé démarque le document statistique des autres publications.
Les publications proprement dites peu-vent, elles, être réalisées pour un public bien déterminé, ciblé, par exemple l'en-seignement ou les décideurs politiques ou administratifs. Des informations sélectionnées, triées et commentées en fonction de ce public lui sont apportées. Eurostat joue, dès lors, le rôle de con-seiller.
Dans le cas d'un public plus large, moins défini, Eurostat procure des éléments nécessaires à une première analyse, les annuaires et les périodiques, dans les-quels figurent les renseignements adé-quats pour approfondir l'étude. Ces publications sont présentées sur papier ou dans des banques de données de type vidéotex.
DIRECT INVESTMENT
YTIMUMMOO MA3qORU3
TH3MT83VM1T03HIO
88er ¿eer
This is the final report of the study made by Christine SPANNEUT from September 1989 to
December 1990.
Eurostat is publishing here a detailed study of the European Community's direct investment flows as recorded in the Balance of Payments. For the moment, it covers the years 1984 to 1988. The flows are compared with those of the United States and Japan, and are analyzed from three points of view:
1- Development over time:
The European Community is a net exporterof direct investment capital: investment it makes inothercounthes is regularly higher than investment it receives from the rest of the world: outgoing capital is more than twice as high as incoming capital: 30.7 thousand million ecus as against 14.2 thousand million in 1988 (and almost three times as high in 1984).
Direct investment flows have increased remarkably in both directions, during these last years: investment made, like that received, virtually doubled between 1984 and 1988. The latter increased at a slightly higher rate than the former. Though a net exporter, the European Community is also a pole of attraction for this type of capital.
European statistics can be compared with the equivalent statistics for Japan and United States: investments in the United States continue to be extremely high (44 thousand million ecus in 1988, i.e three times as high as investment received by the Community), particularly when the dollar conversion rate is low. But investment by Americans in other countries fluctuates considerably. On the other hand, Japan has now virtually caught up with the European Community as far as investments abroad are concerned, even though it climbed on to the bandwagon rather late. But Japan is on the receiving end of very little foreign direct investment.
At the same time (1984-1988), intra-Community investments have shot up even more rapidly than flows to and from non-Community countries - from 4.2 thousand million ecus in 1984 to almost 20 thousand million in 1988. The figures leapt up in 1986, when the signing of the Single Act strengthened expectations of a large European market and Spain and Portugal joined the Community, as they did in 1988, doubling yet again.
In 1988, for every three ecus invested in non-member countries, Community businesses invested two in another Member State. With the Single Market looming on the horizon, European businesses are being forced to restructure, and they are doing so mainly via direct investments: buy-outs, mergers, reciprocal acquisitions of holdings and the setting up of new business units... Unfortunately, Balance of Payments statistics cannot be broken down by these different types of investment.
Finally, in order to have some idea of its macroeconomic importance, extra-Community direct investment of all Member States, equalled about 0.8% of the Community's Gross Domestic Product and 3.8% of its Gross Fixed Capital Formation in 1988.
2- Geographical breakdown:
total); next come Germany and France, as regards investments outside the Community, and France and Spain as regards investments received from non-Community countries. In some cases, it seems to be a one-way trade: although Germany makes many investments, it is seldom on the receiving end, whereas Spain is in exactly the opposite position. The countries would have virtually the same ranking for ¡ntra-Community investments except that the Netherlands and the BLEU are also very active when it comes to capital movements within the Community. The scale of their investment flows becomes more apparent when the relative size of the country is taken into account.
3- Sectorial breakdown:
The European sectors investing most in other countries are, in descending orderof importance, energy (made up mainly of the major multinational petroleum companies), the chemical industries and finance and credit institutions, which comprise, as well as banks and financial institutions, holding companies which manage the participating interests (in the form of direct or portfolio investments) of their parent company (or group) in other companies. "Distributive trades, hotels and restaurants" would also appear to be a major sector for intra-Community investments.
Non-Community businesses invest mainly in the Community credit and finance sectors, in real estate and the food industries, to which must be added energy where intra-Community investments are concerned. The same comment applies to "credit and financial institutions": some of the investments received by this category are merely in transit via holding companies and are subsequently redistributed among other branches. The "real estate" branch shows investments in property companies and in the form of private purchases of second homes abroad.
First part : INTRODUCTION
Subject of the study: 14 Basic information used: 16 Data processing method: 17
Conventions adopted: 18
Second part : RESULTS
CHRONOLOGICAL DEVELOPMENT OF DIRECT INVESTMENT 20 Extra-community investment and comparison with USA and Japan: 20
Intra-Community Investment 25 GEOGRAPHICAL BREAKDOWN OF INVESTMENT 28
Warning 28 Extra-Community investment 29
Intra-Community Investment 39 SECTORIAL DISTRIBUTION OF INVESTMENT 46
Warning 46 Comments on the tables 49
REINVESTED PROFITS 55
Third part : METHODOLOGICAL ANNEX
DEFINITION OF DIRECT INVESTMENT 62
Denmark 66 Germany: 67 Greece: 67 Spain: 68 France: 69 Ireland: 70 Italy: 70 Netherlands: 71
Portugal: 72 United Kingdom: 72 United States and Japan 73
INTRA-COMMUNITY ASYMMETRY (after harmonisation by EUROSTAT) 74
MAIN SOURCES OF ASYMMETRY 79 Differences in the definition of an investor and of a direct investment enterprise: 79
Differences in the way of acquiring the link between the investor
and the direct investment enterprise 80 Differences in definition of a direct investment flow : 81
Differences in recording the same flow: 82
Various asymmetries: 82
CONCLUSION 84
Fourth part : STATISTICAL TABLES
EUROPEAN COMMUNITY 86 Geographical breakdown of extra-Community direct investment 86
Denmark 106 Germany 114 Greece 122 Spain 124 France 126 Ireland 134 Italy 136 Netherlands 144
Portugal 152 United Kingdom 160
UNITED STATES AND JAPAN 168
United States 168 Japan 172
Fifth part: OTHER SOURCES
G-BOP 176 Greece 178 Spain 181 Japan 187
Sixth Part: ANNEXES
Geonomenclature 194 Monetary Conversion Rates 196
EUROSTAT Questionnaire 197
First part : INTRODUCTION
The liberalization of capital movements of July 1990, in the context of the creation of the Single Market and the medium-term perspective of European Economic and Monetary Union has led to the increased need of the Commission of the European Communities for reliable statistics on international flows of capital. The Commission wishes to be able to evaluate the financial and economic impact of this process of integration, both on structures within the Community and on its relationships with the Community's partner countries or zones.
1-1 Subject of the study:
First of all, we shall give a rough definition of direct investment: the capital with which enterprises ("direct investors") finance the purchase, the creation or development of their subsidiaries abroad ("direct investment enterprises"), or acquire shares in foreign companies with which they establish a privileged relationship (a more strict definition is given in the methodological annex).
It is the existence of this supplementary relationship which allows direct investment to be distinguished from other capital movements, although the instruments of this financing (shares, bonds, cash credits...) are not specific to direct investment. Direct investors must in fact have a power of decision in the enterprise in which they invest for the capital they put in to be called direct investment: the profitability of their own enterprise is sometimes directly dependent upon the policies pursued by theirdirect investment enterprise. So, unlike ordinary shareholders who are only interested in the financial profit of their participation, direct investors want to be able to exercise an influence on the policy of the direct investment enterprise in which they have invested. This power may take the form of an important share in capital stock, representation on the board of directors, commercial partnership, dominant technical or financial liaison, etc... The direct investor is thus able to direct the activity of his direct investment enterprise so that he receives profits from his initial capital which are higher than those obtainable on a purely financial market: "direct investors are thereby in a position to derive benefits in addition to the property income that may accrue on the capital that they invest" (IMF -Balance of Payments Manual, 4th edition).
What special interest might the director investor have in creating a subsidiary abroad? Common reasons include:
— to escape protectionist measures by producing on the spot what was formally exported
— to find new markets or retain access to a market which he risks loosing to a bette r equ ipped competitor
— to produce under better conditions, such as lower labour costs, local raw materials etc...
— to economise on transport costs which effect the competitiveness of his products on the international market
— to benefit from legal provisions (less restrictive technical standards)
— to reduce his fiscal charges (lower taxes, special encouragement for new investments)
— to profit from advantageous financial conditions (interest rates leading to lower costs or greater profit)
— etc...
On the other hand, mergers or mutual shareholdings evidently find their justification in the economies of scale realized, particularly in sharing the management or research and development costs.
One may therefore expect that the restructuring of European enterprises, to achieve better integration in view of the opening up of frontiers in 1992, will come about mainly with the aid of direct investment. The intensification of this restructuring movement is already clear from other indicators: 453 acquisitions and mergers of Community enterprises have been reported to the United Nations Center on Transnational Corporations in 1988, and 754 in 1989!
1-2 Basic information used:
EUROSTAT receives the information gathered from Member States' Balances of Payments and publishes them each quarter (including the capital accounts) in EUROSTAT - External Trade - Monthly Statistics. This publication contains the quaterly foreign direct investment totals for a limited number of Member States. But EUROSTAT also receives (since 1982 to 1987 depending on Member State) specific and detailed questionnaires on direct investment, an example of which is annexed to this report (page 197). The information is generally submitted to EUROSTAT by the Central Banks or the National Statistical Institutes of the various Members of the European Community. These questionnaires provide the basic data for this report, although they often need to be supplemented by other data and by estimates. Member States have thus often been asked to provide information and EUROSTAT thanks them warmly for their cooperation.
An initial attempt at analysing these figures rapidly revealed a considerable lack of coherence in the statistics from national sources: the comparison of corresponding bilateral flows between Member States clearly showed that these states recorded capital movements which were extremely different. These differences could not simply be attributed to the classical problems of balances of payments such as the monetary conversion of transactions or the date of recording. In reality, the concepts employed were very different, the field covered by the statistics varied in size, collection methods were radically different, classifications were not compatible, etc...
It was therefore necessary to come to grips with the methodological problems. Some information in this respect was available to EUROSTAT (in the form of the Methodology of the Balance of Payments of some Member States published by the Office for Official Publications of the European Communities); other information had to be obtained directly from the Member States.
National methodologies were carefully examined on the specific subject of direct investment. Subsequently, Member States were requested to send certain supplementary data which enabled some corrections to be made to the initial data, the aim of these corrections, and indeed of the study, being to obtain figures which are more comparable and which can be added together to produce a EUR 12 total.
1-3 Data processing method:
As the data initially supplied by the Member States have often been subject to transformations (albeit slight) it may be useful to describe more precisely the steps that were followed, and to define a vocabulary in order to distinguish data at each step:
- at the first stage, we speak of "raw" data, exactly as communicated by a Member State, either using the EUROSTAT questionnaire or in some other form specific to that Member State. This latter case was very frequent, because the nomenclatures used by the Member States often did not fit easily into EUROSTAT's nomenclature.
- at the second stage, the examination of the various methodologies showed that it was necessary to correct figures in order both to improve their comparability and to be able to add them together. To this end, the Member States were individually contacted to obtain additional items of information which would allow the data to be corrected as required, i.e. to bring them better into line with the OECD Benchmark Definition (see methodological annex). Some of this information was obtained, other information was not. Either it was confidential, or, most commonly, it was simply not available, owing to national methods of collecting and compiling data. The data resulting from these corrections will be referred to as "harmonised", although rather erroneously since harmonization is in fact far from complete. All the figures published in this report which apply to one Member State are "harmonised", i.e. they have been drawn up exclusively with the aid of the data from the Member State but they do not necessarily correspond to the figures published by the Member State itself underthe heading "direct investment". This is because of differences in definitions. There are two exceptions: Greece and Ireland, for which EUROSTAT estimates are published, but only for the most important items.
- at the end of this project, many items of information were still missing for reasons such as: they were simply, entirely or partly unavailable, it was not possible to convert from a national classification to the EUROSTAT classification, there were breaks in series, etc.... These missing items of information were therefore estimated, as far as possible with the aid of specific documents of the country in question or with the aid of average structures. These data will therefore be termed "estimated". Only "estimated" data for the entire European Community (EUR12) are published here.
1-4 Conventions adopted:
Some final clarification is necessary: with the exception of paragraph 2-4 of the second part (Results) and the figures taken from the G-BOP database, all direct investment reported here is calculated without reinvested profits: reinvested profits are those profits which the board of directors of the direct investment enterprise (upon which the direct investor would normally sit) decides not to distribute to the shareholders but rather to reallocate to the development of the enterprise. These are thus fictitious flows in the Balance of Payments: in theory, the direct investor receives income from his direct investment (recorded in the current balance) and reinvests it immediately in his subsidiary (this reinvestment is then recorded on the line "direct investment" of the capital balance). In reality, these two inverse, but absolutely identical flows do not give rise to any settlement, which explains the difficulty of certain Member States in identifying them. As several countries have decided not to trace these flows, it seemed preferable to exclude them from the statistics of the other Member States which do record them rather than make a hazardous estimate for the former. This approach is clearly open to criticism since the scale of direct reinvestment can fundamentally affect the analysis of direct investment. Nevertheless, statistics on direct investment excluding reinvested profits do have meaning in that they indicate the savings produced in one economy which are transferred to another, whereas reinvested profits are produced and used on the same economic territory.
Moreover, the lack of detail on reinvested profits in most Member States would have weakened the analyses: reinvested profit is often recorded as a global figure but cannot be broken down by geographical origin or destination.
The sign convention used in this document is that of the Balance of Payments: capital flows are recorded: - with the sign +, if they enter the declaring economy; they may thus be investment in the declaring economy coming from abroad or disinvestment abroad by the declaring economy (repatriation of capital).
- with the sign -, if they leave the declaring economy; they may thus be either investments abroad by the declaring economy or disinvestment by foreign countries on the territory of the economy in question.
Consistency between tables is generally respected unless otherwise indicated. However, all the supple-mentary tables in the fifth part, which are given for information only, are not compatible with the other data. The reasons for this are explained under each table or group of tables.
Second part : RESULTS
Although the reliability of the statistics presented here is far from acceptable (see methodological annex), given the order of magnitude of the trends observed, some major conclusions can still be drawn. The major trends in European direct Investment will be examined in terms of :
— their development over time
— their geographical origin or destination
2-1 CHRONOLOGICAL DEVELOPMENT OF DIRECT INVESTMENT
The source of data used did not allow us to produce a long series of data going back many years. Nevertheless, a non-homogeneous series of direct investment for the years before 1984 is also given here, as supplementary information.
2-1-1 Extra-community investment and comparison with USA and Japan:
During the period under consideration (84-88), the European Community has always been a net investor: the capital leaving the EC every year is roughly double that which comes into it (31 thousand million ecus leaving to compare to 14 coming in, for the last available year).
Table 2-1:
Direct investment: comparison between European Community, United States and Japan
Unit: million ECU
year made by:
EUR 12 USA JAPAN O received by: EUR 12 USA JAPAN f )
net investment by: EUR 12
USA JAPAN f )
84
-17395 7128 -7558
6177 28460 -13
-11218 35588 -7571
85
-15349 1233 -8455
5637 26733 841
-9712 27966 -7614
86
-22164 -8796 -14713
6840 36969 230
-15324 28173 -14483
87
-30780 -8605 -16916
12578 39357 1010
-18202 30752 -15906
88
-30711 -1997 -28931
14278 43870 -410
-16433 41873 -29341
Sources: EUROSTAT estimates, Survey of Current Business, and Bank of Japan
(*) These data are investments recorded in the Balance of Payments by the Bank of Japan, and not the investments "notified" to the Ministry of Finance.
Japan is also a net exporter of direct investment capital: although the level of investment made by Japan is comparable to that of the European Community (29 thousand million ecus in 1988), the level of investment it receives is virtually nil compared to that of both the European Community and the United States.
Graph 2-1 :
Outward investment
10000 - r
million ecus
-10000
--20000
--30000
--40000 - L
□ EUR 12
■ USA
M JAPAN
84 85 86
year
87 88
Between 1984 and 1988, direct investment by the European Community in other countries virtually doubled; from 17 thousand million ecus in 1984, it reached 31 thousand million ecus in 1988; this corresponds to an average increase of 15% per year, although much of it was in fact concentrated on the years 86 and 87, while the last year studied, 1988, shows a virtual stagnation of such direct investment, at a level of 31 thousand million ecus. During that year, greater effort was put into intra-Community investment, as we shall see below.
Nevertheless this remarkable upswing is clearly not as large as that recorded by Japan (whose investment abroad quadrupled in 4 years, i.e. increasing at an annual rate of 40%). Japan is now on virtually the same level as the European Community: in 1988, Japan made 29 thousand million ecus of outward direct investment, compared with 31 thousand million ecus for the European Community.
Graph 2-2:
Inward Investment
Π EUR 12
million ecus
50000 -r
40000
30000
-20000
10000
-10000 -L
USA JAPAN
84 85 86
year
87 88
However, as regards capital received from other countries, the European Community seems to be a more and more attractive destination by comparison with the United States and Japan : between 1984 and 1988, whereas incoming capital more than doubled for the Community, it went up by one half in the United States and varied from one year to another in Japan, while always remaining at a very low level. It is also noticeable that capital coming into the Community, though always lower, has increased more rapidly than the outward capital (average increase of 23% per year to compare to 15%). The Community, although a net exporter of direct investment capital, can therefore be considered as an attractive zone for this kind of capital.
Once again, the jump in the space of four years from 6 to 14 thousand million ecus in investment coming from other countries was not regular: there was virtual stability between 84 and 86 and a sudden take-off in 87.
Nevertheless, although it is increasing more rapidly, direct foreign investment in the Community (14 thousand million ecus), was still only at one third the level of investment in the United States in 1988 (44 thousand million ecus). Moreover, about half of this inward investment In the United States is provided by the Community each year (and even 3/4 in 1987).
It was not possible to extend this study over a longer period since data for earlier years are not statistically consistent with those presented here. However, without using the figures directly, one can discern clear trends from the data in EUROSTAT's G-BOP data base (see the fifth part, tables 5-GBOP-1 and 5-GBOP-2 on pages 176 and
177).
This database records direct investment as it is declared by countries in accordance with their national definitions. For example, it includes direct investment with reinvested profit for certain countries and direct investment without such profits for others. In addition, the investment declared by the Community Member States also includes intra-Community investment. The base is thus difficult to use for comparisons or structural studies. On the other hand, it is reasonable to suppose that one can discern broad trends with little risk of being mistaken.
Reading these series shows that the Community has not always been a net investor; it is only since 1978 that its investment in other countries has been regularly higher than the investment received from other countries.
Graph 2-3:
Net direct investment - Source: GBOP
40000 -r
30000
20000
10000
--million ecus
Tï^b..-ΙΟ
-10000
20000
--30000
->-70 71 72 73 74 75 76 77 78 79 80 81 82 83 84 85 86 87 88
year
— EUR 12 - - USA ■·· JAPAN
Graph 2-4:
Outward Investment - Source: G-BOP
10000 - r
million ecus
10000
20000
--30000
40000
50000
--60000
EUR 12 USA JAPAN
70 71 72 73 74 75 76 77 78 79 80 81 82 83 84 85 86 87 88 year
Graph 2-5:
Inward Investment - Source: G-BOP
million ecus
It is also clear looking at this wider period that there is a long-term trend of growth in direct investment capital outflows and inflows of the Community. However, this trend was not totally regular. Moreover, looking to each Member State's statistics (tables on pages 176 and 177), we often find speeding up followed by levelling off. In some cases, the acceleration may be more connected with the overcoming of legislative obstacles than with economic necessity or new opportunities.
For example, the liberalization of capital movements in the United Kingdom in 1979 probably explains the development from that year onwards, and similarly the Big Bang in the City of London would account for the new leap in 1987.
As inflation has fallen in recent years, growth of direct investment flows in real terms is now stronger on average than during the previous decade. The more rapid growth which can be observed at the end of series on the two graphs therefore represents a real acceleration of direct investment capital outflows and inflows.
2-1-2 Intra-Community Investment
In view of the source of the data (Balance of Payments), intra-Community direct investment istaken here to be the investment made by a company resident in one Member State in another company resident in another Member State. It does not include investment internal to each Member State.
Table 2-2:
Intra-Community direct investment
million ecus Declared by :
investing countries
countries receiving investment
84 85 86 87 88
-4265 -6987 -12469 -12646 -19076 4358 5666 10354 11722 22976 Source: EUROSTAT estimates
The broad trends are essentially the same whether one uses investment declared as outgoing by the investing country or investment declared as incoming by the country receiving the investment (the two series are unfortunately not identical, the methodological annex supplies some explanations for this phenomenon) : intra-Community investment went up 5 times between 1984 and 1988, from 4 to 20 thousand million ecus within 4 years. Again, as for extra-Community investment statistics, the increase is irregular: almost doubling in 1986, levelling off in 1987, and doubling again in 1988.
Graph 2-6:
Intra-Community direct investment
20000
10000
-million ecus
-10000
-20000 -L
Declared by countries receiving investment
Declared by investing countries
84 85 86
year
87 88
European companies have not, therefore, simply waited for the Single Market of 1992, nor even the liberalization of capital movements of July 1990, to reorganize themselves. It will be very interesting to see whether this acceleration continues or whether a saturation period will ensue. Of course, the accelerating curve of direct investment cannot continue indefinitely : direct investment in a given country often reflects major operations in which companies merge or are bought up, and such operations are clearly not repeated every year; they are carried out in favourable periods such as during the new opening-up of the capital market or when a particularly favourable exchange rate applies (in this respect, direct investment in the United States can be linked to the international rate of the dollar).
While anticipation of the Single Market has had a significant impact on the rate of intra-Community direct investment, this driving force is likely to reach a limit in a few years' time, when the Single Market has reached its cruising speed. By then, European enterprises will probably have attained their optimal dimensions, at least regarding their internal market. But of course, before then, other factors could come into play encouraging the European companies to invest in other European enterprises.
In conclusion, it should be noted that the level of intra-Community investment is below that of extra-Com-munity investment; in 1988, for every 2 ecus invested in another Comextra-Com-munity country, the Member States invested 3 ecus outside the Community. The relative share is, however, on the increase, since in 1984 the same ratio was only one ecu in the Community for every 4 outside.
Graph 2-7:
Comparison between intra and extra-Community direct investment
-10000
million
ecus -20000
-30000
---40000 -L
Ü direct investment outside the EC 0 Intra-EC
direct investment
84 85 86
year
87 88
2-2 GEOGRAPHICAL BREAKDOWN OF INVESTMENT
2-2-1 Warning
Some preliminary words of warning are needed to avoid misinterpretation of the following figures: the criterion for geographically allocating direct investment is notthe same for all the Member States of the Community: atransaction can be allocated to the 1) country which has received or ordered the counterpart payment, 2) the country of residence of the co-contractor, 3) the country in which the investor or the enterprise of investment is located etc.; there is no fixed rule and the same type of flow is not necessarily allocated in the same way by each country (see methodological annex). The aggregate calculated for EUR12 is therefore open to criticism.
In particular, the existence of holding companies, or other companies involved in financial intermediation, weakens the validity of the analyses which can be made. These companies, on their parent company's behalf, manage different shareholdings (either direct or portfolio Investment) in other companies.
Indeed, for the Member States, in the Balance of Payments accounts, a capital flow with a holding company is normally attributed to the country in which the holding company is situated, although from an analytic point of view it would be more logical to attribute it to the country from which it initially comes or to which it finally goes. Statistics on stocks (as opposed to flows), which describe the net international position of a country vis-a-vis another, generally prefer that second method of compilation.
For example, in the United States, there are two parallel series for foreign direct investment in american subsidiaries: direct investment is broken down either according to the FPG (Foreign Parent Group) criterion, i.e. allocating the investment to the country directly carrying out the transaction with the American subsidiary, or according to the UBO (Ultimate Beneficial Owner), i.e. allocating the investment to the originating country which is identified by proceeding up the enterprise's ownership chain until the initial investor is found. For flow statistics (Balance of Payments) which are given in this study, the FPG criterion only as been used.
In addition, flows passing via a holding company could be counted twice if they are reinvested in a direct investment enterprise located in a third country: firstly when they enter the country in which the holding company is located and secondly when they leave. The total amount of both inward and outward flows thus increases without producing a really significant economic impact in the country of location of the holding company.
As a result, important direct investment flows are reported with "tax havens" such as Netherlands Antilles, Bahamas, Bahrein, Cayman Islands and Panama, but, can one really argue that these countries are large investors or receive substancial direct investment? Net recording by the country where the holding company is located is not to be recommended either, since it does not allow the direction of the capital movements to be monitored.
An appropriate solution might be to classify such flows separately. Unfortunately, given the present state of the statistics collected, it would seem to be impossible to measure the size of these transient flows. And at the moment, stock statistics are limited to too small a number of countries.
We shall therefore limit our comments on this subject to those which are unlikely to be invalidated by using different principles of geographical allocation.
2-2-2 Extra-Community investment
The old saying "one only lends to the rich" turns out to be true. Indeed with the single exception of investment received from abroad in 1985, between 3/4 and 9/10 of movements (in both directions) of Community direct investment capital was carried out with the countries of class 1 (western industrialized countries). This is therefore an overwhelming majority. The remaining movements were carried out almost entirely with countries of class 2 (developing countries), the countries of class 3 (state-trading countries) being only a small residual amount.
This concentration of direct investment flows among western industrialized countries is not particularly surprising: direct investment links between enterprises from different countries are usually established in order to benefit from such favourable conditions as:
— relative freedom for incoming and outgoing flows of capital (especially income deriving from invested capital)
— existence of factors of production (educated staff, energy, raw materials...) which are at least as advantageous as in the country of origin
— a financially solvent market and a reliable communications infrastructure.
These conditions are more often encountered together in countries of class 1. The condition regarding the freedom of capital movements could of course explain the share of direct investment towards "tax heavens" of class 2. Unfortunately, with the statistical means available for this study it is not possible to distinguish these countries separately.
However, within class 1, the breakdown according to the country of origin of the inward flows is not the same as the breakdown according to the country of destination of the outward flows: let us begin with the outward direct investment of the Community:
Table 2-3:
Geographical breakdown of outward direct investment of the Community
million ecus
year partner country
USA Japan EFTA other class 1 class 2 class 3 not allocated
84
-11650 -295 -929 -1323 -2970 -50 -177
85
-10063 -36 -760 -796 -3535 -131 -27
86
-17662 -116 9 -1866 -2167 -159 -204
87
-23901 -18 -1826 -1673 -3017 -30 -315
88
The main country receiving investments from the Community is without doubt the United States, which each year counts for at least 2/3 of the Community's investment in other countries. When the dollar exchange rate lowers, investment in the United States becomes less expensive for European countries, and this may be the reason why large movements of capital toward this country occured during part of the period under review.
The countries other than the United States share the remaining third, with the largest part of this going to "other countries in class 1 " (up to 11 % of the total), mainly Canada, to the countries of EFTA (up to 8 %), or to the "other countries of class 2", depending on the year.
The share of the developing countries has tended to be whittled down, but the series is a little short to draw definite conclusions. The agreements with the ACP countries (excluding Nigeria and Gabon, which also belong to the class constituted by the OPEC countries) hardly seem to have had an impact as regards direct investment, which is very low (see more detailed tables in fourth part).
Details are lacking on the destination of investment in "other class 2" which includes among others: — Newly Industrialised Asian Countries which are not a priori part of geographical zones traditionally
influenced by the Community, but which offer more and more characteristics favourable to direct investment
— Latin American countries, which may have more significant relations with the Community in the future, given that Spain and Portugal have joined the Community
— but also a certain number of "tax havens" through which investments are merely channelled to other countries.
Graph 2-8:
As regards direct investment on the territory of the Community, comments are not quite so clear cut:
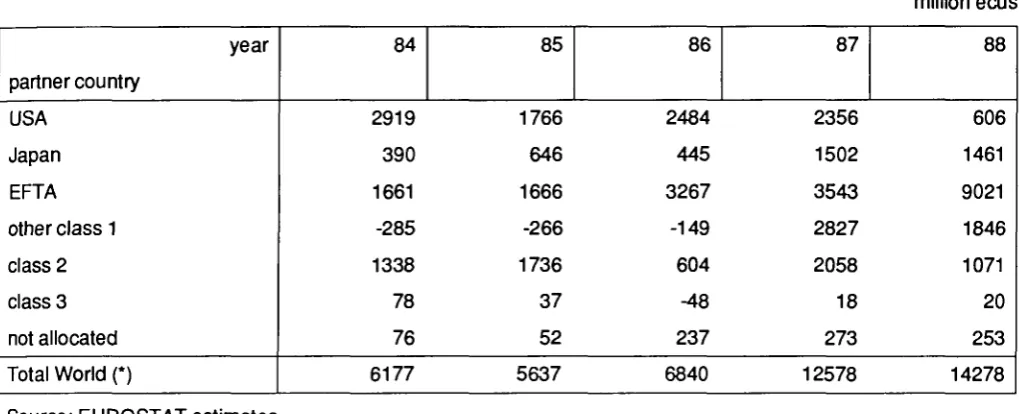
Table 2-4:
Geographical breakdown of inward direct investment of the Community
million ecus
year partner country
USA Japan EFTA other class 1 class 2 class 3 not allocated Total World (*)
84
2919 390 1661 -285 1338 78 76 6177
85
1766 646 1666 -266 1736 37 52 5637
86
2484 445 3267 -149 604 -48 237 6840
87
2356 1502 3543 2827 2058 18 273 12578
88
606 1461 9021 1846 1071 20 253 14278
Source: EUROSTAT estimates
(*) Excluding intra-Community investments.
The majority of foreign direct investment made in the Community comes once again from the Western Industrialized Countries: their share in the total investment received by the Community varied beetwen a minimum of 68% in 1985 and a maximum of 91% in 1988.
Although, overall, our principal partners are still the developed countries (class 1), certain movements can be seen within this class:
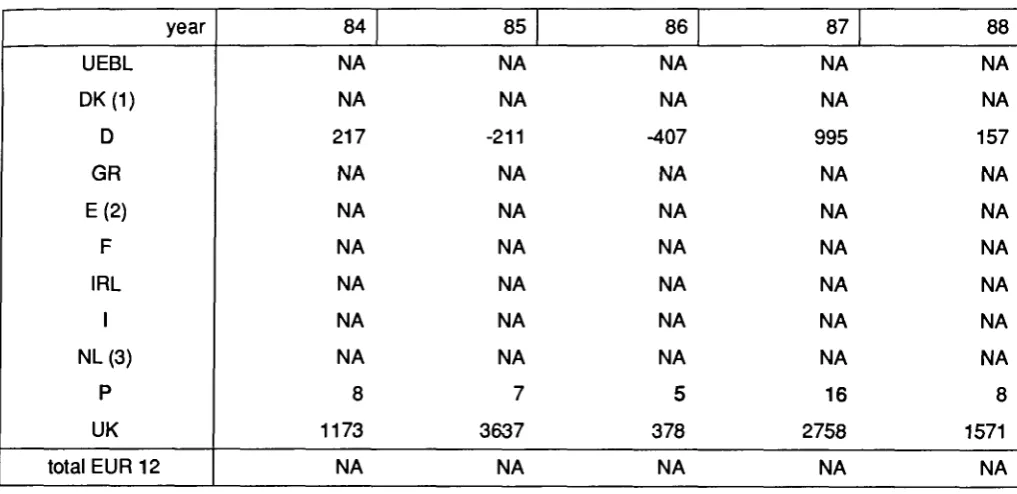
[image:33.595.33.543.156.363.2]— a very marked decline in American investment in Europe (falling from 47 % of the investment received by the Community in 84 to 4 % in 88) although it should be pointed out that the corresponding statistics of American origin (which exclude reinvested profits) are very different:
Table 2-5:
US direct investment in the Community
year Source EUROSTAT
84 2919
85 1766
86 2484
87 2356
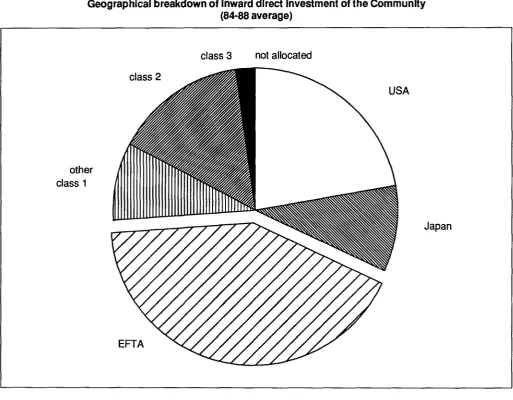
Graph 2-9:
Geographical breakdown of inward direct investment of the Community (84-88 average)
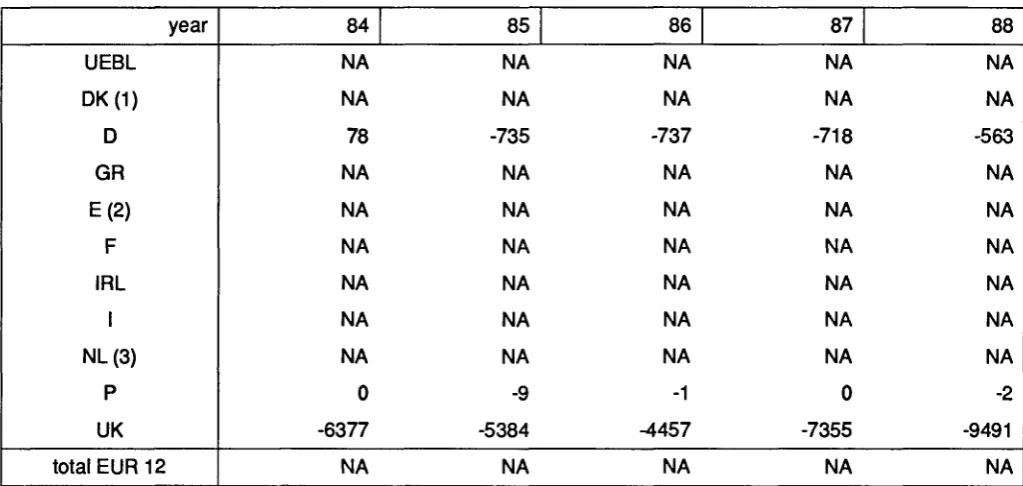
[image:34.595.61.575.101.501.2]A reasonable level of Japanese investment (around 10% of the total) which is no doubt on the increase. The Japanese source (Balance of Payments) shows this more clearly:
Table 2-6:
Japanese direct investment in the Community
year Source EUROSTAT
Source Bank of Japan
84 390 -1062
85 646 -1060
86 445 -2792
87 1502 -3115
One might, quite legitimately, be astonished by the major differences between the EUROSTAT source and the Japanese source. It is possible that some Japanese direct investment is channelled via third countries, or via financial centers as Amsterdam or Luxembourg, which do not record investment received by their resident holding companies as direct investment. On the other hand, this investment, if redistributed later on elsewhere in the Community, may then be recorded as intra-Community investment by the other Member States (which, incidentally, may also partly explain the difference between the intra-Community investment declared as undertaken by investing countries and that declared as received by countries receiving investment).
— and in particular, one sees the growing importance of investment by EFTA which grew from less than 2 thousand million ecus in 84 to 9 thousand million ecus in 88; since 1986, EFTA has been the major investor in the Community, clearly exceeding the United States and Japan. The prospect of a large unified market and the disappearance of fragmented markets may have played a role in this phenomenon; the relative cost of crossing a large number of borders is clearly higher for countries which are close than for those which are far away.
Investment by countries outside class 1 are essentially made by those belonging to "other class 2 countries" (on average about 13% of total investment), but countries of OPEC , which naturally have more resources and especially foreign currency than most of developing countries, also play a part, albeit a fluctuating one.
Once again it should be noted that the class entitled "other class 2 countries" includes "tax havens", the role of which, concerning direct investment is often limited to the channelling of funds. It is therefore probable that the capital invested by "tax haven" countries in Europe originates from another third country, and so could probably be added to the investment coming from class 1 countries.
It is also interesting to see that investment from the European Community, although concentrated on the developed countries of class 1, does not always give rise to reciprocal movements:
— the Community invests a great deal in the United States but the United States invests little in the Community
— Japan invests in the Community but the Community's investments in Japan are insignificant
— EFTA countries invest strongly in the Community but the Community little in EFTA.
Table 2-7:
Share of each Member State in outward direct investment of E.C.
Source: EUROSTAT estimates
Graph 2-10:
million ecus
year UEBL
DK D GR
E F IRL
I NL Ρ UK total EUR 12
84 53 -218 -2978 -48 -210 -1747 -100 -1511 -1002 -11 -9623 -17395
85 -73 -172 -4020 -191 -219 -2379 -108 -598 -2452 -17 -5119 -15349
86 -605 -401 -5364
-63 -241 -3531 -40 -861 -1245 -5 -9809 -22164
87 -569 -241 -5213 -9 -227 -3483 -86 -492 -3775 -6 -16679 -30780
88 -1870 -294 -5284 -9 -552 -3957 -622 -1142 -3214 -2 -13765 -30711
The United Kingdom alone generally accounts for half of the Community's outward investment. Then comes Germany (varying between 17 and 26 %), followed by France (between 10 and 16% of the total) or the Netherlands (between 6 and 16% of the total), depending on the year.
These different investment shares can be explained partly by the relative size of the countries (in area, in population...), but also by other effects such as:
— the availability of foreign currency, due to a long-standing surplus on the current account balance (e.g. of Germany, of course, but also Netherlands and BLEU)
— the degree of freedom of international capital movements and the length of time this freedom has existed (United Kingdom, Luxembourg)
— the historical inheritance of numerous and important trade partners (Commonwealth, past colonies)
— the existence of a world-famous financial market (London)
The study of the sectorial breakdown of investment (page 49 onwards) also shows that the localisation of large petroleum companies in a country constitutes a supplementary factor inducing outward investment: the first large multinational companies were built in this sector, since it was obviously necessary to work the oilfields on the spot, and their intensity of investment has not lowered since they were established.
As regards investment by non-EC countries in the Community, the United Kingdom occupies first place on average, but less clearly so.
It is followed by France, Spain and Italy.
Table 2-8:
Share of each Member State in inward direct investment of E.C.
Source: EUROSTAT estimates
Graph 2-11 :
million ecus
year UEBL
DK D GR
E F IRL
I NL Ρ UK total EUR 12
84 67 48 115 -26 1417 1387 -28 924 143 135 1995 6177
85 521 169 295 102 1327 1677 259 28 512 123 623 5637
86 153 160 246 202 1075 1387 10 -456 691 48 3324 6840
87 695 153 188 87 1338 2056 310 1745 923 97 4986 12578
88 1276 347 -1 65 1799 1813 190 3063 963 203 4562 14278
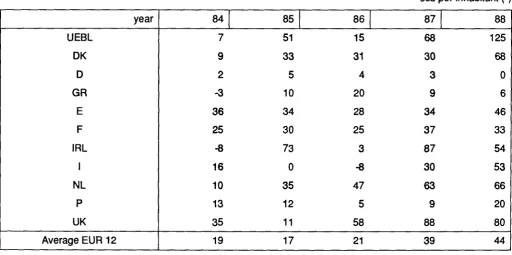
Nethertheless, to judge the relative weight of investment within the Community, the scale must be changed so that not only total investment is considered but also relative investment; for example, investment per capita (calculated on the basis of population in 1987):
Graph 2-12:
Annual average investment per Inhabitant (84-88 average)
100-r
50--Í investment received from extra-EC countries
in ecus
50
100
150
--200 -1
-investment made in extra-EC countries
UEBL DK GR IRL NL UK average
EUR 12
The size effect is then largely eliminated, and we notice that Netherlands have a level of investment close to United Kingdom's, which remains the largest investor outside the Community. It is also evident that BLEU and Denmark, in proportion to their size, are heavy investors outside the Community, with a level of investment on a par with that of in France. (Ireland too, but the figures used for Ireland are not very reliable).
Table 2-9:
Annual average outward direct investment in extra-E.C. countries
ecu per inhabitant (*)
year UEBL DK D GR E F IRL I NL Ρ UK Average EUR 12
84 5 -42 -49 -5 -5 -31 -28 -26 -68 -1 -169 -54 85 -7 -33 -66 -19 -6 -43 -31 -10 -167 -2 -90 -47 86 -59 -78 -88 -6 -6 -63 -11 -15 -85 0 -172 -68 87 -56 -Al -85 -1 -6 -63 -24 -9 -257 -1 -293 -95 88 -183 -57 -86 -1 -14 -71 -175 -20 -219 0 -242 -95 Source: EUROSTAT estimates
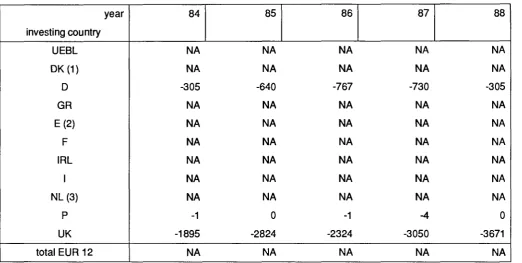
Table 2-10:
Annual average inward direct investment from extra-E.C. countries
ecu per inhabitant (*)
[image:40.595.58.571.484.739.2]2-2-3 Intra-Community Investment
At this level, two different sources of data were available: an intra-Community direct investment is in principle reported both by the investing country and by the country receiving the investment, as a change on the assets side for one and, on the liabilities side for the other. But there are large bilateral asymmetries between Member States'statistics: the total amount of investment that country A declares it makes into country Β is not equal to the amount country Β declares it receives from A. Reasons for these asymmetries are briefly explained in part 3 (methodological annex).
A choice had thus to be made between the statistics of a given country and those of its partners: we have chosen not to present series made up of flows to or from EUR12 as declared individually by each Member State (a series, moreover, which is not complete), but rather to use the aggregated flows (and sometimes estimated ones) declared by other Member States as coming from or going to the Member State in question (see notes at the bottom of the following tables). This aggregation, which mixes up the special features of the methodology of each state in one common basket, seems to give the best guarantee of comparability (though this remains to be demonstrated).
By this means we obtain the following tables and graphs:
Table 2-11 :
Intra-Community direct investment declared by countries receiving investment (*)
million ecus
year investing countries
UEBL DK
D GR
E F IRL
I NL Ρ UK not allocated
84
884 113 660 9 13 694 26 492 340 3 1095 33
85
335 105 1243
6 26 625 35 218 555 16 2480 -20
86
322 174 2085 3 67 947 51 581 2810 0 3118 232
87
1544 169 1398 2 159 3047
73 590 1350 -3 3266
125
88
Graph 2-13:
Breakdown of intra-Community investment according to the investing country (84-88 average)
At this level of detail, the relative shares of each country can sometimes be affected by one single major operation which is made in a given year. It is therefore very difficult to describe general trends unless one looks at the average over 5 years (which has been done in the above graph). If we want to make valide comparisons, it is also important to eliminate the effects due to the relative sizes of the different countries. However, whatever method is chosen to eliminate this effect, in international exchanges, the following factor will always complicate the analysis : what is interregional exchange for a large country is international for a country with a smaller geographical surface area.
In absolute terms, let us simply note that the greatest intra-Community investment is always made by the United Kingdom (except in 88), ahead of Germany and France, which are about to swap positions (German investment in the Community is declining (at least in relative share), and French increasing). This dominant position of United Kingdom as the largest investor in the Community is not so obvious as the one he takes in extra-Community investment (compare above graph with graph 2-10 on page 34).
When considered in terms of direct investment per capita (following table and graph 2-15 on page 45), the dynamism of BLEU and above all of the Netherlands is much more evident, since, on average, their level of investment is in broad terms over twice the Community average.
Table 2-12:
Average intra-Community direct investment declared by countries receiving investment (*)
ecu per inhabitant
year investing country
UEBL DK
D GR
E F IRL
I NL
Ρ UK Average EUR 12
84
86 22 11 1 0 12 7 9 23 0 19 13
85
33 20 20 1 1 11 10 4 38 2 44 18
86
31 34 34 0 2 17 14 10 192 0 55 32
87
151 33 23 0 4 55 21 10 92 0 57 36
88
159 45 34 1 6 87 62 20 441 3 103 71
Source: EUROSTAT estimates
(*) Same remark as in table 2-11
It is also noticeable that Denmark has a level of investment which is similar to that of Germany.
As regards investment received, the ranking is not the same:
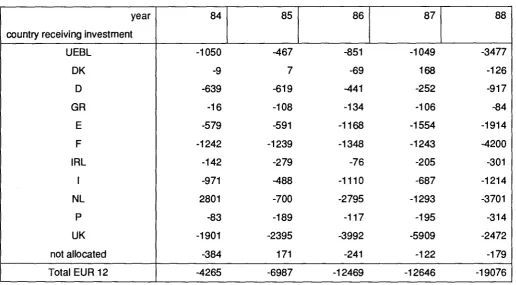
Table 2-13:
Intra-Community direct investment declared by investing countries (*)
million ecus
year country receiving investment
UEBL DK
D GR
E F IRL
I NL
Ρ UK not allocated Total EUR 12
84
-1050 -9 -639 -16 -579 -1242 -142 -971 2801 -83 -1901 -384 -4265
85
-467 7 -619 -108 -591 -1239 -279 -488 -700 -189 -2395 171 -6987
86
-851 -69 -441 -134 -1168 -1348 -76 -1110 -2795 -117 -3992 -241 -12469
87
-1049 168 -252 -106 -1554 -1243 -205 -687 -1293 -195 -5909 -122 -12646
88
-3477 -126 -917 -84 -1914 -4200 -301 -1214 -3701 -314 -2472 -179 -19076
Source: EUROSTAT estimates based on partner countries' data
(*) Same remark as in table 2-11 : an investment in the country in question is here recorded as negative, contrary to the conventions adopted elsewhere.
Though the United Kingdom is usually the greatest receiver of capital from the rest of the EEC in absolute terms, comparably little capital finds its way to Germany, but much is directed to France, the Netherlands (except for
Graph 2-14:
Breakdown of intra-Community investment according to the country receiving investment
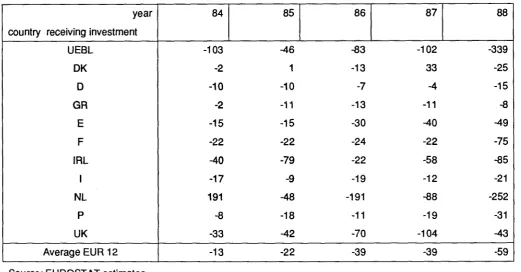
If analysis is taken further by considering the number of ecus received per capita, one can see that it really is the Netherlands (except in 84) and BLEU which are out in front. These two countries are, therefore, both large suppliers and large receivers of direct investment capital.
Table 2-14:
Average intra-Community direct investment declared by the investing countries (*)
ecu per inhabitant
year country receiving investment
UEBL DK
D GR
E F IRL
I NL
Ρ UK Average EUR 12
84
-103 -2 -10 -2 -15 -22 -40 -17 191 -8 -33 -13
85
-46 1 -10 -11 -15 -22 -79 -9 -48 -18 -42 -22
86
-83 -13 -7 -13 -30 -24 -22 -19 -191 -11 -70 -39
87
-102 33 -4 -11 -40 -22 -58 -12 -88 -19 -104 -39
88
-339 -25 -15 -8 -49 -75 -85 -21 -252 -31 -43 -59
Source: EUROSTAT estimates
(*) Same remark as in table 2-13
This role played by these two centres is not limited to the redistribution of Community capital within the Community. Capital from third countries to the Community and capital from the Community into third countries also passes through Netherlands and BLEU. Consequently, misleading transformations from intra-Community into extra-Community capital (and vice-versa) can take place. This explains the importance of the geographical allocation criterion and of the choice of the data source: the BLEU and Netherlands do not record as direct investment the transactions of their resident companies.
Graph 2-15:
Annual intra-Community investment per inhabitant (84-88 average)
200 -r
150
-100
investment made in other Member States
5 0
-in ecus
W^
Ε^Γ*
i
1
50--100
-150
1
investment received from other Member States
UEBL DK D GR E F IRL I NL UK average
2-3 SECTORIAL DISTRIBUTION OF INVESTMENT
2-3-1 Warning
The study of direct investment in general gives rise to problems of statistical harmonization, and we have seen that the study of their geographical breakdown is still more complicated because of the difficulty in geographically allocating the capital flows. But what about the breakdown by branches of activity? Here there are two additional difficulties: the distinction between the resident branch and the branch receiving the investment, and questions of classification, which have so far posed no major problem as the geonomenclatures used by the Member States are reasonably consistent.
The problem of resident branch/branch receiving the investment is most easily explained by means of an example:
Suppose an enterprise E1 situated in country A and exercising an activity of type X, invests in an enterprise E2 located in country Β and exercising an activity of a different type Y. The geographical classification of this investment does not lead to confusion (in the simple cases!): A records an investment from Β and Β records an investment from A. But what about the classification of this flow by type of activity or branch?
Country A can choose to allocate the investment activity X (that of his resident enterprise) or activity Y (that of the enterprise in which the investment is made). Country B, in turn, allocates code Y to the investment, this being the code of his resident enterprise which coincides with the code of the enterprise receiving the investment. One might think that Β could equally allocate the investment to the activity code of the investor, but in fact this criterion is rarely encountered. If the two countries choose the criterion "branch of resident enterprise", the same flow will be recorded with a different activity in each country though each of the statistics will be meaningful. If the two countries use the criterion "branch of the enterprise receiving the investment", the flow will have the same activity code in the two countries, which may seem desirable, but clearly part of the information will have been lost.
And what happens if both countries adopt two different classification criteria? The aggregated statistics of these two countries then have little meaning. This is exactly what happens with Community statistics: of the 12 countries, 6 use the criterion of resident branch, 3 that of the branch receiving the investment (Denmark, Spain and United Kingdom whose preponderance as regard direct investment has already been pointed out) and 3 cannot present statistics on direct investment broken down by branch of activity in any way at all.
Statistics obtained by simple aggregation (estimating the breakdown forthose countries not supplying data) are nevertheless presented here. Indeed, without going so far as to say that the problem is not a real one, examining statistics of direct investment stocks held in other countries and originating in Germany and France shows that the two breakdowns, one by resident branch ( in this case, investor's branch) and one by the branch receiving the investment, do not differ very much. The main difference is that the investors are normally found in the production sectors (industrial sectors) whereas the enterprises receiving the investment are more often in the sectors of trade or financing.
Classification of the Netherlands : — Industries
Fuel, power and chemical products • Metal products and electronic equipment
Food, beverage and tobacco
• Textiles, paper, clothing and other manufactured products — Services
• Trade, repair, catering.etc... • Transport and communication • Banking and insurance • Other services
— Other
— Unclassified
— TOTAL
Classification of Spain
— Agriculture, breeding, hunting, forestry, fishing
— Energy and water
— Non-energy mineral products and chemical products — Metal products and precision mechanical products
— Other manufacturing industries
— Construction
— Trade, hotels and restaurants
— Transport and communications
— Financial institutions, insurance and services to businesses
— Other services
— TOTAL
Three branches seem more or less the same : metal products, etc., Trade, hotels and restaurants, and Transport and communications. All the others are aggregated differently.
The difficulties of matching up these classifications are equally apparent when reading the detailed country tables (fourth part) since they show only those Member State figures which we thought matched up sufficiently with the classification used for this study. All the other data have been estimated in order to calculate a EUR12 total as explained below.
We have therefore tried to keep a fairly detailed classification (18 headings) at the cost, if necessary, of estimating data. This classification is mainly made up of aggregations of the items given in the EUROSTAT questionnaire. Fortunately, the United Kingdom (except for some confidential information), Germany (except for a part of services), France and Italy (in the main), which is already a good part of the Community particularly as regards direct investment, use something close to this classification for their questionnaire returns.
For the other countries (at least those supplying a breakdown of direct investment by branch), their national classifications most of the time had to be split into two or several sub-positions, or sometimes headings needed to be added together (this caused no problem of course). Wherever possible, supplementary data specific to that Member State were used for estimating purposes, e.g. :
— data on stocks for Germany
— average data for the period 1985-1988 for Denmark
— supplementary data given in the annual report of the Bank of Italy
— supplementary data given in the quarterly bulletins of the Netherlands
For the want of a better solution, in order to split-up an item, we have used the breakdown of sub-items observed in the rest of the Community; for example, to change the item "Fuel, power and chemical products" for the Netherlands into an "energy" item ( = Fuel + Power, and which includes the oil industries) and an item "Chemical industries", we looked to see how these two items were broken down under investments for Germany, France and the United Kingdom and then applied this breakdown to the Dutch overall heading "Fuel, power and chemical products".
When data were completely missing (BLEU, Ireland, and Greece to some extent), we used the structure of the total of the 8 other countries of the Community.
In view of these remarks, it is evident that the structure of Community direct investment described here is only approximate. We shall scrupulously refrain from giving an exact definition of the items in the classification which follows. In view of its origin, a broad correspondence table with NACE-CLIO R 25 could nevertheless be drawn up :
— Energy : heading 06 of NACE-CLIO R 25
— Agriculture and Food products: headings 01 and 36
— Métairies : headings 13 and 19
— Machinery : heading 21
— Transport equipment : heading 28
— Electric and electronic goods: headings 23 and 25
— Chemical industry : heading 17
— Other industries : headings 15,42, 47, 48 and 49 — Building and construction : heading 53
— Finance and Banking : part of heading 69
— Insurance : part of heading 69
— Trade, lodging and catering : headings 56 and 59
— Transport and communication : headings 61, 63, 65 and 67
— Real estate : part of heading 74
One important comment :whenever"holdingscompanies"were identifiable, they were classified under"credit and financial institutions". These companies create considerable problems; sometimes they are completely missing from statistics on direct investment drawn up by the Member States, sometimes they are to be found under the main activity of the group to which they belong, which in turn leads to additional difficulties of interpretation (the question of holding companies is referred to again in the methodological annex).
2-3-2 Comments on the tables
In view of the lack of precision surrounding these statistics on direct investment broken down by branch, the resulting data are full of uncertainties and these comments will therefore be extremely brief :
Table 2-15:
Sectorial breakdown of outward direct investment of E.C.
million ecus
year Branch
Energy
Agriculture and food products
Metallics, machinery and transport equipment Electric and electronic goods
Chemical industries
Other industries, not allocated industries Finance and Banking
Insurance
Trade, lodging and catering Real estate
Other services, not allocated services Other, not allocated
TOTAL
84
-8745 -531 -1737 -739 239 125 -2941 -897 -1228 -382 -231 -329 -17395
85
-2195 336 -1907 4 -3849 12 -2124 -1863 -2137 -288 -1079 -257 -15349
86
-1382 -833 -948 -1533 -5321 -2012 -2932 -1247 -1781 -135 -3092 -948 -22164
87
-4651 -2352 -2382 -2220 -3655 -1889 -1620 -1029 -4738 -372 -5036 -837 -30780
88
-5469 -3782 -2820 -2222 -3382 -4310 -2303 -1045 154 -383 -3915 -1235 -30711
Graph 2-16:
Sectorial breakdown of outward direct investment of E.C. (84-88 average)
Other not allocated
Other services
Real estate
Trade.lodging and catering
Energy
Insurance
Finance and Banking
Other industries
Food products
Metallics, machinery and transport equipment
Electric and electronic goods
Chemical industries
Regarding investment made by the Community in other countries, 4 branches stand out from the others by reason of their weight: "energy", "chemical industries", "credit and financial institutions" and "trade, hotels and restaurants". But the problems described above show that it is difficult to say whether these branches of European industry invest more in other countries or whether it is these branches in which European businesses invest most outside the Community.
As regards investment received by the Community from non-EC countries, the problem of interpretation does not arise because these are unambiguously the branches of European enterprises in which the investment is made. The structure is rather different:
Table 2-16:
Sectorial breakdown of inward direct Investment of E.C.
million ecus
year Branch
Energy
Agriculture and food products
Metallics, machinery and transport equipment Electric and electronic goods
Chemical industries
Other industries, not allocated industries Finance and Banking
Insurance
Trade, lodging and catering Real estate
Other services, not allocated services Other, not allocated
TOTAL
84
293 326 -180 1356 755 -149 2087 -138 542 1050 56 178 6177
85
1243 749 168 490 -617 -39 -179 206 1755 1058 170 633 5637
86
608 -18 1279 -444 -92 346 3226 -206 682 860 321 278 6840
87
-135 1236 821 8 1612 1553 4466 185 208 1