DOI 10.1140/epjc/s10052-016-4382-4
Regular Article - Experimental Physics
Search for bottom squark pair production in proton–proton
collisions at
√
s
=
13 TeV with the ATLAS detector
ATLAS Collaboration
CERN, 1211 Geneva 23, Switzerland
Received: 29 June 2016 / Accepted: 16 September 2016
© CERN for the benefit of the ATLAS collaboration 2016. This article is published with open access at Springerlink.com
Abstract The result of a search for pair production of the supersymmetric partner of the Standard Model bottom quark (b˜1) is reported. The search uses 3.2 fb−1of ppcollisions at√s=13 TeV collected by the ATLAS experiment at the Large Hadron Collider in 2015. Bottom squarks are searched for in events containing large missing transverse momen-tum and exactly two jets identified as originating fromb -quarks. No excess above the expected Standard Model back-ground yield is observed. Exclusion limits at 95 % confi-dence level on the mass of the bottom squark are derived in phenomenological supersymmetric R-parity-conserving models in which theb˜1is the lightest squark and is assumed to decay exclusively viab˜1→bχ˜10, whereχ˜10is the lightest neutralino. The limits significantly extend previous results; bottom squark masses up to 800 (840) GeV are excluded for theχ˜10mass below 360 (100) GeV whilst differences in mass above 100 GeV between theb˜1and theχ˜10are excluded up to ab˜1mass of 500 GeV.
1 Introduction
Supersymmetry (SUSY) [1–6] provides an extension of the Standard Model (SM) that solves the hierarchy problem [7– 10] by introducing supersymmetric partners of the known bosons and fermions. In the framework of the R -parity-conserving minimal supersymmetric extension of the SM (MSSM) [11–13], SUSY particles are produced in pairs and the lightest supersymmetric particle (LSP) is stable, provid-ing a possible candidate for dark matter [14,15]. In a large variety of models the LSP is the lightest neutralino (χ˜10). Nat-uralness considerations [16,17] suggest that the supersym-metric partners of the third-generation SM quarks are the lightest coloured supersymmetric particles. This may lead to the lightest bottom squark (b˜1) and top squark (t˜1) mass
e-mail:atlas.publications@cern.ch
eigenstates1being significantly lighter than the other squarks and the gluinos. As a consequence,b˜1andt˜1could be pair-produced with relatively large cross-sections at the Large Hadron Collider (LHC).
This paper presents a search for the pair production of bottom squarks decaying exclusively as b˜1 → bχ˜10 using 3.2 fb−1of proton–proton (pp) collisions at√s =13 TeV collected by the ATLAS experiment at the LHC in 2015. A SUSY particle mass hierarchy with this exclusive decay has been predicted by various phenomenological MSSM mod-els [18]. Searches with the√s=8 TeV LHC Run-1 dataset at ATLAS and CMS have set limits onb˜1masses in such sce-narios. Forχ˜10masses around 100 GeV, exclusion limits at 95 % confidence level (CL) up to 620 and 680 GeV have been reported by the ATLAS [19] and CMS [20] collaborations, respectively. The searches were performed in events charac-terized by the presence of large missing transverse momen-tum and two jets identified as containingb-hadrons (b-jets). In Run 2 of the LHC the production cross-section rises due to the increase of the centre-of-mass energy of the pp col-lisions. For instance, for ab˜1with a mass of 800 GeV, the production cross-section increases by almost a factor of ten going from√s =8 TeV to√s =13 TeV. In addition, the sensitivity of the analysis benefits from the improved algo-rithms adopted to identifyb-jets and use of information from the newly installed pixel layer in the Run-2 ATLAS detector. The search strategy at 13 TeV closely follows the previous ATLAS studies, with signal regions defined to provide sensi-tivity to the kinematic topologies arising from different mass splittings between the bottom squark and the neutralino.
2 ATLAS detector
The ATLAS detector [21] is a multi-purpose particle physics detector with a forward-backward symmetric cylindrical
geometry and nearly 4π coverage in solid angle.2The inner tracking detector consists of pixel and silicon microstrip detectors covering the pseudorapidity region|η|<2.5, sur-rounded by a transition radiation tracker which enhances electron identification in the region |η| < 2.0. Between Run 1 and Run 2, a new inner pixel layer, the Insertable B-Layer (IBL) [22], was inserted at a mean sensor radius of 3.3 cm. The inner detector is surrounded by a thin super-conducting solenoid providing an axial 2 T magnetic field and by a fine-granularity lead/liquid-argon (LAr) electro-magnetic calorimeter covering|η|<3.2. A steel/scintillator-tile calorimeter provides hadronic coverage in the central pseudorapidity range (|η| < 1.7). The endcap and forward regions (1.5 < |η| < 4.9) of the hadronic calorimeter are made of LAr active layers with either copper or tungsten as the absorber material. An extensive muon spectrometer with an air-core toroid magnet system surrounds the calorimeters. Three layers of high-precision tracking chambers provide coverage in the range|η|<2.7, while dedicated fast cham-bers allow triggering in the region|η| < 2.4. The ATLAS trigger system consists of a hardware-based level-1 trigger followed by a software-based high-level trigger [23].
3 Data and simulated event samples
The data used in this analysis were collected by the ATLAS detector in ppcollisions at the LHC with a centre-of-mass energy of 13 TeV and 25 ns proton bunch crossing inter-val during 2015. After applying beam-, data- and detector-quality criteria, the available dataset corresponds to an inte-grated luminosity of 3.2 fb−1with an uncertainty of±5 %. The uncertainty is derived from a calibration of the lumi-nosity scale using a pair ofx–ybeam-separation scans per-formed in August 2015 and following a methodology sim-ilar to that detailed in Ref. [24]. In this dataset, each event includes an average of approximately 14 additional inelas-tic ppcollisions in the same bunch crossing (in-time pile-up). The events used in this search were selected using a trigger logic that accepts events with an uncorrected miss-ing transverse momentum above 70 GeV, calculated usmiss-ing a sum over calorimeter cells. Additional events selected with lepton- and photon-based triggers are employed for control
2ATLAS uses a right-handed coordinate system with its origin at the nominal interaction point in the centre of the detector. The positivex -axis is defined by the direction from the interaction point to the centre of the LHC ring, with the positivey-axis pointing upwards, while the beam direction defines thez-axis. Cylindrical coordinates(r, φ)are used in the transverse plane,φbeing the azimuthal angle around the
z-axis. The pseudorapidityηis defined in terms of the polar angleθby η= −ln tan(θ/2). Rapidity is defined asy= 0.5 ln[(E+pz)/(E−pz)]
whereEdenotes the energy andpzis the component of the momentum
along the beam direction.
regions defined to estimate SM background contributions. All the selections employed in this paper use a highly efficient trigger selection. The triggers used are in a plateau region and the systematic uncertainties related to the trigger simulation are found to be negligible.
Monte Carlo (MC) simulated event samples are used to model the expected signal and to aid in the description and estimation of SM background processes. The response of the detector is simulated [25] either fully by a software pro-gram based on GEANT4 [26] or by a faster simulation based on a parameterization [27] for the calorimeter response and GEANT4 for the other detector systems. To account for addi-tional pp interactions from the same and close-by bunch crossings, a set of minimum-bias interactions generated using
Pythia [28] 8.186 and the MSTW2008LO [29,30] parton
distribution function (PDF) set is superimposed onto the hard scattering events to reproduce the observed distribution of the average number of interactions per bunch crossing.
The signal samples are generated using
MadGraph5_aMC@NLO [31] v2.2.3 interfaced to Pythia8.186 with the A14 [32] set of parameters (tune) for
the modelling of the parton showering (PS), hadronization and underlying event. The matrix element (ME) calculation is performed at tree level and includes the emission of up to two additional partons. The PDF set used for the generation is NNPDF23LO [33]. The ME–PS matching is done using the CKKW-L [34] prescription, with a matching scale set to one quarter of the bottom squark mass. The cross-sections used to evaluate the signal yields are calculated to next-to-leading-order accuracy in the strong coupling constant, adding the resummation of soft gluon emission at next-to-leading-logarithmic accuracy (NLO + NLL) [35–37].
SM background samples are simulated using different MC generator programs depending on the process. Events con-tainingW or Z bosons with associated jets, including jets from the fragmentation of b- and c-quarks (heavy-flavour jets), are simulated using theSherpa2.1.1 [38] generator.
Matrix elements are calculated for up to two additional par-tons at next-to-leading order (NLO) and four parpar-tons at lead-ing order (LO) uslead-ing theComix[39] andOpenLoops[40]
matrix element generators and merged with the Sherpa
PS [41] using the ME + PS@NLO prescription [42]. The CT10 [43] PDF set is used in conjunction with a dedicated PS tune developed by the Sherpaauthors. The W/Z+jets
events are normalized to their next-to-NLO (NNLO) QCD theoretical cross-sections [44]. For a cross-check of the mod-elling ofZ+jets background, samples of events containing a photon produced in association with jets, including heavy-flavour jets, are simulated using theSherpa2.1.1 generator
with matrix elements calculated at LO with up to four partons for the LO calculation.
Diboson processes are also simulated using theSherpa
samples. They are calculated for up to one (Z Z) or zero (W W,W Z) additional partons at NLO and up to three addi-tional partons at LO. The NLO generator cross-sections are scaled down by 9 % to account for the usage ofαQED=1/129 rather than 1/132, the latter corresponding to the use of the parameters defined by the Particle Data Group as input to the Gμscheme [45].
Top-quark pair and single-top-quark production (W t- and s-channel) events are simulated using the Powheg- Box
v2 [46] generator as described in Ref. [47] with the CT10 PDF set in the matrix element calculations. Electroweak t-channel single-top-quark events are generated using the
Powheg- Box v1 generator. The top-quark mass is set to
172.5 GeV. For thett¯production, thehdampparameter, which controls the transverse momentum (pT) of the first additional emission beyond the Born configuration and thus regulates the pT of the recoil emission against thett¯system, is set to the mass of the top quark. For all processes, the parton shower, fragmentation, and the underlying event are sim-ulated using Pythia 6.428 [48] with the CTEQ6L1 PDF
set and the corresponding Perugia 2012 tune (P2012) [49]. Thett¯samples are normalized to their NNLO cross-section including the resummation of soft gluon emission at next-to-NLL accuracy usingTop++2.0[50]. Samples of single-top-quark production are normalized to the NLO cross-sections reported in Refs. [51–53] for the s-, t- and W t-channels, respectively. The associated production of a top-quark pair with a vector boson,tt¯+W/Z, is generated at LO with Mad-Graph5_aMC@NLO v2.2.3 interfaced to Pythia 8.186,
with up to two (tt¯+W), one (tt¯+Z) or no (tt¯+W W) extra partons included in the matrix elements. The samples are normalized to their NLO cross-sections [31].
The EvtGen 1.2.0 program [54] is used for modelling the properties of bottom- and charm-hadron decays in all samples generated with MadGraph5_aMC@NLO and Powheg-Box.
Several samples produced without detector simulation are employed to derive systematic uncertainties associated with the specific configuration of the MC generators used for the nominal SM background samples. They include variations of the renormalization and factorization scales, the CKKW-L matching scale, as well as different PDF sets and fragmen-tation/hadronization models. Details of the MC modelling uncertainties are discussed in Sect.7.
4 Event reconstruction
The search for bottom squark pair production is based on a selection of events with jets and large missing transverse momentum in the final state. Events containing electrons or muons are explicitly vetoed in the signal and validation regions, and are used to define control regions. An overlap
removal procedure is applied to prevent double-counting of reconstructed objects. The details of the selections and over-lap removal are given below.
Interaction vertices from the pp collisions are recon-structed from tracks in the inner detector. Events must have at least one primary reconstructed vertex, required to be con-sistent with the beamspot envelope and to consist of at least two tracks with pT >0.4 GeV. When more than one such vertex is found the one with the largest sum of the square of transverse momenta of associated tracks [55] is chosen.
Jet candidates are reconstructed from three-dimensional energy clusters [56] in the calorimeter using the anti-kt jet
algorithm [57] with a radius parameter of 0.4. Each topo-logical cluster’s energy is calibrated to the electromagnetic scale prior to jet reconstruction. The reconstructed jets are then calibrated to the particle level by applying a jet energy scale (JES) derived from simulation andin situcorrections based on 8 TeV data [58,59]. Quality criteria are imposed to identify jets arising from non-collision sources or detector noise and any event containing such a jet is removed [60]. Further track-based selections are applied to reject jets with pT < 60 GeV and |η| < 2.4 that originate from pile-up interactions [61] and the expected event average energy con-tribution from pile-up clusters is subtracted using a factor dependent on the jet area [58]. Jets are classified as “baseline” and “signal”. Baseline jets are required to havepT>20 GeV and|η| <2.8. Signal jets, selected after resolving overlaps with electrons and muons, are required to pass the stricter requirement of pT>35 GeV.
Jets are identified as b-jets if tagged by a multivariate algorithm which uses information about the impact param-eters of inner detector tracks matched to the jet, the pres-ence of displaced secondary vertices, and the reconstructed flight paths of b- andc-hadrons inside the jet [62]. Theb -tagging working point with a 77 % efficiency, as determined in a simulated sample oftt¯events, was chosen as part of the optimization process discussed in Sect.5. The correspond-ing rejection factors against jets originatcorrespond-ing from c-quarks and from light quarks and gluons at this working point are 4.5 and 130, respectively [63]. To compensate for differences between data and MC simulation in theb-tagging efficiencies and mis-tag rates, correction factors derived from data-driven methods are applied to the simulated samples [64]. Candi-dateb-tagged jets are required to have pT > 50 GeV and |η|<2.5.
parameter with respect to the primary vertex larger than 0.2 mm (1 mm) are rejected to suppress cosmic rays. Muon candidates are also required to satisfy “medium” quality cri-teria [68] and have|η|<2.5. All electron and muon candi-dates must havepT>10 GeV. Lepton candidates remaining after resolving the overlap with baseline jets (see next para-graph) are called “baseline” leptons. In the control regions where lepton identification is required, “signal” leptons are chosen from the baseline set with pT >26 GeV to ensure full efficiency of the trigger and are required to be isolated from other activity using a selection designed to accept 99 % of leptons from Z boson decays. Signal electrons are fur-ther required to satisfy “tight” quality criteria [65]. Electrons (muons) are matched to the primary vertex by requiring the transverse impact parameter (d0) to satisfy|d0/σ(d0)| <5 (3), and the longitudinal impact parameter (z0) to satisfy |z0sinθ| <0.5 mm for both the electrons and muons. The MC events are corrected to account for differences in the lepton trigger, reconstruction and identification efficiencies between data and MC simulation.
The sequence to resolve overlapping objects begins by removing electron candidates sharing an inner detector track with a muon candidate. Next, jet candidates withinR =
(y)2+(φ)2 = 0.2 of an electron candidate are dis-carded, unless the jet isb-tagged, in which case the electron is discarded since it is likely to originate from a semileptonicb -hadron decay. Finally, any lepton candidate remaining within R=0.4 of any surviving jet candidate is discarded, except for the case where the lepton is a muon and the number of tracks associated with the jet is less than three.
The missing transverse momentumpmissT , with magnitude ETmiss, is defined as the negative vector sum of thepTof all selected and calibrated physics objects in the event, with an extra term added to account for soft energy in the event which is not associated with any of the selected objects. This soft term is calculated from inner detector tracks withpTabove 400 MeV matched to the primary vertex to make it more robust against pile-up contamination [69,70].
Reconstructed photons, although not used in the main signal event selection, are selected in the regions employed in one of the alternative methods used to check the Z+jets background, as explained in Sect.6. Photon candidates are required to have pT>130 GeV and|η| < 2.37, to satisfy the tight photon shower shape and electron rejection criteria [71], and to be isolated.
5 Event selection
The selection of events is similar to that used in Ref. [72] and is based on the definition of one set of three overlapping sig-nal regions (SRA) and a fourth distinct sigsig-nal region (SRB). These were re-optimized for 3.2 fb−1of 13 TeV pp
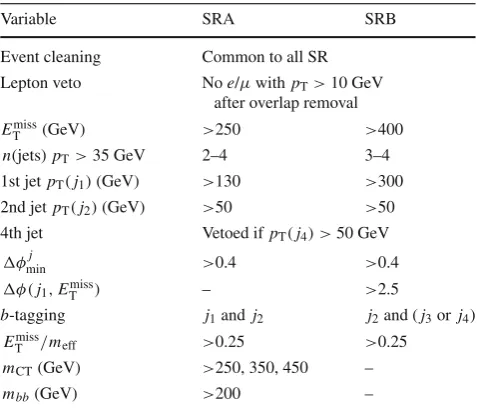
colli-Table 1 Summary of the event selection in each signal region. The term lepton is used in the table to refer to baseline electrons and muons. Jets (j1,j2, j3and j4) are labelled with an index corresponding to their decreasing order inpT
Variable SRA SRB
Event cleaning Common to all SR Lepton veto Noe/μwithpT>10 GeV
after overlap removal
Emiss
T (GeV) >250 >400
n(jets)pT>35 GeV 2–4 3–4 1st jetpT(j1)(GeV) >130 >300 2nd jetpT(j2)(GeV) >50 >50 4th jet Vetoed ifpT(j4) >50 GeV
φj
min >0.4 >0.4
φ(j1,EmissT ) – >2.5
b-tagging j1and j2 j2and (j3orj4)
Emiss
T /meff >0.25 >0.25
mCT(GeV) >250, 350, 450 –
mbb(GeV) >200 –
sions, and the selection criteria are summarized in Table1. Only events with ETmiss> 250 GeV are retained to ensure full efficiency of the trigger. Jets are ordered according to decreasing pT. Contamination from backgrounds with high jet multiplicity, particularlytt¯production, is suppressed by vetoing events with a fourth jet with pT >50 GeV. To dis-criminate against multijet background, events where ETmiss is aligned with a jet in the transverse plane are rejected by requiring φminj > 0.4, where φminj is the minimum azimuthal distance betweenETmissand the leading four jets, and by requiringETmiss/meff >0.25, wheremeffis defined as the scalar sum of theETmissand thepTof the two leading jets. For signal events, no isolated charged leptons are expected in the final state, and events where a baseline electron or muon is reconstructed are discarded.
The first set of signal regions, SRA, selects events with large EmissT where the two leading jets areb-tagged to tar-get models with a large mass difference between the bottom squark and the neutralino. The main discriminating variable is the contransverse mass (mCT) [73], which is a kinematic variable that can be used to measure the masses of pair-produced semi-invisibly decaying heavy particles. For two identical decays of heavy particles into two visible particles (or particle aggregates)v1andv2, and two invisible particles, mCTis defined as
m2CT(v1, v2)=[ET(v1)+ET(v2)]2−pT(v1)−pT(v2)2.
[image:4.595.306.545.100.305.2]The contransverse mass is invariant under equal and oppo-site boosts of the parent particles in the transverse plane. For systems of parent particles produced with small transverse boosts,mCTis bounded from above by an analytical combi-nation of particle masses. This bound is saturated when the two visible objects are collinear. Fortt¯events, this kinematic bound is at 135 GeV, while for production of bottom squark pairs the bound is given bymmaxCT =(m2˜
b1 −m
2 ˜ χ0
1)/
mb˜
1. The
selection onmCTis optimized based on the bottom squark and neutralino masses considered and SRA is further divided into three overlapping regions, SRA250, SRA350 and SRA450, where the naming conventions reflects the minimum value allowed formCT. Finally, a selection on the invariant mass of the twob-jets (mbb>200 GeV) is applied to further enhance
the signal yield over the SM background contributions. For a signal model corresponding tom˜
b1 = 800 GeV andmχ˜10
= 1 GeV, 10, 8 and 5 % of the simulated signal events are retained by the SRA250, SRA350 and SRA450 selections, respectively.
The second type of signal region, SRB, selects events where a bottom squark pair is produced in association with a jet from initial-state radiation (ISR). The SRB targets mod-els with a small mass difference between theb˜1 and the
˜ χ0
1, such that a boosted bottom squark pair is needed to sat-isfy the trigger requirements. Hence events are selected with largeETmiss, one high-pTnon-b-tagged leading jet and at least two additionalb-jets. The leading jet is also required to be pointing in the direction opposite to theEmissT by requiring φ(j1,ETmiss) >2.5, whereφ(j1,EmissT )is defined as the azimuthal angle between the leading jet and theEmissT . For a signal model corresponding tom˜
b1 = 400 GeV andmχ˜10 =
300 GeV, about 0.3 % of the simulated events are retained by the SRB selection.
6 Background estimation
The dominant SM background processes in the signal regions are the production of W or Z bosons in association with heavy-flavour jets (referred to as W+hf and Z+hf) and the production of top quarks. In particular, events with Z+hf production followed by the Z → νν¯ decay have the same signature as the signal and are the largest (irre-ducible) background in SRA. The background in SRB is dominated by top-quark production in events with a charged lepton in the final state that is not reconstructed, either because the lepton is a hadronically decayingτ, or because the electron or muon is not identified or out of detector acceptance.
Monte Carlo simulation is used to estimate the background yield in the signal regions, after normalizing the Monte Carlo prediction for the major backgrounds to data in control
regions (CR) constructed to enhance a particular background and to be kinematically similar but orthogonal to the signal regions. The control regions are defined by explicitly requir-ing the presence of one or two leptons (electrons or muons) in the final state and applying further selection criteria sim-ilar to those of the corresponding signal regions. To select events with good-quality electrons and muons the “signal lepton” selection is applied to them. Events with additional baseline lepton candidates are vetoed. For SRA, the normal-izations of the top-quark pair, single-top-quark, Z+jets and W+jets backgrounds are estimated simultaneously by mak-ing use of four control regions, while for SRB two control regions are used to determine the normalization of the top-quark pair andZ+jets backgrounds since other contributions are sub-dominant. A likelihood function is built as the prod-uct of Poisson probability functions, using as constraints the observed and expected (from MC simulation) event yields in the control regions but not the yields in the corresponding SR [74]. The normalization factors for each of the simulated backgrounds are adjusted simultaneously via a profile like-lihood fit [75] (referred to as the “background-only fit”). All systematic uncertainties (discussed in Sect.7) are treated as nuisance parameters in the fit. The background normalization parameters are applied to the signal regions also taking into account correlations in the yield predictions between differ-ent
regions.
Two same-flavour opposite-sign (SFOS) two-lepton (elec-tron or muon) control regions with dilepton invariant mass near the Z boson mass (76<m <106 GeV) and twob -tagged jets provide data samples dominated byZboson pro-duction. For these control regions, labelled in the following as CRzA and CRzB for SRA and SRB respectively, thepTof the leptons is added vectorially to thepmissT to mimic the expected missing transverse momentum spectrum ofZ →νν¯events, and is indicated in the following as EmissT ,cor (lepton cor-rected). In addition, the uncorrected ETmiss of the event is required to be less than 100 (70) GeV in CRzA (CRzB) in order to further enhance the Z boson contribution. In the case of CRzA, ambb>200 GeV selection is also imposed.
Two control regions, CRttA and CRttB defined for SRA and SRB respectively, dominated bytt¯production are identified by selecting events with exactly one lepton (e, μ) and a set of requirements similar to those for SRA and SRB, with the additional requirement mbb < 200 GeV in CRttA to
Table 2 Definition of the control regions associated with SRA and SRB. Control regions are defined to study the contribution fromZ+hf,
tt¯, single top-quark andW+hf production in SRA and the contribution fromZ+hf andtt¯in SRB. The term lepton is used in the table to refer
to signal electrons and muons. Jets (j1,j2, j3andj4) are labelled with an index corresponding to their decreasing order inpT. SFOS indicates the same-flavour opposite-sign two-lepton selection
Variable CRzA CRttA CRstA CRwA CRzB CRttB
Number of leptons 2 SFOS 1 1 1 2 SFOS 1
1st leptonpT(GeV) >90 >26 >26 >26 >26 >26
2nd leptonpT(GeV) >20 – – – >20 –
m(GeV) [76, 106] – – – [76, 106] –
mT(GeV) – – – >30 – –
n(jets)pT>35 GeV 2–4 2–4 2–4 2–4 3–4 3–4
1st jetpT(j1)(GeV) >50 >130 >50 >130 >50 >130
2nd jetpT(j2)(GeV) >50 >50 >50 >50 >50 >50
4th jet Vetoed ifpT(j4) >50 GeV Vetoed ifpT(j4) >50 GeV
b-tagged jets j1and j2 j1and j2 j1and j2 j1 j2and (j3orj4)
EmissT (GeV) <100 >100 >100 >100 <70 >200
EmissT ,cor(GeV) >100 – – – >100 –
mbb (GeV) >200 <200 >200 (mbj) >200 – –
mCT(GeV) – >150 >150 >150 – –
mmin
b (GeV) – – >170 – – –
φ(j1, Emiss
T ) – – – – >2.0 >2.5
is required, the selection onmbbis replaced by a selection on
the invariant mass of the two leading jets (mbj) and a further
selection is applied to the event transverse massmT, defined
asmT =
2plepT EmissT −2plepT ·pmissT . The definitions of the control regions are summarized in Table2.
The contributions from diboson andtt¯+W/Zprocesses are minor and they are collectively called “Others” in the following. They are estimated from MC simulation for both the signal and the control regions and included in the fit pro-cedure, and are allowed to vary within their uncertainty. The background from multijet production is estimated from data using a procedure described in detail in Ref. [76] and mod-ified to account for the flavour of the jets. The procedure consists of smearing the jet response in events with well-measured ETmiss (seed events). The jet response function is obtained from MC dijet events and cross-checked in events from data where theEmissT can be unambiguously attributed to the mis-measurement of one of the jets. The contribution from multijet production in all regions is found to be negli-gible.
The results of the background-only fit are shown in Table3, where the contribution from individual backgrounds is shown separately as a purely MC-based prediction and with the rescaling from the fit procedure. Thembbdistribution in
CRzA and the pTof the leading jet in CRttB are shown in Fig.1after the backgrounds were rescaled as a result of the background-only fit, showing good agreement in the shape of the distributions in the two control regions used to estimate the dominant backgrounds in SRA and SRB.
The full background estimation procedure is validated by comparing the background predictions and the shapes of the distributions of the key analysis variables from the fit results to those observed in dedicated validation regions. They are defined to be mutually exclusive and kinematically simi-lar to the signal regions, with low potential contamination from signal. For SRA, two validation regions are defined by using the same definition as SRA250, and inverting the selections onmbbandmCT. The SM predictions are found to
overestimate the data by about one standard deviation. For SRB, a validation region is defined by selecting events with 250< ETmiss <300 GeV and good agreement is observed between data and predictions.
As a further validation, two alternative methods are used to estimate the Z+hf contribution. The first method exploits the similarity of the Z+jets andγ+jets processes [76]. For pT of the photon significantly larger than the mass of the Z boson, the kinematics ofγ+jets events strongly resem-ble those of Z+jets events. The event yields are measured in control regions identical to the SRA and SRB, with the ETmiss-based selections replaced by selections on the pT of the photon vectorially added to thepmissT . The yields are then propagated to the actual SRA and SRB using a reweighting factor derived using the MC simulation. This factor takes into account the different kinematics of the two processes and residual effects arising from the acceptance and recon-struction efficiency for photons.
Table 3 Fit results in the control regions associated with the SRA and SRB selection for an integrated luminosity of 3.2 fb−1. The results are obtained from the control regions using the background-only fit. The uncertainties include statistical, detector-related and theoretical system-atic components. The individual uncertainties can be correlated and do
not necessarily add in quadrature to the total systematic uncertainty. The pure MC estimate is used for backgrounds for which a dedicated CR is not defined, e.g. for smaller backgrounds (indicated as “Other”) and for single top-quark andW+jets production in CRzB and CRttB. A dash indicates a negligible background
Control region CRzA CRwA CRttA CRstA CRzB CRttB
Observed 78 543 260 56 59 188
Total background (fit) 78±9 543±23 260±16 56±7 59±8 188±14
tt¯ 9.0±1.6 153±26 181±23 11.1±2.1 14.6±2.0 156±15
Single top 0.8±0.4 50±23 27±13 23±10 0.42±0.07 16.6±2.0
W+jets – 327±43 45±14 20±6 – 13±5
Z+jets 68±9 3.8±0.6 1.4±0.2 0.9±0.2 42±8 0.3±0.1 “Other” 0.9±0.1 8.1±1.1 5.8±0.7 0.6±0.1 1.6±0.4 2.3±0.2
Total background (MC exp.) 61 503 267 57 46 191
tt¯ 9.4 161 190 12 15 159
Single top 1.1 60 33 27 0.4 16
W+jets – 270 37 17 – 12.9
Z+jets 50 2.8 1.0 0.7 29 0.2
“Other” 0.9 8.1 5.8 0.6 1.6 2.3
Events / 40 GeV
5 10 15 20 25 30 35 40 45
CRzA
ATLAS
-1
= 13 TeV, 3.2 fb s
Data SM total
t t Single top Others W + jets Z + jets
[GeV] bb m
0 100 200 300 400 500 600
Data / SM
0 1 2
Events / 30 GeV
10 20 30 40 50
CRttB
ATLAS
-1
= 13 TeV, 3.2 fb s
Data SM total
t t Single top Others W + jets Z + jets
leading jet [GeV] T
p
100 200 300 400 500 600
Data / SM
0 1 2
Fig. 1 Left mbbdistribution in CRzA before the final selectionmbb>
200 GeV is applied (indicated by thearrow). Right pT of the lead-ing jet in CRttB. In both distributions the MC normalization is rescaled using the results from the background-only fit, showing good agreement
between data and the predicted SM shapes. Theshaded bandincludes statistical and detector-related systematic uncertainties as detailed in Sect.7and the last bin includes overflows
is used to verify that the shape of themCT distribution for events with nob-tagged jets is compatible with the shape of themCTdistribution for events where twob-tagged jets are present. A new highly populated Z+jets CR is defined selecting Z → events with nob-tagged jets. The mCT distribution in this CR is constructed using the two leading jets and is used to estimate the shape of themCTdistribution in the SRA, whilst the normalization in SRA is rescaled based
on the ratio in data of Z → events with no b-tagged jets to events with twob-tagged jets. Additional MC-based corrections are applied to take into account the two-lepton selection in this CR.
[image:7.595.304.542.242.523.2]Table 4 EstimatedZ+jets yields in the signal regions as obtained using the default and the two alternative methods. The errors include all the uncertainty sources discussed in Sect.7. The “MC-based post-fit”
uncer-tainty does not include the additional unceruncer-tainty to account for the difference between the three methods
Method\region SRA250 SRA350 SRA450 SRB
Nominal MC-based post-fit 22±4 5.0±0.9 1.3±0.3 4.1±0.9
Z+jets fromγ+jets events 18±5 3.7±1.5 1.8±1.0 2.2±1.0
Z+jets from nonb-taggedZevents 18±6 4.3±1.6 1.3±0.5 Not applicable
Table 5 Summary of the dominant experimental and theoretical uncer-tainties for each signal region. Unceruncer-tainties are quoted as relative to the total uncertainty, with a range indicated for the three SRAs. For the-oretical modelling, uncertainties per dominant SM background process are quoted. The individual uncertainties can be correlated, and do not necessarily add in quadrature to the total background uncertainty
Source\region SRA (%) SRB (%)
Experimental uncertainty
JES 15–30 25
JER 20–35 <10
b-tagging 25–45 15
Theoretical modelling uncertainty
Z+jets 25–35 12
W+jets 20–22 27
Top production 15–20 70
and alternative method estimates are taken into account (see Sect.7). The difference between the alternative methods and the background-only fit is taken into account as an additional systematic uncertainty in the finalZ+hf yields.
7 Systematic uncertainties
Several sources of experimental and theoretical systematic uncertainty are considered in this analysis. Their impact is reduced through the normalization of the dominant back-grounds in the control regions with kinematic selections resembling those of the corresponding signal region (see Sect.6). Uncertainties due to the limited number of events in the CRs are also taken into account in the fit. The individual contributions are outlined in Table5.
The dominant detector-related systematic effects are due to the uncertainties in the jet energy scale (JES) [58] and resolution (JER) [59], and in the b-tagging efficiency and mis-tagging rates. The JES and JER uncertainties are esti-mated from 13 TeV data, while the uncertainties related to b-tagging are estimated from 8 TeV data and extrapolated to 13 TeV and to the Run-2 detector conditions. The uncer-tainties associated with lepton and photon reconstruction and energy measurements are also considered but have a small
impact on the final results. Lepton, photon and jet-related uncertainties are propagated to the calculation of the ETmiss, and additional uncertainties are included in the energy scale and resolution of the soft term. The overall experimental uncertainty in the SM background estimate is found to be around 20 % for the SRAs and 15 % for the SRB.
Uncertainties in the modelling of the SM background processes from MC simulation and their theoretical cross-section uncertainties are also taken into account. The dom-inant uncertainty arises from Z+jets MC modelling for SRA and tt¯ modelling for SRB. The Z+jets (as well as W+jets) modelling uncertainties are evaluated using alter-native samples generated with different renormalization and factorization scales, merging (CKKW-L) and resummation scales. An additional one-sided uncertainty in theZ+jets esti-mate is taken as the largest deviation between the nominal background-only fit result and each of the alternative data-driven estimates described in Sect.6. This results in an addi-tional 25, 25 and 40 % one-sided uncertainty in SRA250, SRA350 and SRA450, respectively. Finally, a 40 % uncer-tainty [77] is assigned to the heavy-flavour jet content in W+jets, estimated from MC simulation in SRB. For SRA, the uncertainty accounts for the different requirements on b-jets between CRwA and the signal region.
Uncertainties in the modelling of the top-quark pair and single-top-quark (W t) backgrounds are sub-dominant in SRA and dominant in SRB. They are computed as the dif-ference between the predictions from nominal samples and those of additional samples differing in generator or parame-ter settings. Hadronization and PS uncertainties are estimated using samples generated withPowheg- Boxv2 and
show-ered by Herwig++ v2.7.1 [78] with the UEEE5
underly-ing event tune. Uncertainties related to initial- and final-state radiation modelling, tune and (fortt¯only) choice ofhdamp parameter inPowheg- Boxv2 are evaluated using
alterna-tive settings of the generators. Finally, an alternaalterna-tive gen-eratorMadGraph5_aMC@NLOwith showering by Her-wig++v2.7.1 is used to estimate the generator uncertainties.
Uncertainties in smaller backgrounds such as diboson and t t V are also estimated by comparisons of the nominal sam-ple with alternative samsam-ples differing in generator or param-eter settings (Powhegv2 with showering byPythia8.210
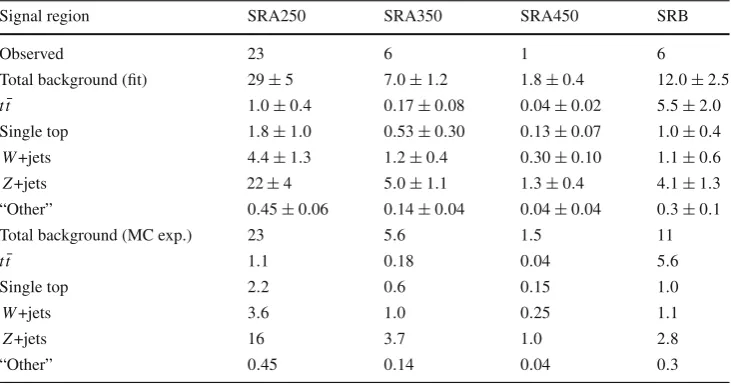
[image:8.595.50.289.244.370.2]Table 6 Fit results in all signal regions for an integrated luminosity of 3.2 fb−1. The results are obtained from the control regions. The background normalization parameters obtained with the
background-only fit are applied to the SRs. The individual uncertainties, including detector-related and theoretical systematic components, are symmetrized and can be correlated and do not
necessarily add in quadrature to the total systematic uncertainty
Signal region SRA250 SRA350 SRA450 SRB
Observed 23 6 1 6
Total background (fit) 29±5 7.0±1.2 1.8±0.4 12.0±2.5
tt¯ 1.0±0.4 0.17±0.08 0.04±0.02 5.5±2.0
Single top 1.8±1.0 0.53±0.30 0.13±0.07 1.0±0.4
W+jets 4.4±1.3 1.2±0.4 0.30±0.10 1.1±0.6
Z+jets 22±4 5.0±1.1 1.3±0.4 4.1±1.3 “Other” 0.45±0.06 0.14±0.04 0.04±0.04 0.3±0.1
Total background (MC exp.) 23 5.6 1.5 11
tt¯ 1.1 0.18 0.04 5.6
Single top 2.2 0.6 0.15 1.0
W+jets 3.6 1.0 0.25 1.1
Z+jets 16 3.7 1.0 2.8
“Other” 0.45 0.14 0.04 0.3
tune variations fort t V) and are found to be negligible. The cross-sections used to normalize the MC yields to the highest order available are varied according to the scale uncertainty of the theoretical calculation, i.e. 5 % forW, Z boson and top-quark pair production, 6 % for diboson, 13 and 12 % for t t Wandt t Z, respectively.
For the SUSY signal processes, both the experimental and theoretical uncertainties in the expected signal yield are con-sidered. Experimental uncertainties, which are found to be between 20 and 25 % across theb˜1–χ˜10mass plane for all SRs, are largely dominated by the uncertainty in theb-tagging efficiency in SRA, while JER andb-tagging uncertainties are dominant in SRB with equal contributions. Theoretical uncertainties in the NLO + NLL cross-section are calculated for each SUSY signal scenario and are dominated by the uncertainties in the renormalization and factorization scales, followed by the uncertainty in the PDF. They vary between 15 and 20 % for bottom squark masses in the range between 400 and 900 GeV. Additional uncertainties in the modelling of initial-state radiation in SUSY signal MC samples are taken into account and contribute up to 5 %.
8 Results and interpretation
Table 6 reports the observed number of events and the SM predictions after the background-only fit for each sig-nal region. The largest background contribution in SRA arises fromZ → νν¯ produced in association withb-quarks whilst top-quark pair production dominates SM predictions for SRB. The background-only fit results are compared to the pre-fit predictions based on MC simulation. Figures2 and3show the comparison between the observed data and the SM predictions for some relevant kinematic distribu-tions in SRA250 and SRB, respectively, prior to the
selec-tion on the variable shown. For illustrative purposes, the distributions expected for a scenario with bottom squark and neutralino masses of 700 GeV (400 GeV) and 1 GeV (300 GeV), respectively, are shown for SRA250 (SRB). No excess above the expected Standard Model background yield is observed. The results are translated into upper limits on contributions from new physics beyond the SM (BSM) for each signal region. The CLsmethod [79,80] is used to derive
the confidence level of the exclusion; signal models with a CLs value below 0.05 are said to be excluded at 95 % CL.
The profile-likelihood-ratio test statistic is used to exclude the signal-plus-background hypothesis for specific signal mod-els. When normalized by the integrated luminosity of the data sample, results can be interpreted as corresponding upper limits on the visible cross-section,σvis, defined as the prod-uct of the BSM prodprod-uction cross-section, the acceptance and the selection efficiency of a BSM signal. Table7summarizes the observed (Sobs95) and expected (Sexp95) 95 % CL upper limits on the number of BSM events and onσvis.
Exclusion limits are obtained assuming a specific SUSY particle mass hierarchy such that the lightest bottom squark decays exclusively viab˜1 → bχ˜10. In this case, the fit pro-cedure takes into account not only correlations in the yield predictions between control and signal regions due to com-mon background normalization parameters and systematic uncertainties but also contamination in the control regions from SUSY signal events (found to be generally negligible). The experimental systematic uncertainties in the signal are taken into account for this calculation and are assumed to be fully correlated with those in the SM background. Figure4 shows the observed (solid line) and expected (dashed line) exclusion contours at 95 % CL in theb˜1–χ˜10mass plane.
Events / 50 GeV 5 10 15 20 25 30 35 40 SRA250 ATLAS -1
= 13 TeV, 3.2 fb s Data SM total t t Single top Others W + jets Z + jets
(1) 0 1 χ∼ (700), 1 b ~ [GeV] CT m
0 100 200 300 400 500 600
Data / SM
0 1 2
Events / 50 GeV
5 10 15 20 25 30 SRA250 ATLAS -1
= 13 TeV, 3.2 fb s Data SM total t t Single top Others W + jets Z + jets
(1) 0 1 χ∼ (700), 1 b ~ [GeV] bb m
0 100 200 300 400 500 600
Data / SM
0 1 2
Fig. 2 Left mCTdistribution in SRA250 with all the selection criteria applied except themCTthreshold.Right mbb distribution in SRA250
with all selection criteria applied except thembb requirement. The
arrowsindicate the final applied selection. Theshaded bandincludes
statistical and detector-related systematic uncertainties. The SM
back-grounds are normalized to the values determined in the fit. For illustra-tion the distribuillustra-tions expected for one signal model withbottom squark
and neutralino masses of 700 and 1 GeV, respectively, are overlaid. The last bin includes overflows
Events / 50 GeV
2 4 6 8 10 12 14 16 18 20 22 24 SRB ATLAS -1
= 13 TeV, 3.2 fb s Data SM total t t Single top Others W + jets Z + jets
(300) 0 1 χ∼ (400), 1 b ~ [GeV] T miss E
250 300 350 400 450 500 550 600
Data / SM
0 1 2
Events / 50 GeV
1 2 3 4 5 6 7 SRB ATLAS -1
= 13 TeV, 3.2 fb s Data SM total t t Single top Others W + jets Z + jets
(300) 0 1 χ∼ (400), 1 b ~
leading jet [GeV] T
p
100 200 300 400 500 600 700 800
Data / SM
0 1 2
Fig. 3 Left Emiss
T distribution in SRB with all the selection criteria applied except theETmissthreshold.Rightleading jetpTdistribution in SRB with all the selection criteria applied except the selection on the leading jetpTitself. Thearrowsindicate the final selection applied in
SRB. Theshaded bandincludes statistical and detector-related system-atic uncertainties. The SM backgrounds are normalized to the values determined in the fit. For illustration the distributions expected for one signal model withbottom squarkand neutralino masses of 400 and 300 GeV, respectively, are overlaid. The last bin includes overflows
theχ˜10 is achieved with the most stringentmCT threshold (SRA450). Sensitivity to scenarios with smaller mass differ-ences is achieved predominantly with searches based on the presence of a high-pTISR jet, as in the dedicated SRB selec-tion and the search described in Ref. [81]. Bottom squark masses up to 800 (840) GeV are excluded forχ˜10 masses below 360 (100) GeV. Differences in mass above 100 GeV
[image:10.595.57.541.49.262.2] [image:10.595.55.286.335.542.2]Table 7 Left to right: 95 % CL upper limits on the visible cross-section (Aσ95
obs) and on the number of signal events (Sobs95). The third column (S95exp) shows the 95 % CL upper limit on the number of signal events, given the expected number (and±1σvariations of the expectation) of background events
Signal channel Aσ95obs(fb) S95obs Sexp95
SRA250 3.42 11.0 13.8+−63..02 SRA350 1.93 6.2 6.6+−31..11 SRA450 1.23 3.9 4.1+−10..96 SRB 1.89 6.1 8.7+−32..15
[GeV]
1 b ~
m 100 200 300 400 500 600 700 800 900 1000 1100
[GeV]
0χ∼1
m 0 100 200 300 400 500 600 700 800
= 8 TeV s , -1 + 2 b-jets, 20.1 fb miss
T ATLAS E
= 13 TeV s , -1 ATLAS monojet, 3.2 fb
= 8 TeV s , -1 ATLAS monojet, 20.3 fb
) theory SUSY σ 1 ±
Observed limit (
)
exp σ
1
±
Expected limit ( 0 1 χ∼ b → 1 b ~ Bottom squark pair production,
-1
=13 TeV, 3.2 fb s
ATLAS
All limits at 95% CL Best SR forbidden 0 1 χ ∼ b → 1 b ~
Fig. 4 Observed and expected exclusion limits at 95 % CL, as well as±1σvariation of the expected limit, in theb˜1–χ˜10mass plane. The SR with the best expected sensitivity is adopted for each point of the parameter space. Theyellow bandaround the expected limit (dashed line) shows the impact of the experimental and SM background theo-retical uncertainties. Thedotted linesshow the impact on the observed limit of the variation of the nominal signal cross-section by ±1σ of its theoretical uncertainties. The exclusion limits from the Run-1 ATLAS searches [72,81] and from the 13 TeV monojet search [82] are also superimposed. The latter limit is only published for values of
mb˜
1−
mχ˜0
1 =5 and 20 GeV
Furthermore, the sensitivity of the analysis benefits from the advanced algorithms adopted to identifyb-jets and use of information from the newly installed IBL pixel layer in the Run-2 ATLAS detector, as well as from improved techniques to estimate SM background contributions and their system-atic uncertainties.
9 Conclusion
In summary, the results of a search for bottom squark pair production are reported. The analysis uses 3.2 fb−1 of pp collisions at√s =13 TeV collected by the ATLAS
experi-ment at the Large Hadron Collider in 2015. Bottom squarks are searched for in events containing large missing trans-verse momentum and up to four jets, exactly two of which are identified asb-jets. No excess above the expected Stan-dard Model background yield is found. Exclusion limits at 95 % confidence level are placed on the visible cross-section and on the mass of the bottom squark in phenomenological supersymmetricR-parity-conserving models in which theb˜1 is the lightest squark and is assumed to decay exclusively viab˜1 → bχ˜10, whereχ˜10is the lightest neutralino. Bottom squark masses up to 800 GeV are excluded forχ˜10masses below 360 GeV (840 GeV forχ˜10masses below 100 GeV) whilst differences in mass above 100 GeV betweenb˜1and
˜ χ0
1 are excluded up tob˜1masses of 500 GeV. The results significantly extend the constraints on bottom squark masses with respect to Run-1 searches.
Acknowledgments We thank CERN for the very successful operation of the LHC, as well as the support staff from our institutions with-out whom ATLAS could not be operated efficiently. We acknowledge the support of ANPCyT, Argentina; YerPhI, Armenia; ARC, Australia; BMWFW and FWF, Austria; ANAS, Azerbaijan; SSTC, Belarus; CNPq and FAPESP, Brazil; NSERC, NRC and CFI, Canada; CERN; CONI-CYT, Chile; CAS, MOST and NSFC, China; COLCIENCIAS, Colom-bia; MSMT CR, MPO CR and VSC CR, Czech Republic; DNRF and DNSRC, Denmark; IN2P3-CNRS, CEA-DSM/IRFU, France; GNSF, Georgia; BMBF, HGF, and MPG, Germany; GSRT, Greece; RGC, Hong Kong SAR, China; ISF, I-CORE and Benoziyo Center, Israel; INFN, Italy; MEXT and JSPS, Japan; CNRST, Morocco; FOM and NWO, Netherlands; RCN, Norway; MNiSW and NCN, Poland; FCT, Portu-gal; MNE/IFA, Romania; MES of Russia and NRC KI, Russian Fed-eration; JINR; MESTD, Serbia; MSSR, Slovakia; ARRS and MIZŠ, Slovenia; DST/NRF, South Africa; MINECO, Spain; SRC and Wal-lenberg Foundation, Sweden; SERI, SNSF and Cantons of Bern and Geneva, Switzerland; MOST, Taiwan; TAEK, Turkey; STFC, United Kingdom; DOE and NSF, United States of America. In addition, indi-vidual groups and members have received support from BCKDF, the Canada Council, CANARIE, CRC, Compute Canada, FQRNT, and the Ontario Innovation Trust, Canada; EPLANET, ERC, FP7, Horizon 2020 and Marie Skłodowska-Curie Actions, European Union; Investisse-ments d’Avenir Labex and Idex, ANR, Région Auvergne and Fondation Partager le Savoir, France; DFG and AvH Foundation, Germany; Her-akleitos, Thales and Aristeia programmes co-financed by EU-ESF and the Greek NSRF; BSF, GIF and Minerva, Israel; BRF, Norway; Gen-eralitat de Catalunya, GenGen-eralitat Valenciana, Spain; the Royal Society and Leverhulme Trust, United Kingdom. The crucial computing sup-port from all WLCG partners is acknowledged gratefully, in particular from CERN, the ATLAS Tier-1 facilities at TRIUMF (Canada), NDGF (Denmark, Norway, Sweden), CC-IN2P3 (France), KIT/GridKA (Ger-many), INFN-CNAF (Italy), NL-T1 (Netherlands), PIC (Spain), ASGC (Taiwan), RAL (UK) and BNL (USA), the Tier-2 facilities worldwide and large non-WLCG resource providers. Major contributors of com-puting resources are listed in Ref. [83].
Open Access This article is distributed under the terms of the Creative Commons Attribution 4.0 International License (http://creativecomm ons.org/licenses/by/4.0/), which permits unrestricted use, distribution, and reproduction in any medium, provided you give appropriate credit to the original author(s) and the source, provide a link to the Creative Commons license, and indicate if changes were made.
[image:11.595.51.288.127.409.2]References
1. Y.A. Gol’fand, E.P. Likhtman, JETP Lett.13, 323–326 (1971). [Pisma Zh. Eksp. Teor. Fiz. 13 (1971) 452]
2. D.V. Volkov, V.P. Akulov, Phys. Lett. B46, 109 (1973) 3. J. Wess, B. Zumino, Nucl. Phys. B70, 39 (1974) 4. J. Wess, B. Zumino, Nucl. Phys. B78, 1 (1974) 5. S. Ferrara, B. Zumino, Nucl. Phys. B79, 413 (1974) 6. A. Salam, J.A. Strathdee, Phys. Lett. B51, 353 (1974) 7. N. Sakai, Z. Phys. C11, 153 (1981)
8. S. Dimopoulos, S. Raby, F. Wilczek, Phys. Rev. D24, 1681 (1981) 9. L.E. Ibanez, G.G. Ross, Phys. Lett. B105, 439 (1981)
10. S. Dimopoulos, H. Georgi, Nucl. Phys. B193, 150 (1981) 11. P. Fayet, Phys. Lett. B64, 159 (1976)
12. P. Fayet, Phys. Lett. B69, 489 (1977)
13. G.R. Farrar, P. Fayet, Phys. Lett. B76, 575 (1978)
14. H. Goldberg, Phys. Rev. Lett.50, 1419 (1983). [Erratum: Phys. Rev. Lett.103(2009) 099905]
15. J.R. Ellis, J.S. Hagelin, D.V. Nanopoulos, K.A. Olive, M. Srednicki, Nucl. Phys. B238, 453 (1984)
16. R. Barbieri, G.F. Giudice, Nucl. Phys. B306, 63 (1988)
17. B. de Carlos, J.A. Casas, Phys. Lett. B 309, 320 (1993).
arXiv:hep-ph/9303291
18. ATLAS Collaboration, JHEP1510, 134 (2015).arXiv:1508.06608
[hep-ex]
19. ATLAS Collaboration, Eur. Phys. J. C 75, 510 (2015).
arXiv:1506.08616[hep-ex]
20. CMS Collaboration, JHEP 1506, 116 (2015).arXiv:1503.08037
[hep-ex]
21. ATLAS Collaboration, JINST3, S08003 (2008)
22. ATLAS Collaboration, ATLAS-TDR-19 (2010). http://cds.cern. ch/record/1291633. Addendum: ATLAS-TDR-19-ADD-1 (2012).
http://cds.cern.ch/record/1451888
23. ATLAS Collaboration, Eur. Phys. J. C 72, 1849 (2012).
arXiv:1110.1530[hep-ex]
24. ATLAS Collaboration, Eur. Phys. J. C 73, 2518 (2013).
arXiv:1302.4393[hep-ex]
25. ATLAS Collaboration, Eur. Phys. J. C 70, 823 (2010).
arXiv:1005.4568[hep-ex]
26. S. Agostinelli et al. (GEANT4), Nucl. Instrum. Methods A506, 250 (2003)
27. ATLAS Collaboration, ATL-PHYS-PUB-2010-013 (2010).http:// cds.cern.ch/record/1300517
28. T. Sjostrand, S. Mrenna, P.Z. Skands, Comput. Phys. Commun.
178, 852 (2008).arXiv:0710.3820[hep-ph]
29. A.D. Martin, W.J. Stirling, R.S. Thorne, G. Watt, Eur. Phys. J. C
63, 189 (2009).arXiv:0901.0002[hep-ph]
30. A. Martin, W. Stirling, R. Thorne, G. Watt, Phys. Lett. B652, 292 (2007).arXiv:0706.0459[hep-ph]
31. J. Alwall et al., JHEP1407, 079 (2014).arXiv:1405.0301[hep-ph] 32. ATLAS Collaboration, ATL-PHYS-PUB-2014-021 (2014).http://
cdsweb.cern.ch/record/1966419
33. R.D. Ball et al., Nucl. Phys. B867, 244 (2013).arXiv:1207.1303
[hep-ph]
34. L. Lönnblad, S. Prestel, JHEP1303, 166 (2013).arXiv:1211.7278
[hep-ph]
35. W. Beenakker, M. Kramer, T. Plehn, M. Spira, P.M. Zerwas, Nucl. Phys. B515, 3 (1998).arXiv:hep-ph/9710451
36. W. Beenakker et al., JHEP1008, 098 (2010).arXiv:1006.4771
[hep-ph]
37. W. Beenakker et al., Int. J. Mod. Phys. A 26, 2637 (2011).
arXiv:1105.1110[hep-ph]
38. T. Gleisberg et al., JHEP0902, 007 (2009).arXiv:0811.4622 [hep-ph]
39. T. Gleisberg, S. Höche, JHEP0812, 039 (2008).arXiv:0808.3674
[hep-ph]
40. F. Cascioli, P. Maierhofer, S. Pozzorini, Phys. Rev. Lett. 108, 111601 (2012).arXiv:1111.5206[hep-ph]
41. S. Schumann, F. Krauss, JHEP0803, 038 (2008).arXiv:0709.1027
[hep-ph]
42. S. Höche, F. Krauss, M. Schönherr, F. Siegert, JHEP1304, 027 (2013).arXiv:1207.5030[hep-ph]
43. H.-L. Lai et al., Phys. Rev. D82, 074024 (2010).arXiv:1007.2241
[hep-ph]
44. R. Gavin, Y. Li, F. Petriello, S. Quackenbush, Comput. Phys. Com-mun.182, 2388 (2011).arXiv:1011.3540[hep-ph]
45. K.A. Olive et al. (Particle Data Group), Chin. Phys. C38, 090001 (2015)
46. S. Alioli, P. Nason, C. Oleari, E. Re, JHEP1006, 043 (2010).
arXiv:1002.2581[hep-ph]
47. ATLAS Collaboration, ATL-PHYS-PUB-2016-004 (2016).http:// cdsweb.cern.ch/record/2120417
48. T. Sjostrand, S. Mrenna, P.Z. Skands, JHEP0605, 026 (2006).
arXiv:hep-ph/0603175
49. P.Z. Skands, Phys. Rev. D82, 074018 (2010).arXiv:1005.3457
[hep-ph]
50. M. Czakon, A. Mitov, Comput. Phys. Commun.185, 2930 (2014).
arXiv:1112.5675[hep-ph]
51. N. Kidonakis, Phys. Rev. D83, 091503 (2011).arXiv:1103.2792
[hep-ph]
52. N. Kidonakis, Phys. Rev. D81, 054028 (2010).arXiv:1001.5034
[hep-ph]
53. N. Kidonakis, Phys. Rev. D82, 054018 (2010).arXiv:1005.4451
[hep-ph]
54. D.J. Lange, Nucl. Instrum. Methods A462, 152 (2001)
55. ATLAS Collaboration, ATL-PHYS-PUB-2015-026 (2015).http:// cdsweb.cern.ch/record/2037717
56. ATLAS Collaboration,arXiv:1603.02934[hep-ex] (submitted to Eur. Phys. J. C)
57. M. Cacciari, G.P. Salam, G. Soyez, JHEP 0804, 063 (2008).
arXiv:0802.1189[hep-ph]
58. ATLAS Collaboration, ATL-PHYS-PUB-2015-015 (2015).http:// cds.cern.ch/record/2037613
59. ATLAS Collaboration, ATLAS-CONF-2015-037 (2015). http:// cdsweb.cern.ch/record/2044941
60. ATLAS Collaboration, ATLAS-CONF-2015-029 (2015). http:// cdsweb.cern.ch/record/2037702
61. ATLAS Collaboration, ATLAS-CONF-2014-018 (2014). http:// cdsweb.cern.ch/record/1700870
62. ATLAS Collaboration, ATL-PHYS-PUB-2015-039 (2015).http:// cdsweb.cern.ch/record/2047871
63. ATLAS Collaboration, ATLAS-CONF-2014-046 (2014). http:// cdsweb.cern.ch/record/1741020
64. ATLAS Collaboration, JINST 11, P04008 (2016).
arXiv:1512.01094[hep-ex]
65. ATLAS Collaboration, Eur. Phys. J. C 74, 2941 (2014).
arXiv:1404.2240[hep-ex]
66. ATLAS Collaboration, Eur. Phys. J. C 74, 3071 (2014).
arXiv:1407.5063[hep-ex]
67. ATLAS Collaboration, ATL-PHYS-PUB-2015-041 (2015).http:// cdsweb.cern.ch/record/2048202
68. ATLAS Collaboration,arXiv:1603.05598[hep-ex] (submitted to Eur. Phys. J. C)
69. ATLAS Collaboration, ATLAS-CONF-2013-082 (2013). http:// cdsweb.cern.ch/record/1570993
70. ATLAS Collaboration, Eur. Phys. J. C 73, 2304 (2013).
arXiv:1112.6426[hep-ex]
72. ATLAS Collaboration, JHEP1310, 189 (2013).arXiv:1308.2631
[hep-ex]
73. D.R. Tovey, JHEP0804, 034 (2008).arXiv:0802.2879[hep-ph] 74. M. Baak et al., Eur. Phys. J. C75, 153 (2015).arXiv:1410.1280
[hep-ex]
75. G. Cowan, K. Cranmer, E. Gross, O. Vitells, Eur. Phys. J. C71, 1554 (2011).arXiv:1007.1727[physics.data-an]. [Erratum: Eur. Phys. J. C73(2013) 2501]
76. ATLAS Collaboration, Phys. Rev. D 87, 012008 (2013).
arXiv:1208.0949[hep-ex]
77. ATLAS Collaboration, Phys. Lett. B 707, 418 (2012).
arXiv:1109.1470[hep-ex]
78. M. Bähr et al., Eur. Phys. J. C58, 639 (2008).arXiv:0803.0883
[hep-ph]
79. T. Junk, Nucl. Instrum. Methods A 434, 435 (1999).
arXiv:hep-ex/9902006
80. A.L. Read, J. Phys. G28, 2693 (2002)
81. ATLAS Collaboration, Phys. Rev. D 90, 052008 (2014).
arXiv:1407.0608[hep-ex]
82. ATLAS Collaboration,arXiv:1604.07773[hep-ex] (submitted to Phys. Rev. D)
83. ATLAS Collaboration, ATL-GEN-PUB-2016-002 (2016).http:// cds.cern.ch/record/2202407
ATLAS Collaboration
H. van der Graaf107, N. van Eldik152, P. van Gemmeren6, J. Van Nieuwkoop142, I. van Vulpen107, M. C. van Woerden32, M. Vanadia132a,132b, W. Vandelli32, R. Vanguri122, A. Vaniachine130, P. Vankov107, G. Vardanyan176, R. Vari132a, E. W. Varnes7, T. Varol42, D. Varouchas81, A. Vartapetian8, K. E. Varvell150, J. G. Vasquez175, F. Vazeille36, T. Vazquez Schroeder88, J. Veatch56, V. Veeraraghavan7, L. M. Veloce158, F. Veloso126a,126c, S. Veneziano132a, A. Ventura74a,74b, M. Venturi168, N. Venturi158, A. Venturini25, V. Vercesi121a, M. Verducci132a,132b, W. Verkerke107, J. C. Vermeulen107, A. Vest46,ar, M. C. Vetterli142,d, O. Viazlo82, I. Vichou165,*, T. Vickey139, O. E. Vickey Boeriu139, G. H. A. Viehhauser120, S. Viel16, L. Vigani120, M. Villa22a,22b, M. Villaplana Perez92a,92b, E. Vilucchi49, M. G. Vincter31, V. B. Vinogradov66, C. Vittori22a,22b, I. Vivarelli149, S. Vlachos10, M. Vlasak128, M. Vogel174, P. Vokac128, G. Volpi124a,124b, M. Volpi89, H. von der Schmitt101, E. von Toerne23, V. Vorobel129, K. Vorobev98, M. Vos166, R. Voss32, J. H. Vossebeld75, N. Vranjes14, M. Vranjes Milosavljevic14, V. Vrba127, M. Vreeswijk107, R. Vuillermet32, I. Vukotic33, Z. Vykydal128, P. Wagner23, W. Wagner174, H. Wahlberg72, S. Wahrmund46, J. Wakabayashi103, J. Walder73, R. Walker100, W. Walkowiak141, V. Wallangen146a,146b, C. Wang35c, C. Wang35d,86, F. Wang172, H. Wang16, H. Wang42, J. Wang44, J. Wang150, K. Wang88, R. Wang6, S. M. Wang151, T. Wang23, T. Wang37, W. Wang35b, X. Wang175, C. Wanotayaroj116, A. Warburton88, C. P. Ward30, D. R. Wardrope79, A. Washbrook48, P. M. Watkins19, A. T. Watson19, M. F. Watson19, G. Watts138, S. Watts85, B. M. Waugh79, S. Webb84, M. S. Weber18, S. W. Weber173, J. S. Webster6, A. R. Weidberg120, B. Weinert62, J. Weingarten56, C. Weiser50, H. Weits107, P. S. Wells32, T. Wenaus27, T. Wengler32, S. Wenig32, N. Wermes23, M. Werner50, M. D. Werner65, P. Werner32, M. Wessels59a, J. Wetter161, K. Whalen116, N. L. Whallon138, A. M. Wharton73, A. White8, M. J. White1, R. White34b, D. Whiteson162, F. J. Wickens131, W. Wiedenmann172, M. Wielers131, P. Wienemann23, C. Wiglesworth38, L. A. M. Wiik-Fuchs23, A. Wildauer101, F. Wilk85, H. G. Wilkens32, H. H. Williams122, S. Williams107, C. Willis91, S. Willocq87, J. A. Wilson19, I. Wingerter-Seez5, F. Winklmeier116, O. J. Winston149, B. T. Winter23, M. Wittgen143, J. Wittkowski100, T. M. H. Wolf107, M. W. Wolter41, H. Wolters126a,126c, S. D. Worm131, B. K. Wosiek41, J. Wotschack32, M. J. Woudstra85, K. W. Wozniak41, M. Wu57, M. Wu33, S. L. Wu172, X. Wu51, Y. Wu90, T. R. Wyatt85, B. M. Wynne48, S. Xella38, D. Xu35a, L. Xu27, B. Yabsley150, S. Yacoob145a, D. Yamaguchi157, Y. Yamaguchi118, A. Yamamoto67, S. Yamamoto155, T. Yamanaka155, K. Yamauchi103, Y. Yamazaki68, Z. Yan24, H. Yang35e, H. Yang172, Y. Yang151, Z. Yang15, W.-M. Yao16, Y. C. Yap81, Y. Yasu67, E. Yatsenko5, K. H. Yau Wong23, J. Ye42, S. Ye27, I. Yeletskikh66, A. L. Yen58, E. Yildirim84, K. Yorita170, R. Yoshida6, K. Yoshihara122, C. Young143, C. J. S. Young32, S. Youssef24, D. R. Yu16, J. Yu8, J. M. Yu90, J. Yu65, L. Yuan68, S. P. Y. Yuen23, I. Yusuff30,as, B. Zabinski41, R. Zaidan35d, A. M. Zaitsev130,ae, N. Zakharchuk44, J. Zalieckas15, A. Zaman148, S. Zambito58, L. Zanello132a,132b, D. Zanzi89, C. Zeitnitz174, M. Zeman128, A. Zemla40a, J. C. Zeng165, Q. Zeng143, K. Zengel25, O. Zenin130, T. Ženiš144a, D. Zerwas117, D. Zhang90, F. Zhang172, G. Zhang35b,an, H. Zhang35c, J. Zhang6, L. Zhang50, R. Zhang23, R. Zhang35b,at, X. Zhang35d, Z. Zhang117, X. Zhao42, Y. Zhao35d, Z. Zhao35b, A. Zhemchugov66, J. Zhong120, B. Zhou90, C. Zhou47, L. Zhou37, L. Zhou42, M. Zhou148, N. Zhou35f, C. G. Zhu35d, H. Zhu35a, J. Zhu90, Y. Zhu35b, X. Zhuang35a, K. Zhukov96, A. Zibell173, D. Zieminska62, N. I. Zimine66, C. Zimmermann84, S. Zimmermann50, Z. Zinonos56, M. Zinser84, M. Ziolkowski141, L. Živkovi´c14, G. Zobernig172, A. Zoccoli22a,22b, M. zur Nedden17, L. Zwalinski32
1Department of Physics, University of Adelaide, Adelaide, Australia
2Physics Department, SUNY Albany, Albany, NY, USA
3Department of Physics, University of Alberta, Edmonton, AB, Canada
4(a)Department of Physics, Ankara University, Ankara, Turkey;(b)Istanbul Aydin University,
Istanbul, Turkey;(c)Division of Physics, TOBB University of Economics and Technology, Ankara, Turkey 5LAPP, CNRS/IN2P3 and Université Savoie Mont Blanc, Annecy-le-Vieux, France
6High Energy Physics Division, Argonne National Laboratory, Argonne, IL, USA
7Department of Physics, University of Arizona, Tucson, AZ, USA
8Department of Physics, The University of Texas at Arlington, Arlington, TX, USA
9Physics Department, University of Athens, Athens, Greece
10Physics Department, National Technical University of Athens, Zografou, Greece
11Department of Physics, The University of Texas at Austin, Austin, TX, USA
12Institute of Physics, Azerbaijan Academy of Sciences, Baku, Azerbaijan
13Institut de Física d’Altes Energies (IFAE), The Barcelona Institute of Science and Technology, Barcelona, Spain
14Institute of Physics, University of Belgrade, Belgrade, Serbia
15Department for Physics and Technology, University of Bergen, Bergen, Norway
16Physics Division, Lawrence Berkeley National Laboratory and University of California, Berkeley, CA, USA