Article
Benchmarking the Applicability of Ontology in
Geographic Object-Based Image Analysis
Sachit Rajbhandari1,* ID, Jagannath Aryal1 ID, Jon Osborn1, Rob Musk2and Arko Lucieer1 ID
1 Discipline of Geography and Spatial Sciences, University of Tasmania, Private Bag 76, Hobart, TAS 7001, Australia; [email protected] (J.A.); [email protected] (J.O.); [email protected] (A.L.) 2 Sustainable Timber Tasmania, 99 Bathurst Street, Hobart, TAS 7000, Australia; [email protected] * Correspondence: [email protected]; Tel.: +61-415-692-370
Received: 19 September 2017; Accepted: 22 November 2017; Published: 28 November 2017
Abstract:In Geographic Object-based Image Analysis (GEOBIA), identification of image objects is normally achieved using rule-based classification techniques supported by appropriate domain knowledge. However, GEOBIA currently lacks a systematic method to formalise the domain knowledge required for image object identification. Ontology provides a representation vocabulary for characterising domain-specific classes. This study proposes an ontological framework that conceptualises domain knowledge in order to support the application of rule-based classifications. The proposed ontological framework is tested with a landslide case study. The Web Ontology Language (OWL) is used to construct an ontology in the landslide domain. The segmented image objects with extracted features are incorporated into the ontology as instances. The classification rules are written in Semantic Web Rule Language (SWRL) and executed using a semantic reasoner to assign instances to appropriate landslide classes. Machine learning techniques are used to predict new threshold values for feature attributes in the rules. Our framework is compared with published work on landslide detection where ontology was not used for the image classification. Our results demonstrate that a classification derived from the ontological framework accords with non-ontological methods. This study benchmarks the ontological method providing an alternative approach for image classification in the case study of landslides.
Keywords:GEOBIA; ontology; rule-based classification; landslides; machine learning; random forest
1. Introduction
In remote sensing image analysis, traditional per-pixel and emerging object-based approaches exist. In a per-pixel method, single pixels are assigned to different geographic classes based on their reflectance values from different spectral bands without employing additional and potentially useful
spatial, geometrical or contextual features [1]. The per-pixel approaches operates at the spatial scale of
the pixel. This poses the problem of mixed pixels, where a pixel represents more than one type of image objects. The use of a per-pixel approach is diminishing with the increase in resolution of satellite images. One of the reasons is the “salt and pepper” effect where single pixels are misclassified in
a group of pixels representing certain class [2,3].
There has been a shift from per-pixel to object-based methods [4,5]. Geographic Object-Based
Image Analysis (GEOBIA) combines contiguous homogeneous pixels to segment geographical objects
in remote sensing images. The grouping of a pixel is carried out using segmentation algorithms [6].
After segmentation, feature values of the segmented image objects are extracted. Applying these feature values, rule sets are developed to classify image objects into classification categories. In contrast to per-pixel methods, object-based methods can be applied at multiple scales and make use of spatial, contextual, and textural features alongside spectral features for image object classification.
The GEOBIA approach relies on expert knowledge to perform image segmentation and
classification [5,7]. Such expert knowledge, if systematically organised, can guide future image
analysis [8]. However, GEOBIA methods currently lack a systematic method to conceptualise and
formalise domain knowledge. With a high dependency on human experts and a lack of formal
knowledge, GEOBIA processes are highly subjective and largely irreproducible [9]. Image object
extraction and classification can be biased by human subjectivity and vary depending on the users’
capabilities and experiences [8]. With knowledge formalisation, the classification process is prescribed
and automated with less human intervention and using consensus knowledge approved and developed by domain experts.
Knowledge representation languages can be used to formalise a domain expert’s knowledge and reduce the issues of subjectivity, automation and transferability. A knowledge representation approach can employ logic-based formalism or non-logic-based representation. In a logic-based approach, the representation language is usually a variant of first-order predicate calculus and reasoning is based
on formal verification of logical consequences [10], while, in a non-logical approach, the knowledge
is represented using specialised data structures and reasoning is performed by applying specialised
procedures on the structures [10]. A semantic network represents a non-logical approach with
a specialised network structure in which a graphical network of nodes and arcs is used for knowledge representation. The graphical representation shows the semantic relations between concepts, which can
be used to create and share the knowledge of thematic experts [11]. Ontology, as a logic-based approach,
has well-defined and formal semantics to represent knowledge.
In our work, we have used ontology as a knowledge representation language that provides a representation vocabulary specialised to a certain domain or subject. The highly cited definition of
ontology from Gruber [12] states that an ontology is a “specification of a shared conceptualisation”.
Ontology is a shared understanding of a domain agreed by experts and intended to make domain
knowledge interoperable, reusable and sareable [13]. The Web Ontology Language 2 (OWL 2) [14]
is a machine-readable knowledge representation language for authoring and sharing ontologies.
The logical consistency of an ontology can be established using reasoning engines such as Pellet [15],
Fact++ [16] and KAON2 [17]. The Semantic Web Rules Language (SWRL) [18] allows the creation of
conditional rules supplementing the capability of the reasoner. SWRL are executed using the semantic reasoner, which discovers new entailments and incorporates them into an existing ontology.
In this work, we attempt to develop an ontological framework where domain knowledge is formalised to assist in rule-based classification. For this, the domain ontology is constructed in OWL language and the rules are written in SWRL. Using a semantic reasoner, the instances of segmented image objects are assigned to concepts representing domain entities to perform an image object classification.
In remote sensing, classification of image objects is highly dependent on the knowledge of domain experts. However, the use of that knowledge is limited when the knowledge is not formalised because
the knowledge becomes incomprehensible and unsharable [19]. There is a need for a knowledge
organisation and representation method to handle the inefficient and excessive dependency on expert
knowledge [20]. Concisely, GEOBIA needs to adopt knowledge formalisation techniques that can
reduce human involvement and bring transferability to image classification. The use of ontology for
formalising expert knowledge has been explored in [19]. In GEOBIA, the ontological framework helps
in data discovery, automatic image interpretation, data interoperability, workflow management and
data publication [9]. Previous studies show that the ontological framework have been developed for
land cover extraction [20–22], ocean image classification [23], and biodiversity monitoring [24].
In this paper, we aim to answer the following research questions:
• Can ontology be used to formalise domain knowledge in the manner required by GEOBIA for
image classification, and
• What methodological changes are required to apply the formalised knowledge as a spatial
This paper is a methodological contribution in the field of geo-spatial image analysis with a focus on ontological implementation. The specific contributions of the formalised ontology in this study are:
• transferability of knowledge with modularisation of highly transferable domain ontology and
data dependent feature ontology;
• extensibility of the knowledge base with a clear separation of knowledge construction and
classification tasks;
• minimisation of human intervention during image classification by developing prior rules with
the consensus of experts;
• use of inferencing capability in image classification with reasoner (Pellet); and
• data interoperability with the use of W3C (World Wide Web Consortium) standard languages
(OWL, SWRL).
The remainder of this paper is organised as follows. Section2outlines the case study on landslides,
data and study area. In Section3, the methodology for ontology-based image classification is proposed.
In Section4, the outcome of the experiment is presented and later discussed in Section5. In Section6,
conclusion of this work is presented.
2. Case Study
2.1. Case Study on Landslide Detection
Landslides are commonly occurring and can have disastrous impacts. Rapid and accurate detection of landslides can help to monitor hazards, minimise risk and support disaster management.
Earth observation data can play a significant role in the early detection and analysis of landslides [25,26].
For landslide detection, different remote sensing techniques such as aerial photo interpretation,
stereoscopic image analysis, interferometry studies, and airborne laser scanning (ALS) can be used [27].
Aerial photographs are rich in data allowing comprehensive landslides analysis but involve high cost, time and most importantly they may not be available instantly after the occurrence of a disaster. In contrast, high-resolution satellite images are an economical source of data that can provide on
time information about affected landslide areas [28]. Recently, LiDAR data and its wide range of
derivatives including digital terrain models (DTM), shaded relief, slope, aspect, and surface roughness
have been used for qualitative interpretation and quantitative statistical analysis [26]. In this context,
landslide detection through earth observation data is considered to be a promising application domain for image analysis.
Several studies have shown the applicability of knowledge based image analyses to detect
landslides [28–30]. However, there is a lack of formalised methodology to enable the reusability
of developed knowledge. The use of a knowledge representation language for managing domain knowledge in landslide detection is very rare. HazardMatch is a system developed for creating
landslide susceptibility maps using semantic technology [31]. In this work, landslide experts describe
the key properties of landslide susceptible areas, and the landslide relevant properties for potential areas are ranked by their similarity to those defined by experts.
In this study, landslide detection is selected as the problem domain and a case study is
developed using previously published work by Martha et al. [28], where the classification was
carried out using geographic object-based image analysis, but without using a formalised knowledge representation technique such as ontology to classify different landslide classes. The reason for using by
Martha et al. [28] for the case study was to benchmark the proposed ontological framework. We used
available remote sensing and landslide data, rule sets and classification results from [28] to evaluate
2.2. Landslides Class Description
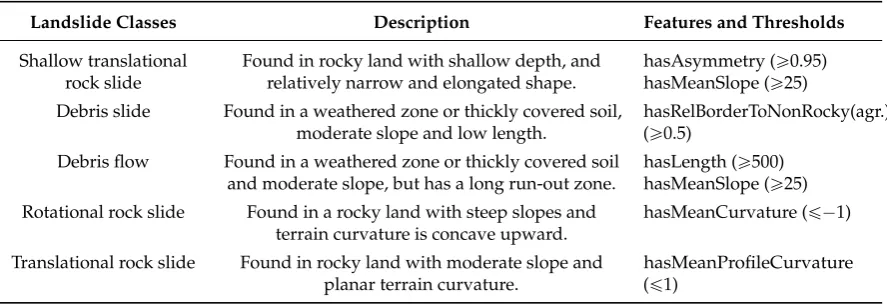
In this work, five different types of landslides are identified based on their spectral, contextual and morphometric characteristics. The landslide types and their description with feature criteria are
sourced from [28] and provided in Table1. In this table, the first column is landslide class; the second
column is a description in the natural language; and the third column is the translation of these descriptions into measurable thresholds. For example, shallow translational rock slides are relatively narrow and elongated in shape, which means they are asymmetrical in shape. Thus, we can say that ’shallow translational rock slide’ has a high asymmetry value and this is translated to the threshold of
[image:4.595.79.523.250.404.2]measurable features using hasAsymmetry (ě0.5).
Table 1.Descriptions of landslides classes sourced from [28].
Landslide Classes Description Features and Thresholds
Shallow translational rock slide
Found in rocky land with shallow depth, and relatively narrow and elongated shape.
hasAsymmetry (ě0.95) hasMeanSlope (ě25) Debris slide Found in a weathered zone or thickly covered soil,
moderate slope and low length.
hasRelBorderToNonRocky(agr.) (ě0.5)
Debris flow Found in a weathered zone or thickly covered soil and moderate slope, but has a long run-out zone.
hasLength (ě500) hasMeanSlope (ě25) Rotational rock slide Found in a rocky land with steep slopes and
terrain curvature is concave upward.
hasMeanCurvature (ď´1)
Translational rock slide Found in rocky land with moderate slope and planar terrain curvature.
hasMeanProfileCurvature (ď1)
2.3. Data
IRS (Indian Remote-Sensing Satellite)-P6 (also known as ResourceSat-1) is an earth observation mission within the IRS series of ISRO (Indian Space Research Organisation). Multi-spectral image data acquired on 16 April 2004 was used to calculate spectral characteristics used in defining landslide classification rules. The ResourceSat-1 is equipped with a high resolution Linear Imaging Self Scanner
(LISS-IV) operating in three spectral bands as shown in Table2.
Table 2.ResourceSat-1 spectral bands with 5.8 m spatial resolution.
Bands Range
green (0.52–0.59 µm) red (0.62–0.68 µm) near-infra-red (0.77–0.86 µm)
A Digital Elevation Model (DEM) created from 2.5 m resolution stereoscopic Cartosat-1 data acquired on 6 April 2006 was used to extract morphometric derivatives. The cartosat-1 optical satellite was launched by ISRO and is equipped with two panchromatic sensors, Pan-Aft and Pan-Fore with
´5° and 26° view angles, respectively. The satellite captures in-orbit stereo images simultaneously that
can be used to generate a DEM.
In this study, the pre-processed satellite image data and DEM with its derivatives were sourced
from [28]. The satellite image from ResourceSat-1 was orthorectified using the 10 m DEM created from
[image:4.595.228.367.538.593.2]2.4. Study Area
The study area covers a landslide prone area of about 28 km2bounded between 30°311302N and
30°341302N latitude and 79°6102E and 79°9102E longitude as depicted in Figure1. It is located on
the Madhyamaheshwar sub-catchment of Okhimath in the Uttarkhand state of India and situated at the confluence of the Mandakini and Madyamaheshwar rivers. The average elevation of Okimath is 1300 m ranging from 1047 m to 2620 m. The region experiences a subtropical temperate climate with annual rainfall between 1200 mm to 1500 mm. This study area has a high potential for rainfall and
earthquake-induced landslides with past landslide occurrences [32,33].
79°9'0"E 79°9'0"E
79°7'30"E 79°7'30"E
79°6'0"E 79°6'0"E
30°34'30"N 30°34'30"N
30°33'0"N 30°33'0"N
30°31'30"N 30°31'30"N
±
0 0.5 1 1.5 2Kilometers
1:50,000
[image:5.595.85.509.226.516.2]India
Figure 1.Study area located on the Madhyamaheshwar sub-catchment of Okhimath in the Uttarkhand state of India.
3. Methodology
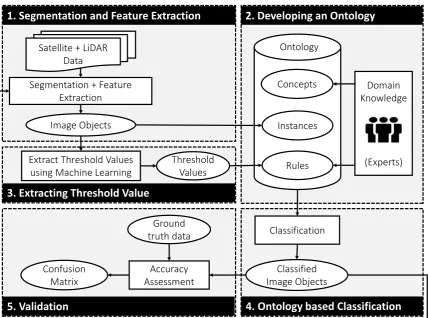
Based on the principle of modularity, the proposed classification framework is broadly categorised into five different modules: (1) Segmentation and feature extraction; (2) Developing an ontology;
(3) Extracting threshold value; (4) Ontology based classification; and (5) Validation. Figure2outlines
Extract Threshold Values using Machine Learning
Threshold Values
3. Extracting Threshold Value
1. Segmentation and Feature Extraction
2. Developing an Ontology
Segmentation + Feature Extraction
Image Objects
Classification
4. Ontology based Classification
ClassifiedImage Objects Instances Concepts
Rules Ontology
Domain Knowledge
(Experts) Satellite + LiDAR
Data
5. Validation
Accuracy
AssessmentGround truth data
[image:6.595.85.514.84.402.2]Confusion
MatrixFigure 2. Workflow diagram for ontology based image classification with 5 modules; Module (1): Segmentation and Feature Extraction; Module (2): Developing an Ontology; Module (3): Extracting Threshold Value; Module (4): Ontology based Classification; and Module (5): Validation.
3.1. Segmentation and Feature Extraction
In GEOBIA, segmentation is the first essential step where an image is partitioned into objects that can be characterised and classified. Several image segmentation techniques exist and the proposed framework permits the use of any segmentation techniques because of its modular design. The segmentation process results in the creation of image objects featuring different characteristic attributes such as spectral, geometrical, or contextual. Here, a significant improvement over a per-pixel approach can be realised, where an image object can feature spectral information in terms of mean, standard deviation, minimum and maximum values. The segmented object as a collection of pixels can have geometric attributes such as shape and size. Additionally, partitioned objects are contextually
related by spatial relationships such asdistanceTo,hasBorderWith, etc.
Feature extraction is the next step in which different feature values are calculated for each of the image object segments. In our workflow, the calculated feature values are exported from the module 1
(See Figure2) in CSV (Comma Separated Values) format. The output of this module is segmented
image objects with feature values.
In this case study, two different segmentation techniques were implemented using eCognition
Developer Version 9.0.2 (Arnulfstrasse, Munich, Germany), namely, multiresolution [6] and chessboard
segmentation [34]. Initially, a multiresolution segmentation was carried out based on multi-spectral
segmentation based on terrain curvature data instead of spectral data with a scale parameter of 10, shape parameter of 0.1 and compactness parameter of 0.5 was used on those image segments classified as rock slides. This curvature based segmentation highlights variations in concavity and convexity
features, which is used to classify rotational and translational rock slides [28].
In general, there is a semantic connection between image objects, segmentation parameters and data used. Thus, it is not just the classification that is driven by the ontology, it is the size and the shape of the segments as well (e.g., when we imagine a landslide of a particular class, we define it in terms of shape and size as well). The size and shape of the segments are outcomes of the chosen segmentation parameters as described above. As this work is focussed on the classification problem,
the segmentation approach used in the previous work [28] is adopted and the segmentation parameters
are not triggered by any rules based on ontology.
3.2. Developing an Ontology
Ontology development is essentially a process of identifying concepts and the relationships
between concepts within a domain of knowledge. In module 2 (See Figure2), we defined domain
concepts, taxonomical structure, and properties to formally represent domain knowledge from experts.
Protégé 5.2.0, an open source tool from Stanford University, was used to construct this ontology [35].
Studer [36] made a refinement to Gruber’s [12] definition describing ontology as a “formal,
explicit specification of a shared conceptualization”. In elaboration of this definition,conceptualisation
is an abstract model of world phenomenon identified by the concepts;sharedmeans an ontology is
a consensual knowledge agreed by experts;explicitmeans the concept types and the constraints on
their use are explicitly defined; andformalmeans that the ontology should be machine-readable. In this
study, we have used OWL as a knowledge representation language for ontological formalism.
In our work, we followed the generalised steps proposed in [37]. The steps for ontology-development
method were developed for frame-based formalism, whereas we use description logic-based formalism
(e.g., OWL) in our work. Taking the differences between two formalisms into account [38], no facets and
slots are created in steps 5 and 6 described below.
The following seven steps were conceived in developing the landslide ontology:
Step 1 Determine the domain and scope of the ontology
The formal representation of a landslide was determined as a domain with scope limited to slope movement and material type.
Step 2 Consider reusing existing ontologies
To reuse ontology, we searched for a relevant ontology with concepts that can define a
landslide domain. No formalised ontology existed but Varnes’ landslides classification [39]
shown in Table3does provide a taxonomy of landslides.
Step 3 Enumerate important terms in the ontology
Ontology uses terms to define the concepts and relationships that describes and represents the domain area. In addition, an identification of key terminology used in our domain of
interest is a vital step. Table1defines different types of landslides. From these definitions,
Table 3.Types of landslides based on Varnes’ classification of slope movements [39].
Type of Movement
Type of Material
Bedrock Engineering Soils
Predominantly Coarse Predominantly Fine
Falls Rock Fall Debris fall Earth fall
Topples Rock topple Debris topple Earth topple
Slides Rotational Rock slide Debris slide Earth slide Translational
Lateral Spreads Rock spread Debris spread Earth spread
FLOWS Rock flow Debris flow Earth flow
(deep creep) (soil creep)
Complex Combination of two or more principal types of movement
Step 4 Define the classes and the class hierarchy
The terms created in the last steps provide the basis for creating new classes that describes
domain concepts. A class hierarchy can be created using top-down, bottom-up or
a combination of both the approaches. The structure of the hierarchy depends on the usage
and scope of ontology. Varnes’ landslides classification [39] is followed when constructing
the class hierarchy.
Step 5 Define the properties of classes
Within the feature extraction process, different attributes based on spectral, spatial, geometrical and morphological features characterising geographical objects in satellite images are extracted. These attributes are represented as datatype properties in the ontology, and link individuals (image segments) to their data values. In OWL, a datatype property is defined
as an instance of the built-in OWL class owl:topDataProperty [40]. The datatype properties
created are shown in Figure3.
owl:topDataProperty
hasAsymmetry hasGeom hasLength
hasMeanCurvature hasMeanProfCurvature hasMeanSlope
hasRelBorderToNonRockyAgr
Figure 3.Datatype properties to represent extracted attributes.
Step 6 Define the restrictions associated with a class directly
In this step, we defined restrictions like domain and range of the concepts. For example, the value of property hasMeanSlope is restricted to be of datatype double.
Step 7 Create instances
[image:8.595.228.375.520.622.2]3.2.1. Modularisation of Ontology
In our work, the modularisation of ontology resulted in two modules, namely a domain and a feature ontology. Modularisation enables ontology transferability and avoids the reuse of a whole domain ontology when only a fragment of it is needed. With ontology modularisation, only relevant
concepts and relations are used in an ontology being modelled [41].
• Domain Ontology
Domain Ontology defines concepts that describe entities found in that particular domain. Different types of landslide concepts represent a domain ontology. In a domain ontology,
each class and their sub-class relationship are represented with subset notation (Ď) as below.
For instance, the relationship (1) describes that engineering_soils and bedrock are the subsets
of material_type. Similarly, relationships (2)–(4) show the sub-classes of classes landslides,
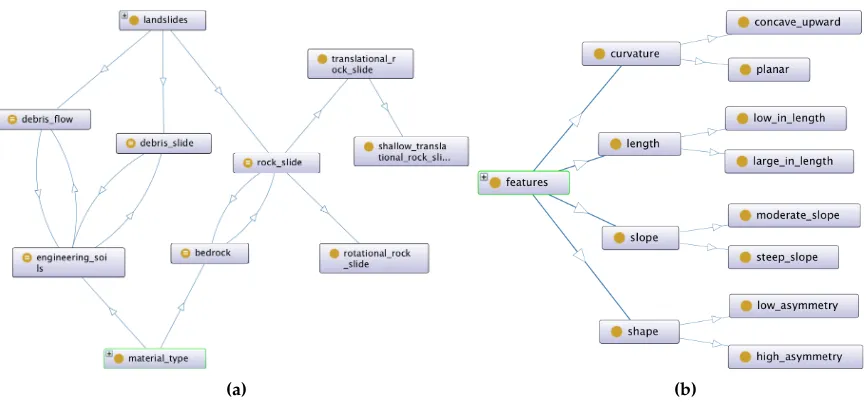
rock_slide and translational_rock_slide, respectively. In Figure4a, the hierarchical relationships
of domain ontology are presented in graphical form:
engineering_soils,bedrockĎmaterial_type, (1)
debris_f low,debris_slide,rock_slideĎlandslides, (2)
rotational_rock_slide,translational_rock_slideĎrock_slide, (3)
shallow_translational_rock_slideĎtranslational_rock_slide. (4)
• Feature Ontology
Feature ontology defines concepts that describe the characteristics of different attributes identified during the feature extraction process based on spectral, spatial, geometrical and morphological features. Feature classes and their sub-class relationship are represented below. The subsets of
classes features, curvature, length, slope and shape is shown in relationships (5)–(9), respectively.
The feature ontology graph with hierarchical relations is presented in Figure4b:
curvature,length,slope,shapeĎ f eatures, (5)
concave_upward,planarĎcurvature, (6)
large_in_length,low_in_lengthĎlength, (7)
moderate_slope,steep_slopeĎslope, (8)
high_asymmetry,low_asymmetryĎshape. (9)
(a) (b)
Figure 4.Landslide ontology (a) domain ontology; (b) feature ontology.
3.2.2. Ontological Rules
Modularisation of ontological rules is performed to separate domain and feature classes identification rules. The aim of this modularisation is to isolate generic rules from localised rules that change with datasets provided.
• Generalised Rules
These rules involve the use of classes from the feature ontology to identify classes from the domain ontology. We have coined this as generalised rules in the sense that these rules are domain specific but are applicable to any datasets from that domain. To develop such rules, expert domain knowledge must be extracted from domain experts or the literature. In our case,
we have extracted these rules from the definition of the landslide classes (Table1). The definition
of a debris slide states that they are found in thickly covered soil of moderate slope and low
length. The rules extracted based on this definition are shown as SWRL rule (Rule (10)) below:
landslidesp?xqˆengineering_soilsp?xqˆmoderate_slopep?xqˆlow_in_lengthp?xq
Ñdebris_slidep?xq. (10)
• Localised Rules
These are rules that define the threshold values for determining which instances belong to their respective feature classes. The feature ontology shows that feature concept curvature is further sub classified into concave_upward and planar. To identify these feature concepts, we have developed rules based on the different variables available with the datasets. For instance, we can identify
whether an image segment instance is engineering soils or bedrock using (Rules (11) and (12)):
hasRelBorderToNonRockyAgrp?x, ?yqˆswrlb:greaterThanOrEqualp?y, ”0.5”ˆ ˆxsd:doubleq
Ñengineering_soilsp?xq, (11)
hasRelBorderToNonRockyAgrp?x, ?yqˆswrlb:lessThanp?y, ”0.5”ˆ ˆxsd:doubleq
Ñbedrockp?xq. (12)
generalised and localised rules benefits the transferability of the rules. The generalised rules are completely transferable while localised rules are transferable but may require an adaptation to new threshold values. This is the challenging task for rules based image classification in identifying threshold values of the attributes used to identify feature concepts. To deal with this issue, we employed machine learning (ML) techniques.
3.3. Extracting Threshold Value
The rules that can classify instances of segmented image objects into respective landslide classes on the basis of their parameter values are extracted in this module. For each parameter, a threshold corresponding to each feature class (e.g., high_in_length, high_asymmetry) is determined.
For this task, an ML technique is used, as it is difficult for operators to extract rules from data. Moreover, ML techniques are routined and structured than human-crafted rules. This also reduces human involvement in the whole classification. The overall process of rules extraction is depicted
in Figure5.
Random Forest
Threshold Values Range Value
Extraction Segmented
Image Objects
.CSV
[image:11.595.81.510.294.484.2]inTrees Rulesets
Figure 5.Workflow process for rules threshold extraction.
3.3.1. Implementation of Random Forest Method
With this aim, we employed Random Forest (RF) as a ML method for extracting rule based
knowledge. Random forest (RF) [42] is an ensemble learning method that constructs multiple decision
trees using bootstrapping for classification. The outputs of all trees are aggregated via plurality voting in order to classify a new input.
In this work, we used the R package ‘randomForest’ that implements Breiman’s random forest
algorithm. The necessary training data were created using the classification rulesets from [28] in
eCognition. The predictor variables used in the RF model are asymmetry, length, curvature, profile curvature, slope, and relBorderToNonRockyAgr.
The issue in using RF is that the ease of interpretation is lost as compared to a single decision tree model. The rules extracted from RF tree ensembles are high in number. Hence, RF cannot be used for
threshold value extraction of attributes. To resolve this issue, we used theinTrees(interpretable trees)
framework [43] that can extract reduced sets of rules.
3.3.2. Rules Simplification UsinginTreesFramework
created. TheinTreesframework assists in model interpretation and gives reduced rulesets for model prediction that matches with RF.
TheinTreesframework is used to extract an interpretable and reduced set of rules from the RF model. This framework takes a tree ensemble as an input. The rules governing the splits in each of the ensembles are extracted. The extracted rules are measured and ranked based on their length, frequency, and error metrics. Next, the irrelevant and redundant rules are pruned. Finally, the pruned rules are
simplified into a set of if/then rules [43]. The R implementation of this framework‘inTrees’package is
used in this work.
3.3.3. Feature Attribute Threshold Value Extraction from Rules
The threshold value for each attribute were extracted from the simplified rules pruned from RF results. Such rules extracted from classification trees are used to identify concepts for automatic
ontology building [44]. In our work, we have developed an algorithm using a similar approach to
determine the threshold values for pre-defined feature concepts. The algorithm used for threshold
value extraction is shown in Algorithm1.
Algorithm 1: Threshold value extraction algorithm Input: Pruned rules frominTrees
Output: Threshold values for each attributes
1: Identify attributes used in the rules
2: Identify all the span values (SV1,SV2, SV3, ... SVn) for each attributes
3: fori“1 tondo 4: forj“1 tondo
5: ifSVi‰SVjandSViĎSVjthen
6: SVi is a subspan ofSVj
7: end if
8: end for
9: end for
10: Select span hierarchy level based on feature attribute level
11: Map threshold value with feature sub classes
12: return thresholdvalues
At first, the values of the attributes (Ex. length, shape, curvature) used in the rules were identified.
[image:12.595.209.387.576.624.2]For each attribute, their span values were determined as shown in Table4.
Table 4.Determining span values of attributes used in rules.
Attribute from Rules Span Values curvatureď ´0.99 SV1:r´8,´0.99s curvature >´0.99 SV2:p´0.99,8s curvature >´0.91 SV3:p´0.91,8s
Next, each span was checked to determine if it was contained by other spans, in order to determine
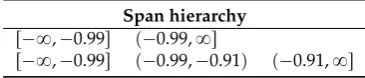
the span hierarchy as shown in Table5.
Table 5.Span hierarchy for curvature attribute.
Span hierarchy r´8,´0.99s p´0.99,8s
[image:12.595.205.388.704.743.2]From the ontological knowledge, we know that feature class curvature has two subclasses (concave_upward and planar), so we will now select two spans from the hierarchy.
r´8,´0.99s p´0.99,8s
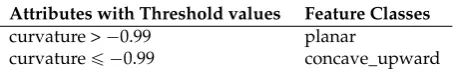
[image:13.595.185.414.191.227.2]Finally, we identify the threshold values for two curvature subclasses, as illustrated in Table6.
Table 6.Identification of threshold values.
Attributes with Threshold values Feature Classes curvature >´0.99 planar
curvatureď ´0.99 concave_upward
3.4. Ontology Based Classification
This module is the ontology-driven rule-based image classifier. The ontological rules were written using SWRL. In SWRL, a rule consists of an antecedent and a consequent, each of which is composed of a set of atoms. Atoms can be of the form C(x), P(x,y), sameAs(x,y) differentFrom(x,y), or builtIn(r,x,...), where C is an OWL description or data range, P is an OWL property, r is a built-in relation, and x and
y are either variables, OWL individuals or OWL data values, as appropriate [18]. Both antecedent and
consequent are conjunctions of atoms written as a1ˆ a2... ˆ an. The variables are indicated using the
standard convention of prefixing them with a question mark (e.g., ?x). SWRL allows the use of the
built-insgreaterThanOrEqualandlessThanwhose role is to restrict the numeric value of the variables
accordingly. For instance, we have rule to identify ’debris_slide’ as:
landslidesp?xqˆengineering_soilsp?xqˆmoderate_slopep?xqˆlow_in_lengthp?xq
Ñdebris_slidep?xq. (13)
In the above Syntax (13), a rule asserts that the composition of ‘landslides’ individuals that are
instances of ‘engineering_soils’, ‘moderate_slope’ and ‘low_in_length’ are the ‘debris_slide’ individuals.
The rule set for rest of the landslides classes namely ‘debris_flow’ (Syntax (14)), ‘rotational_rock_slide’
(Syntax (16)), ‘translational_rock_slide’ (Syntax (17)), and ‘shallow_translational_rock_slide’
(Syntax (18)) are shown below:
landslidesp?xqˆengineering_soilsp?xqˆmoderate_slopep?xqˆlarge_in_lengthp?xq
Ñdebris_f lowp?xq, (14)
landslidesp?xqˆbedrockp?xq Ñrock_slidep?xq, (15)
rock_slidep?xqˆconcave_upwardp?xq Ñrotational_rock_slidep?xq, (16)
rock_slidep?xqˆmoderate_slopep?xqˆ planarp?xq Ñtranslational_rock_slidep?xq, (17)
translational_rock_slidep?xqˆhigh_asymmetryp?xq Ñshallow_translational_rock_slidep?xq. (18)
These SWRL based rules were executed using a Pellet reasoner [15] to classify the landslides
instead of eCognition. In [21], eCognition was a classification platform and hence a simple XSLT
(Extensible Stylesheet Language Transformations) was used to translate from OWL into eCognition class descriptions. However, in this study, a Pellet reasoner was used for classification platform independent from eCognition. Pellet is an OWL-DL (Web Ontology Language-Description Logic) reasoner that supports reasoning with individuals. This feature was required to associate every image segment instance to different domain classes. This way, we classified every image segment to respective landslide classes. The classification results were exported into CSV (Comma Separated Values) and Shapefile format. The classification result also serves as high-level input for segmentation
and this process is termed classification-based segmentation in GEOBIA [7]. For classification-based
3.5. Validation
Validation is performed by comparing the classification result with ground truth data. The accuracy of classification results is assessed using a standard error matrix (confusion matrix)
to calculate Total Accuracy (Equation (19)), Random Accuracy (Equation (20)) and Kappa Statistic
(Equation (21)) [45]. User and producer accuracy are calculated to evaluate omission and commission
errors for each class. To evaluate these metrics, True Positives (TP), True Negatives (TN),
False Positives (FP) and False Negatives (FN) are calculated by validating the classification results against the ground truth data. In our study, we used the kappa statistic because it is widely employed by the remote sensing community as a standard measure for accuracy assessment, although we
acknowledge criticisms of this technique [46,47]. The validation process was carried out using ENVI
image analysis software Version 5.2 (Boulder, Colorado, USA) [48].
Total Accuracy“ TP`TN
TP`TN`FP`FN, (19)
RandomAccuracy“ pTN`FPq ˚ pTN`FNq ` pFN`TPq ˚ pFP`TPq
Total Accuracy˚Total Accuracy , (20)
Kappa“ pTotal Accuracy´RandomAccuracyq
p1´RandomAccuracyq . (21)
4. Results
4.1. Knowledge Extraction Results
The Random Forest analysis resulted in a number of rules that were pruned and reduced using
[image:14.595.100.487.465.643.2]inTreesFramework. The reduced set of rules is shown in Table7.
Table 7.Pruned rules from random forest using framework.
Pruned Rules Class
length > 1053.04 debris flow
lengthď1053.04 & relBorderToNonRockyAgr > 0.48 debris_slide relBorderToNonRockyAgr > 0.46 debris_slide lengthď1053.04 & slopeď30.71 debris_slide relBorderToNonRockyAgr > 0.51 debris_slide slopeď23.25 & relBorderToNonRockyAgr > 0.36 debris_slide curvatureď ´0.99 & relBorderToNonRockyAgrď0.45 rotational_rock_slide
asymmetry > 0.93 & slope > 31.25 shallow_translational_rock_slide asymmetryď0.88 & curvature >´0.99 &
relBorderToNonRockyAgrď0.55
translational_rock_slide
curvature >´0.91 & relBorderToNonRockyAgrď0.51 translational_rock_slide curvature >´0.99 & relBorderToNonRockyAgrď0.36 translational_rock_slide
The rules from Table 7are used as an input to Algorithm 1to extract the threshold values
of the feature variables. As explained in Section3.3.3, for each feature variable, the span values
are determined and threshold values are calculated. For instance, length has a two value range
(lengthď1053.04 and length > 1053.04). These serve as the threshold values for the feature classes
‘low_in_length’ and ‘large_in_length’, respectively. We apply Algorithm1to extract threshold values
Table 8.Extracted threshold values from rules.
Feature Class Subclass Original Extracted curvature concave_upward ď´1 ď´0.99
planar >´1 >´0.99 materials engineering_soils ě0.5 >0.46
bedrocks <0.5 ď0.55 length large_in_length >500 >1053.04
low_in_length <500 ď1053.04 shape high_asymmetry ě0.95 >0.93
low_asymmetry <0.95 <0.93
The original values derived from [28] and the extracted values from the ML rules were very
similar. Their close correspondence demonstrates how we can automate the extraction of threshold values from data sets using ML techniques. After determining the threshold values, the classification
rules are written in SWRL, as shown in Rules22and23for feature class ‘length’. Similarly, using these
newly extracted values, the localised rules for all the feature classes were created to perform the ontology-based classification:
hasLengthp?x, ?yqˆswrlb:lessThanOrEqualp?y, ”1053.04”ˆ ˆxsd:doubleq
Ñlow_in_lengthp?xq, (22)
hasLengthp?x, ?yqˆswrlb:greaterThanp?y, ”1053.04”ˆ ˆxsd:doubleq
Ñlarge_in_lengthp?xq. (23)
4.2. Classification Results
Figure6shows ground truth polygons and classification results from both the non-ontological
and the ontological methods. Figure6a is the result from the non-ontological method and refers
to the output of a rule-based classification using eCognition software. In the ontological method, an assignment of image segment instance to their respective classes is performed by reasoning over
the SWRL rules as depicted in Figure6b. Figure6c is the reference landslide inventory prepared
by [28] using landslide inventory data from [33,49]. The landslide polygons are drawn manually with
a stereoscopic analysis of satellite data verified with detailed field investigation.
Table9shows the number of occurrences of landslide classes and area covered by each classified
landslide under the ontological and non-ontological methods. The results show that the classification methods have the same number of classified landslides and area coverage. The number of different
landslides and area coverage is compared with the ground truth based inventory (Figure7). This graph
[image:15.595.121.475.634.720.2]shows no match between the ontological method and the landslide inventory ground truth data. Thus, to further assess the accuracy and validate the classification result, a confusion matrix is generated.
Table 9.Number and area coverage of classified landslides classes.
Class Name Ontological Method Non-Ontological Method
Count Area Count Area
Shallow translational rock slide 1 1345.6 1 1345.6
Debris slide 12 51,872.88 12 51,872.88
Debris flow 1 291,591.52 1 291,591.52
(a) (b) (c)
Shallow translational rock slide Debris slide
[image:16.595.96.500.91.329.2]Debris flow Rotational rock slide Translational rock slide
Figure 6. Landslide classification (a) results from the non-ontological method; (b) results from the ontological method; (c) ground truth.
Figure 7.Comparison between ground truth inventory and classification results from the ontological method.
4.3. Accuracy Assessment Results
The performance of the ontology-based classification results is measured with a confusion matrix
in Table10. The overall accuracy of 86.3% and kappa statistic value of 0.79 is achieved with both the
ontological and non-ontological method.
To visualise the inter-relationships between different landslide classes, a chord diagram is
developed (Figure8). In this diagram, each landslide class segment is represented by a different
[image:16.595.86.513.390.535.2]Table 10.Confusion matrix.
a a
a a
a a
a a
a a
a a
a a a
ReferenceÓ
ClassifiedÑ
Shallow translational rock slide
Debris slide
Debris flow
Rotational rock slide
Translational rock slide
Classification overall
Producer accuracy (Precision)
Shallow translational rock slide 0 0 113 21 229 363 0%
Debris slide 0 666 0 0 0 666 100%
Debris flow 0 197 8596 0 0 8793 97.8%
Rotational rock slide 0 0 0 2480 1699 4179 59.4%
Translational rock slide 0 0 0 477 5502 5979 92.0%
Truth overall 0 863 8709 2978 7430 19980
User accuracy (Recall) 0% 77.2% 98.7% 83.3% 74.1%
Overall accuracy 86.3%
The strip that remains within its own segment represents true positives, whose value is shown inside the circle (e.g., 5502 for ‘Translational rock slide’). Strips going to different classes represent the number of pixels of the objects that are false positives. The strip going from ‘Translational rock slide’ to ‘Rotational rock slide’ is 477 pixels and vice versa is 1699 pixels. This explains what portion of each landslide is misclassified as another class.
Sh
al
lo
w
tr
an
sl
ati
on
al
roc
k sl
ide
8596
363
1699
197
2480
666 5502
[image:18.595.141.460.169.477.2]229
Figure 8. Confusion matrix result represented in chord diagram to display the inter-relationships between different landslide classes.
None of the pixels were classified as ‘shallow translational rock slide’ giving 0% producer accuracy. The 0% producer accuracy of ‘shallow translation rock slide’ arises from the failure of the segmentation algorithm to delineate the linear features. The ‘shallow translational rock slide’ class features are linear and the generated segments were not linear. All 666 pixels classified as ‘debris slide’ are correctly classified resulting 100% producer accuracy. In the case of ‘debris flow’, 8596 out of 8793 were classified as ‘debris flow’ and rest 197 were misclassified as ‘debris slide’. Similarly, in the ‘rotational rock slide’, out of 4179 pixels, only 2480 pixels were classified correctly and 1699 were classified as ‘translational rock slide’. Chord diagram shows that 5502 pixels were classified as ‘translational rock slide’ and remaining 477 out of 5979 pixels are classified as ‘rotational rock slide’.
5. Discussion
5.1. Ontological Approach
feature value extracted from remote sensing data. The ontology-based methodology has both strengths and limitations, which are discussed below.
The use of a knowledge representation language such as OWL for constructing formalised domain
knowledge makes it more shareable and extensible [21]. The modular approach treats the knowledge
building process as a separate module from the image analysis process. This benefits domain experts, who are able to augment new knowledge at any moment without interrupting the classification process. Furthermore, a bias-free knowledge developed through a consensus of domain experts will be used in image interpretation. Incorporating human expert knowledge as ontology decreases human intervention at the time of image classification process. This helps GEOBIA to evolve towards becoming a more automated process.
The ontology-based framework supports and improves spatial data interoperability. The use of open standard formats, such as OWL and SWRL, in this framework bring both syntactic and semantic interoperability. Hence, interoperability assists in transferability of knowledge, rules or results. In GEOBIA, the use of ontology also assists in data analysis, in addition to data discovery,
data integration, and data publication [9]. The knowledge base created in landslides can be shared
across different disciplines. In this case study, the rule sets developed to identify landslides for the Okhimath area can be transferred and reused for different region datasets with slight modifications.
The reuse of only a certain part of an existing ontology is possible with modularisation, which reduces the overhead of loading the whole of an ontology when only a part of it is needed. Ontology modularisation also assists with tackling the limitation of degrading performance of reasoners with an increase in the size of an ontology. The inferencing capability performed automatic classification of image segments by providing the SWRL rules to the reasoner. One of the issue to be considered when using inference based classification is that it may take a significant time when complex SWRL rules are used.
The lack of spatial analysis capability in the ontology based classification module leads to a requirement for more interaction with image analysis tools. This can bring complexity to the overall process of classification. In the case study presented, we had to use eCognition software to calculate area and distance to class for newly classified image objects that are used for classifying other classes. The use of custom spatial built-in in SWRL rules can reduce such complexity. Remote sensing or domain experts involved in the image analysis process might have far less or no knowledge of ontology engineering. This methodology requires the users to possess an understanding of ontology and knowledge engineering.
5.2. Modularity
The concept of modularity has been introduced in technological and organisation design for
tackling complexity [50]. Modularity refers to the subdivision of a system into smaller parts called
modules. The key aspect of modular programming is that we can reuse the modules at different stages. In this work, modularisation can be seen at two stages—firstly, the modularity in framework allowing division of steps into independent modules; secondly, the modularisation of developed ontology and rules.
A modular approach has been adopted in GEOBIA frameworks [51–53]. Modularity ensures
a framework to become more customisable and expandable. For instance, with modularisation of segmentation and classification as independent modules, we have an ability to use two different tools for each module. This demonstrates the flexibility and extensibility of the proposed framework over proprietary software with functionalities limited within their software. Using a modular approach,
Ref. [51] introduced system extension capabilities in their framework to incorporate third party
functionalities. This opens the possibility for researchers to integrate different tools or build new algorithms on top of the existing framework.
In GEOBIA, complexity increases with the iterative process and composite workflow [54].
a number of simpler tasks. This allows error assessment of output results at the end of each module, which becomes input to the next module in a work chain.
With modularity, the ontology construction process is isolated from image analysis tasks, allowing domain experts to create the knowledge base independently. A group of domain experts can work together collaboratively in the knowledge construction process. Thus, knowledge-based image analysis in GEOBIA becomes less subject to the expertise of a particular analyst. Ontology modularisation further assists in tackling transferability issues. The transferable domain ontology is developed separately from data dependent feature ontology. The data dependent ontology or rules needs adaptation to make them transferable.
5.3. Classification Results
We performed two rule-based classifications using the same set of rules: firstly, the ontological
method proposed in this paper and later the non-ontological method from the published literature [28].
In the experiment, the same segmentation technique was used for both cases resulting in the same number and shapes of segmented images. The classification result of the ontological method was found to be consistent with a non-ontological method in terms of classified object counts, thus benchmarking the performance of the proposed method.
This shows that an ontological approach contributes a complementary classification method in GEOBIA but with added benefits provided by knowledge formalisation. The advantages of the ontological method over non-ontological methods are data interoperability, knowledge transferability, semantic inferencing and more automation with less human intervention.
The numbers of classified objects and shapes did not match when compared with the reference landslide inventory based on ground truth. Thus, a confusion matrix was calculated to assess the accuracy of the image classification by comparing classified image segments with reference landslide inventory. An overall accuracy of 86.3% was achieved. The discrepancy between the classification result and reference data is dependent on the segmentation result and the threshold values for different features defined in the rules. This demands further study in improving image segmentation, which was not considered in this study as our work is primarily focussed on finding applicability of ontological methodology in GEOBIA.
5.4. Limitations
The proposed ontological framework may suffer from computational inefficiency due to its dependency on the capabilities of the reasoner. With an increase in the number of instances, classes, relations and axiom, the reasoning time may significantly increase. To tackle this issue in future work, we will further explore the use of OWL 2 profiles that trade expressive power for the efficiency of reasoning.
The accuracy of the rule-based classification is influenced by the scale-level of image segmentation. Different objects are identified at different scale levels depending on their spatial and thematic characteristics. This means that, if the classification is carried out with the segmented image objects at an inappropriate scale-level, there will be inaccuracy in the classification result. However, this is
an open issue in GEOBIA, which warrants further explorations and studies [55].
With machine learning, there is a need for good training data to achieve better prediction. In the absence of adequate training data, the threshold value extracted might depart from the actual value.
6. Conclusions
the form of expert knowledge, for defining classification rules and the threshold values for attributes used in those rules. To tackle this intervention, we combined machine learning into an ontological framework for automatic extraction of threshold values used in the rule-based classification of GEOBIA. Modularisation of ontology is introduced to separate transferable domain ontology and non-transferable feature ontology. This study captures high level domain knowledge from experts and low-level knowledge from data using machine learning techniques. We formalised domain expert knowledge in the specific field of landslides and benchmarked by comparing with published work. The scope of this study is landslide detection, which has not previously been studied using an ontological framework.
This study helps to progress the application of ontological methods within GEOBIA. It demonstrates a novel approach to automatically extracting threshold values for feature attributes used in ontological classification rules. The developed approach distinguishes between transferable and non-transferable ontologies. In addition, it demonstrates the application of these methods to a new domain landslide detection.
An avenue for further research is incorporation of spatial rules and exploration of optimal combinations of segmentation, classification-based-segmentation, and, in turn, the final classification in an ontology driven GEOBIA framework.
Acknowledgments:The authors would like to acknowledge the University of Tasmania, Discipline of Geography and Spatial Sciences for the logistics support. Sachit Rajbhandari is supported by an Australian Government Research Training Program Scholarship.
Author Contributions:S.R. and J.A. conceived the project; S.R. processed the data and wrote the first draft of the manuscript; J.A., J.O., A.L. and R.M. commented on the manuscript and supervised the project.
Conflicts of Interest:The authors declare no conflict of interest.
Abbreviations
The following abbreviations are used in this manuscript:
ALS Airborne Laser Scanning CSV Comma Separated Values DEM Digital Elevation Model DTM Digital Terrain Model FN False Negatives FP False Positives
GEOBIA Geographic Object-Based Image Analysis inTrees interpretable Trees
IRS Indian Remote-Sensing Satellite ISRO Indian Space Research Organisation LiDAR Light Detection And Ranging ML Machine Learning
NDVI Normalized Difference Vegetation Index OWL Web Ontology Language
OWL-DL Web Ontology Language-Description Logic RF Random Forest
SWRL Semantic Web Rule Language TN True Negatives
TP True Positives
W3C World Wide Web Consortium
XSLT Extensible Stylesheet Language Transformations
References
2. Blaschke, T.; Lang, S.; Lorup, E.; Strobl, J.; Zeil, P. Object-oriented image processing in an integrated GIS/remote sensing environment and perspectives for environmental applications. Environ. Inf. Plan. Politics Public2000,2, 555–570.
3. Weih, R.C., Jr.; Riggan, N.D., Jr. Object-based classification vs. pixel-based classification: Comparative importance of multi-resolution imagery.Int. Arch. Photogramm. Remote Sens. Spat. Inf. Sci.2010,38, C7. 4. Blaschke, T. Object based image analysis for remote sensing. ISPRS J. Photogramm. Remote Sens. 2010,
65, 2–16.
5. Hay, G.J.; Castilla, G. Geographic Object-Based Image Analysis (GEOBIA): A new name for a new discipline. InObject-Based Image Analysis: Spatial Concepts for Knowledge-Driven Remote Sensing Applications; Blaschke, T., Lang, S., Hay, G.J., Eds.; Lecture Notes in Geoinformation and Cartography; Springer: Berlin/Heidelberg, Germany, 2008; Chapter 4, pp. 75–89.
6. Baatz, M.; Schape, A. Multiresolution Segmentation—An Optimization Approach for High Quality Multi-Scale Image Segmentation. InXII Angewandte Geographische Informationsverarbeitung; Strobl, J., Blaschke, T., Griesebner, G., Eds.; Wichmann Verlag: Karlsruhe, Germany, 2000; pp. 12–23.
7. Benz, U.C.; Hofmann, P.; Willhauck, G.; Lingenfelder, I.; Heynen, M. Multi-resolution, object-oriented fuzzy analysis of remote sensing data for GIS-ready information. ISPRS J. Photogramm. Remote Sens.2004,
58, 239–258.
8. Belgiu, M.; Dr˘agu¸t, L.; Strobl, J. Quantitative evaluation of variations in rule-based classifications of land cover in urban neighbourhoods using WorldView-2 imagery. ISPRS J. Photogramm. Remote Sens. 2014,
87, 205–215.
9. Arvor, D.; Durieux, L.; Andrés, S.; Laporte, M.A. Advances in Geographic Object-Based Image Analysis with ontologies: A review of main contributions and limitations from a remote sensing perspective.ISPRS J. Photogramm. Remote Sens.2013,82, 125–137.
10. Nardi, D.; Brachman, R.J. An Introduction to Description Logics. InThe Description Logic Handbook; Franz, B., Diego, C., Deborah, L.M., Daniele, N., Peter, F.P.S., Eds.; Cambridge University Press: Cambridge, UK, 2003; pp. 1–40.
11. Arvor, D.; Kosmidou, V.; Libourel, T.; Adamo, M.; Tarantino, C.; Lucas, R.; O’Connor, B.; Blonda, P.; Pierkot, C.; Fargette, M.; et al. Semantic nets for object-oriented land cover mapping: A preliminary example. In Proceedings of the 4th International Conference on GEographic Object Based Image Analysis (GEOBIA 2012), Rio de Janeiro, Brazil, 7–9 May 2012; Brazilian National Institute for Space Research (INPE): São José dos Campos, Brazil, 2012; pp. 303–308.
12. Gruber, T.R. A translation approach to portable ontology specifications. Knowl. Acquis.1993,5, 199–220. 13. Agarwal, P. Ontological Considerations in GIScience. Int. J. Geogr. Inf. Sci.2005,19, 501–536.
14. Grau, B.C.; Horrocks, I.; Motik, B.; Parsia, B.; Patel-Schneider, P.; Sattler, U. OWL 2: The next step for OWL.
J. Web Semant.2008,6, 309–322.
15. Sirin, E.; Parsia, B.; Grau, B.C.; Kalyanpur, A.; Katz, Y. Pellet: A practical OWL-DL reasoner. Web Semant. Sci. Serv. Agents World Wide Web2007,5, 51–53.
16. Tsarkov, D.; Horrocks, I. FaCT++ Description Logic Reasoner: System Description. In Proceedings of the Automated Reasoning: Third International Joint Conference (IJCAR 2006), Seattle, WA, USA, 17–20 August 2006; Furbach, U., Shankar, N., Eds.; Springer: Berlin/Heidelberg, Germany, 2006; pp. 292–297.
17. KAON2. Available online:http://kaon2.semanticweb.org(accessed on 16 June 2016).
18. Horrocks, I.; Patel-Schneider, P.F.; Boley, H.; Tabet, S.; Grosof, B.; Dean, M. SWRL: A semantic web rule language combining OWL and RuleML.W3C Memb. Submiss.2004,21, 79.
19. Andrés, S.; Arvor, D.; Mougenot, I.; Libourel, T.; Durieux, L. Ontology-based classification of remote sensing images using spectral rules.Comput. Geosci.2017,102, 158–166.
20. Luo, H.; Li, L.; Zhu, H.; Kuai, X.; Zhang, Z.; Liu, Y. Land Cover Extraction from High Resolution ZY-3 Satellite Imagery Using Ontology-Based Method. ISPRS Int. J. Geo-Inf.2016,5, 31.
21. Belgiu, M.; Hofer, B.; Hofmann, P. Coupling formalized knowledge bases with object-based image analysis.
Remote Sens. Lett.2014,5, 530–538.
22. Gu, H.; Li, H.; Yan, L.; Liu, Z.; Blaschke, T.; Soergel, U. An Object-Based Semantic Classification Method for High Resolution Remote Sensing Imagery Using Ontology.Remote Sens.2017,9, 329.
24. Nieland, S.; Kleinschmit, B.; Förster, M. Using ontological inference and hierarchical matchmaking to overcome semantic heterogeneity in remote sensing-based biodiversity monitoring. Int. J. Appl. Earth Obs. Geoinf.2015,37, 133–141.
25. Metternicht, G.; Hurni, L.; Gogu, R. Remote sensing of landslides: An analysis of the potential contribution to geo-spatial systems for hazard assessment in mountainous environments. Remote Sens. Environ.2005,
98, 284–303.
26. Li, X.; Cheng, X.; Chen, W.; Chen, G.; Liu, S. Identification of Forested Landslides Using LiDar Data, Object-based Image Analysis, and Machine Learning Algorithms. Remote Sens.2015,7, 9705.
27. Aksoy, B.; Ercanoglu, M. Landslide identification and classification by object-based image analysis and fuzzy logic: An example from the Azdavay region (Kastamonu, Turkey). Comput. Geosci.2012,38, 87–98. 28. Martha, T.R.; Kerle, N.; Jetten, V.; van Westen, C.J.; Kumar, K.V. Characterising spectral, spatial
and morphometric properties of landslides for semi-automatic detection using object-oriented methods.
Geomorphology2010,116, 24–36.
29. Zhu, A.X.; Wang, R.; Qiao, J.; Qin, C.Z.; Chen, Y.; Liu, J.; Du, F.; Lin, Y.; Zhu, T. An expert knowledge-based approach to landslide susceptibility mapping using GIS and fuzzy logic. Geomorphology2014,214, 128–138. 30. Eisank, C.; Hölbling, D.; Friedl, B.; Chen, Y.; Chang, K. Expert knowledge for object-based landslide mapping
in Taiwan. South-East. Eur. J. Earth Obs. Geomat.2014,3, 347–350.
31. Jackson, L.E., Jr.; Smyth, C.P.; Poole, D. Hazardmatch: An application of artificial intelligence to landslide susceptibility mapping, Howe Sound area, British Columbia. In Proceedings of the 4th Canadian Conference on Geohazards, Quebec City, QC, Canada, 20–24 May 2008.
32. Islam, M.; Chattoraj, S.; Ray, C.P. Ukhimath landslide 2012 at Uttarakhand, India: Causes and consequences.
Int. J. Geomat. Geosci.2014,4, 544.
33. Naithani, A. The August, 1998 Okhimath tragedy in Rudraprayag district of Garhwal Himalaya, Uttaranchal, India.Gaia2001,16, 145–156.
34. Definiens, A.Definiens Developer 7 User Guide; Definiens AG: Munchen, Germany, 2007. 35. Protégé. Available online:http://protege.stanford.edu/(accessed on 28 May 2017).
36. Studer, R.; Benjamins, V.; Fensel, D. Knowledge Engineering: Principles and methods. Data Knowl. Eng. 1998,25, 161–197.
37. Noy, N.F.; McGuinness, D.L. Ontology Development 101: A Guide to Creating Your First Ontology. Available online:http://protege.stanford.edu/publications/ontology_development/ontology101-noy-mcguinness. html(accessed on 4 April 2017).
38. Wang, H.H.; Noy, N.; Rector, A.; Musen, M.; Redmond, T.; Rubin, D.; Tu, S.; Tudorache, T.; Drummond, N.; Horridge, M. Frames and OWL side by side. In Proceedings of the 9th International Protégé Conference, Stanford, CA, USA, 23–26 July 2006; p. 54.
39. Varnes, D.J. Slope movement types and processes. Transp. Res. Board Spec. Rep.1978,176, 11–33.
40. Motik, B.; Patel-Schneider, P.F.; Parsia, B.; Bock, C.; Fokoue, A.; Haase, P.; Hoekstra, R.; Horrocks, I.; Ruttenberg, A.; Sattler, U. OWL 2 web ontology language: Structural specification and functional-style syntax. W3C Recomm.2009,27, 159.
41. Doran, P.; Tamma, V.; Iannone, L. Ontology Module Extraction for Ontology Reuse: An Ontology Engineering Perspective. In Proceedings of the Sixteenth ACM Conference on Conference on Information and Knowledge Management (CIKM’07), Lisbon, Portugal, 6–10 November 2007; ACM: New York, NY, USA, 2007; pp. 61–70. 42. Breiman, L. Random Forests. Mach. Learn.2001,45, 5–32.
43. Deng, H. Interpreting Tree Ensembles with inTrees. arXiv2014, arXiv:1408.5456.
44. Gorskis, H.; Borisov, A. Ontology Building Using Classification Rules and Discovered Concepts. Inf. Technol. Manag. Sci.2015,18, 37.
45. Congalton, R.G. A review of assessing the accuracy of classifications of remotely sensed data.Remote Sens. Environ.1991,37, 35–46.
46. Pontius, R.G.; Millones, M. Death to Kappa: Birth of quantity disagreement and allocation disagreement for accuracy assessment. Int. J. Remote Sens.2011,32, 4407–4429.
47. Stein, A.; Aryal, J.; Gort, G. Use of the Bradley-Terry model to quantify association in remotely sensed images. IEEE Trans. Geosci. Remote Sens.2005,43, 852–856.
49. Rawat, U.; Rawat, J.A Report on Geotechnical Reconnaissance of the Excessive Landsliding in August, 1998 Near Okhimath, Rudraprayag District; U.P. Report; Geological Survey of India: Lucknow, India, 1998.
50. Langlois, R.N. Modularity in technology and organization. J. Econ. Behav. Organ.2002,49, 19–37.
51. Clewley, D.; Bunting, P.; Shepherd, J.; Gillingham, S.; Flood, N.; Dymond, J.; Lucas, R.; Armston, J.; Moghaddam, M. A Python-Based Open Source System for Geographic Object-Based Image Analysis (GEOBIA) Utilizing Raster Attribute Tables.Remote Sens.2014,6, 6111–6135.
52. Belgiu, M.; Lampoltshammer, T.J.; Hofer, B. An Extension of an Ontology-Based Land Cover Designation Approach for Fuzzy Rules. In Proceedings of the Gi_Forum 2013: Creating the Gisociety, Salzburg, Austria, 2 –5 July 2013; Jekel, T., Car, A., Strobl, J., Griesebner, G., Eds.; Austrian Academy of Sciences Press: Salzburg, Austria, 2013; pp. 59–70.
53. Doulaverakis, C.; Tzotsos, A.; Tsampoulatidis, I.; Gerontidis, N.; Argyridis, A.; Karantzalos, K.; Kompatsiaris, I.; Argialas, D. Gnorasi: A modular knowledge-based platform for object-based image analysis. South-East. Eur. J. Earth Obs. Geomat.2014,3, 473476.
54. Blaschke, T.; Hay, G.J.; Kelly, M.; Lang, S.; Hofmann, P.; Addink, E.; Queiroz Feitosa, R.; van der Meer, F.; van der Werff, H.; van Coillie, F.; et al. Geographic Object-Based Image Analysis—Towards a new paradigm.
ISPRS J. Photogramm. Remote Sens.2014,87, 180–191.
55. Addink, E.A.; de Jong, S.M.; Pebesma, E.J. The importance of scale in object-based mapping of vegetation parameters with hyperspectral imagery. Photogramm. Eng. Remote Sens.2007,73, 905–912.

![Table 3. Types of landslides based on Varnes’ classification of slope movements [39].](https://thumb-us.123doks.com/thumbv2/123dok_us/8407332.326978/8.595.228.375.520.622/table-types-landslides-based-varnes-classication-slope-movements.webp)