258
Received: 22 February 2011 Revised: 9 June 2011 Accepted: 19 June 2011 Published online in Wiley Online Library: 28 July 2011
(wileyonlinelibrary.com) DOI 10.1002/jsfa.4569
Sensory profiles of breast meat from broilers
reared in an organic niche production system
and conventional standard broilers
Klaus Horsted,
a
∗
Bodil H Allesen-Holm,
b
John E Hermansen
a
and Anne G Kongsted
a
Abstract
BACKGROUND: Breast meat from broilers produced in very different production systems may vary considerable in sensory profile, which may affect consumer interests. In this study the aim was to evaluate differences in the sensory profiles of breast meat from five broiler products: two conventional standard products (A and B) and three organic niche genotypes (I657, L40 and K8) reared in an apple orchard.
RESULTS: Thirteen out of 22 sensory attributes differed significantly between the products. The aroma attributes ‘chicken’, ‘bouillon’ and ‘fat’ scored highest and the ‘iron/liver’ aroma lowest for the niche products. The meat was more ‘tender’, ‘short’ and ‘crumbly’ and less ‘hard’ and ‘stringy’ in the standard products than in one or more of the niche products. Product ‘I 657’ was less ‘juicy’ than the rest. Products ‘I 657’ and ‘L 40’ were more ‘cohesive’ and tasted more ‘sourish’ and less of ‘sweet/maize’ than the standard products. The ‘overall liking’ score was significantly higher for the ‘K 8’ product than for the ‘Standard A’ and ‘L 40’ products. The ‘overall liking’ score was significantly correlated with the scores for aroma and taste of ‘chicken’, ‘umami/bouillon’, ‘iron/liver’ and ‘fat’ aroma.
CONCLUSION: The sensory profiles differed particularly between conventional standard broilers and organic niche broilers, although differences were also found between breeds. The present study indicates that aroma and taste attributes were more important for the assessors than meat ‘tenderness’ for the overall liking of broiler meat.
c
2011 Society of Chemical Industry
Keywords:aroma; eating quality; organic chicken; sensory panel; taste; texture
INTRODUCTION
In the industrialised world the dominant trend in the food sector for the past 50 years has been an increase in uniformity and efficiency in food production. Lately, however, there has been a growing countervailing trend where consumers show renewed interest in differentiated food products. This differentiation relates to e.g. animal welfare aspects and environmental, food safety and human health considerations, just as locally produced foods and sensory properties of the food are important.1In broiler meat production, France leads the way in differentiated high-quality products, e.g. ‘Bresse-chicken’, ‘G ´eline de Touraine’ and broilers produced under the ‘Label Rouge’ concept.2,3Most other industrialised countries have limited differentiation in high-quality broiler products.
There have only been a few studies on integrated broiler and fruit production in Denmark. The hypothesis behind these studies is that synergy effects can be achieved, since the orchard is assumed to provide a good environment for the broilers, which in turn may benefit from the poultry manure and the controlling of insect pests.4,5However, for broilers to be used as pest controllers requires them to have an active foraging behaviour in the orchard, i.e. they need to be slow-growing as they have proven to be considerably more active in the outdoor area compared with fast-growing broilers.6,7In addition, slow-growing broilers are present
in the orchard for longer owing to their higher slaughter age, which extends their period as pest controllers. In contrast, fast-growing broilers in the conventional broiler industry are often prone to different kinds of health problems such as dermal lesions and gait abnormalities as they have been selected for their growth capacity and consequently are slaughtered at a much younger age.8,9
The production of slow-growing broilers in an alternative production system such as an orchard may result in a product that is quite different from the conventional standard broiler. It has been suggested that the quality of meat from slow-growing broilers reared under free-range conditions, like the ‘Label Rouge’ production system, is more suitably destined for a speciality or gourmet market10,11and is subsequently sold at a premium price,
∗ Correspondence to: Klaus Horsted, Department of Agroecology, Faculty of
Science and Technology, Aarhus University, PO Box 50, DK-8830 Tjele, Denmark. E-mail: [email protected]
a Department of Agroecology, Faculty of Science and Technology, Aarhus University, PO Box 50, DK-8830 Tjele, Denmark
b Department of Food Science – Sensory Science, Faculty of Life Sciences, University of Copenhagen, Rolighedsvej 30, 5th Floor, DK-1958 Frederiksberg C, Denmark
Archived
at
259
which among consumers may lead to the expectation of highermeat sensory quality.12However, very little has been published on the sensory profiling of extensively produced broilers compared with conventional mainstream broiler products. Thus the objective of the present study was to evaluate how the sensory profile of meat from slow-growing broilers produced in an integrated niche system with apple production differed from conventional standard broilers for the different genotypes.
EXPERIMENTAL
Five different broiler products (18 broilers of each) were collected from two different slaughterhouses and used in the present study. A description of the broiler products is given in Table 1. Three of the 18 broilers were randomly chosen for the final sensory assessment. The rest were used during the training sessions (see later). The five products consisted of three niche products and two conventional products. The niche production broilers were reared in an organic apple orchard and differed in breed. The conventional broilers were reared at two different farms and differed only in the amount of maize in the finishing diet (0 vs15% maize). It was decided to include only males in the assessment of the niche broilers, since weight difference between male and female broilers increases with age, and sex has been found to influence the sensory evaluation of broilers close to sexual maturity.5 In contrast, conventionally produced broilers are slaughtered at a much younger age where no sex differences in relation to sensory aspects would be expected.13
Sensory assessment
The sensory assessment was made by a sensory panel with ten assessors selected according to ISO 3972:1991.14It took place in the Sensory Laboratory of the Department of Food Science at the University of Copenhagen and consisted of a pilot study, four
training sessions and the final assessment. In the pilot study a procedure for the cut-out and cooking of the breast meat was established. In addition, a preliminary set of attributes to be used at the training sessions was developed, just as recipes for reference materials were produced. The references were used to enable the panel to become familiar with the sensory attributes and to unify their perception of the specific attributes. Preliminary attributes and reference materials were decided on the basis of previous studies.5,15
Cooking and serving of samples
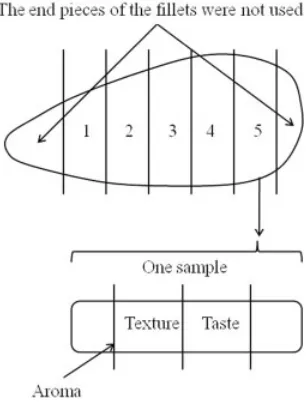
[image:2.595.47.554.478.737.2]The frozen carcasses were thawed in a climatised chamber at 4◦C two days before the samples were served at the training or the assessment. The carcasses were filleted on the same day as they were used and trimmed so that the right and left fillets were of the same size (±2 g). The average weight of the carcasses and trimmed breast fillets for the assessment are given in Table 1. The fillets (with skin) were cooked in preheated fan ovens at 180◦C to a core temperature of 75◦C. The cooking time was calculated on the basis of the weight and height of the fillets. The fillets were served on a 60◦C hot plate 2 min after they were cooked, i.e. the samples were warm at serving. The right and left fillets from a broiler were cut into five slices each (a sample), one for each of the ten assessors. At the training and the assessment it was ensured that each assessor on the panel received the same section of the fillet for each assessment.16 The end pieces were not used. For the assessment it was decided that the samples should be cut transversely from one end and the first cut surface used in relation to the aroma attributes. The next cut of the sample was used for assessing the texture, while the taste was assessed on a cut from the middle of the sample (Fig. 1). Between each assessment the panellists cleared the palate using cucumber, crispbread with a neutral flavour and finally water.
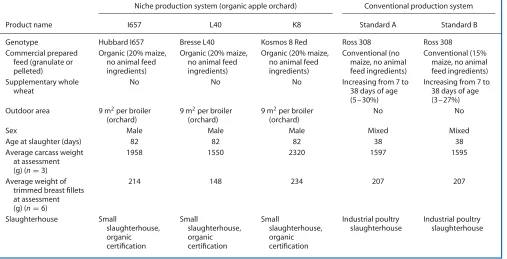
Table 1. Description of broiler products used in present study
Niche production system (organic apple orchard) Conventional production system
Product name I657 L40 K8 Standard A Standard B
Genotype Hubbard I657 Bresse L40 Kosmos 8 Red Ross 308 Ross 308
Commercial prepared feed (granulate or pelleted)
Organic (20% maize, no animal feed ingredients)
Organic (20% maize, no animal feed ingredients)
Organic (20% maize, no animal feed ingredients)
Conventional (no maize, no animal feed ingredients)
Conventional (15% maize, no animal feed ingredients) Supplementary whole
wheat
No No No Increasing from 7 to
38 days of age (5–30%)
Increasing from 7 to 38 days of age (3–27%)
Outdoor area 9 m2per broiler
(orchard)
9 m2per broiler
(orchard)
9 m2per broiler
(orchard)
No No
Sex Male Male Male Mixed Mixed
Age at slaughter (days) 82 82 82 38 38
Average carcass weight at assessment
(g) (n=3)
1958 1550 2320 1597 1595
Average weight of trimmed breast fillets at assessment
(g) (n=6)
214 148 234 207 207
260
Figure 1.Illustration of cutting of breast fillets and samples. Five samples were cut from each breast fillet.
Sensory method
The four training sessions took place on four successive days and were guided by a panel leader (not a member of the panel). Only the panel leader knew which samples were served during the training sessions and the final assessment. At the first training session the procedure relating to ‘smelling’, ‘biting’ and ‘tasting’ was introduced and the assessors were informed about the preliminary attributes and reference materials. Subsequently the assessors were presented with six samples in three pairs. The samples were served in a sensory evaluation laboratory accommodated to meet the demands in ISO 8589:198817and ASTM STP 913.18The differences and similarities between the samples in relation to the set of attributes were discussed in plenum. As a result of the first training session, some of the attributes from the pilot study were changed, just as new words were added to the list, e.g. the taste of ‘umami’ was changed to ‘umami/bouillon’ and, under the texture attributes, ‘elastic-like’ and ‘short’ were added. On the second day of training the panel was presented initially with four samples in pairs, which were discussed in plenum. Subsequently four new samples were served, but this time the assessors were placed in separate booths with no contact with each other. The same procedure was followed on the third day, but with four samples in pairs discussed in plenum and five samples served in the booths. At this session it was decided that the texture attributes ‘hardness’, ‘elastic-like’, ‘tenderness’ and ‘juiciness’ should be evaluated at the fourth chew, whereas ‘short’, ‘crumbly’, ‘stringy’ and ‘cohesive’ should be evaluated when the sample was ready for swallowing. On the fourth day of training the assessors were presented with a sample pair, for which they were told to focus mainly on texture attributes, which were discussed afterwards. Finally, the assessors were presented with 12 samples in the booths. After the final discussion, no changes were made in the set of attributes presented in Table 2. All changes during the training sessions were decided only by the assessors without any influence by the panel leader.
The assessment took place on three successive days and each broiler product was served on each day, i.e. three replications were used. The serving order on each day was randomised by a Latin-square method.16,19The assessors were placed in separate
booths and, for each sample, each attribute was evaluated on a 15 cm unstructured line scale, with 15 as the highest score and 0 as the lowest. The anchor points for all attributes were ‘none’ on the left side and ‘extreme’ on the right side.19 – 21Data were collected electronically using FIZZ Network Acquisition Version 2.40 E.22In addition to the objective assessment of attributes, the assessors were asked to give a subjective preference score of ‘overall liking’ for each sample assessment of the products.
Statistical methods
For the statistical analysis, ‘PROC MIXED’ in SAS Version 9.123 was used. The analysis included five products, i.e. three niche products (I657, L40 and K8) and two conventional standard products (Standards A and B). In the statistical model, ‘product’ was defined as a fixed effect and ‘replication’, ‘assessor’, ‘replication× assessor’ and ‘replication×product’ were random effects. Data were found to be normally distributed. The sensory data were additionally subjected to principal component analysis (PCA) using PanelCheck Version 1.2.1.24This program was also used for the detection of outliers in the raw data. In addition, a calculation of PCA models in the program FIZZ Calculation was used as a guideline for outlier removal.22One assessor had difficulties with one attribute and another assessor with two. In these cases, data were replaced by the average for the rest of the panel as suggested by Hooet al.25
RESULTS
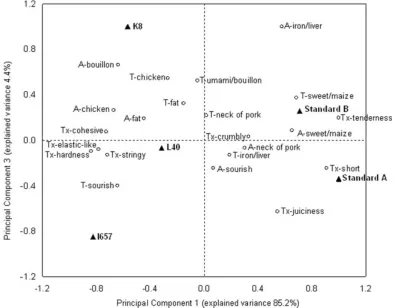
To visualise relationships between attributes and the products tested, results from the PCA are given in Figs 2 and 3. Terms close together are related. Terms far away from each other are different. Principal component 1 (PC1) is the horizontal axis in both figures and is the main source of variance with an explained variance of 85.2%. Principal component 2 (PC2) is the vertical axis in Fig. 2 and principal component 3 (PC3) is the vertical axis in Fig. 3. As indicated by Figs 2 and 3, there is a huge difference in the sensory profile between especially the standard and the niche products, being on opposite sides of the PC1 axis. Even though Fig. 2 indicates a large vertical difference (PC2) between ‘I 657’ and ‘L 40’ and Fig. 3 indicates a large difference (PC3) between ‘I 657’ and ‘K8’, the explained variance is only 7.8 and 4.4% for PC2 and PC3 respectively. Thus the differences between the standard products and the niche products are much more pronounced than the differences between the niche products themselves.
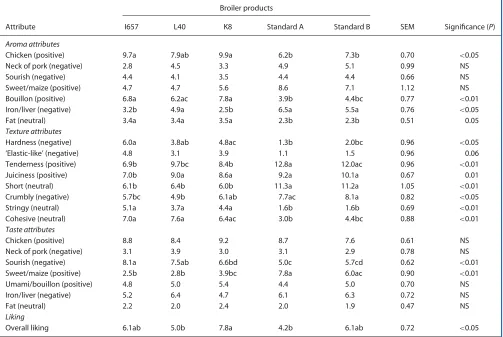
Results from the analysis of variance are given in Table 3. Aroma attributes differed significantly for four out of seven attributes between types of chicken product. The positive aroma attributes ‘chicken’ and ‘bouillon’ were significantly more pronounced in ‘I 657’ and ‘K 8’ than in the standard products, and ‘bouillon’ scored significantly higher in ‘L 40’ than in ‘Standard A’. The score for the negative attribute ‘iron/liver’ was significantly lower for ‘I 657’ and ‘K 8’ than for the other products. In addition, the two standard products had a significantly less pronounced aroma of the neutral attribute ‘fat’ than the niche products.
261
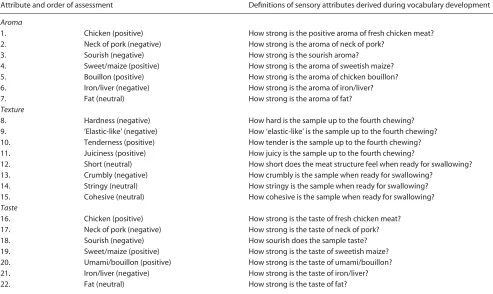
Table 2. Final reference schedule used for sensory assessmentAttribute and order of assessment Definitions of sensory attributes derived during vocabulary development
Aroma
1. Chicken (positive) How strong is the positive aroma of fresh chicken meat?
2. Neck of pork (negative) How strong is the aroma of neck of pork?
3. Sourish (negative) How strong is the sourish aroma?
4. Sweet/maize (positive) How strong is the aroma of sweetish maize?
5. Bouillon (positive) How strong is the aroma of chicken bouillon?
6. Iron/liver (negative) How strong is the aroma of iron/liver?
7. Fat (neutral) How strong is the aroma of fat?
Texture
8. Hardness (negative) How hard is the sample up to the fourth chewing?
9. ’Elastic-like’ (negative) How ‘elastic-like’ is the sample up to the fourth chewing?
10. Tenderness (positive) How tender is the sample up to the fourth chewing?
11. Juiciness (positive) How juicy is the sample up to the fourth chewing?
12. Short (neutral) How short does the meat structure feel when ready for swallowing?
13. Crumbly (negative) How crumbly is the sample when ready for swallowing?
14. Stringy (neutral) How stringy is the sample when ready for swallowing?
15. Cohesive (neutral) How cohesive is the sample when ready for swallowing?
Taste
16. Chicken (positive) How strong is the taste of fresh chicken meat?
17. Neck of pork (negative) How strong is the taste of neck of pork?
18. Sourish (negative) How sourish does the sample taste?
19. Sweet/maize (positive) How strong is the taste of sweetish maize?
20. Umami/bouillon (positive) How strong is the taste of umami/bouillon?
21. Iron/liver (negative) How strong is the taste of iron/liver?
22. Fat (neutral) How strong is the taste of fat?
The standard products had a significantly higher score for the positive attribute ‘tenderness’ than the niche products, although ‘L 40’ only differed significantly from ‘Standard A’. For the positive attribute ‘juiciness’, ‘I 657’ was significantly less juicy than the other products. The assessors found that the meat structure felt significantly ‘shorter’ (neutral) in the standard products, just as these were less ‘stringy’ (neutral). The negative attribute ‘crumbly’ was significantly more pronounced in the ‘Standard B’ product than in ‘I 657’ and ‘L40’, and ‘L 40’ was less ‘crumbly’ than ‘Standard A’. The assessors found the standard products significantly less cohesive (neutral) than the niche products, except for ‘K 8’ that only differed significantly in relation to ‘Standard A’.
The taste attributes differed significantly between products in relation to the negative attribute ‘sourish’ and the positive attribute ‘sweet/maize’. Thus ‘I 657’ was significantly more ‘sourish’ than ‘K 8’ and the two standard products, ‘L 40’ significantly more ‘sourish’ than the standard products, and ‘K 8’ more ‘sourish’ than ‘Standard A’. The standard products tasted significantly more of ‘sweet/maize’ than ‘I 657’ and ‘L40’, whereas ‘K 8’ only tasted significantly less of ‘sweet/maize’ in relation to ‘Standard A’.
In relation to the subjective ‘overall liking’ category, the assessors gave a higher score for the ‘K 8’ product. This was statistically significant in relation to the ‘L 40’ and ‘Standard A’ products. An indication of which attributes mainly influenced ‘overall liking’ can be found in Table 4, where significant correlations between ‘overall liking’ and sensory attributes are given. The attributes given in Table 4 are related to the aroma and taste of the products, whereas no texture attributes were significantly correlated with ‘overall liking’.
DISCUSSION
Several factors such as breed, age at slaughter, diet, outdoor access and housing conditions were very different between the niche and standard broilers in the present study, which resulted in very different sensory profiles of these products as indicated by Figs 2 and 3. In contrast, Fanaticoet al.26found that a sensory panel was able to detect only very few significant differences in the sensory profiles between slow- and fast-growing broilers reared in production systems with or without outdoor access. However, the fast-growing broilers in that study were slaughtered at 63 days of age, whereas in our study the fast-growing broilers (Standards A and B) were slaughtered at 38 days of age. Other studies have shown that poultry meat characteristics are influenced by factors such as age,15,27feed28and genotype, with the latter covering e.g. growth rate, body composition and locomotor activity.6,15,29 – 32 In the present study especially the texture attributes were significantly influenced as a consequence of the very different production characteristics of the standard and niche products. The fact that the breast meat from the standard broilers is tenderer with a ‘shorter’ fibre structure is consistent with other studies showing that younger birds have tenderer meat.33,34However, some studies on slow-growing broilers indicate that certain breeds can have a different development in meat tenderness when age at slaughter is close to sexual maturity.5,15
262
Figure 2.PCA correlation loadings plot of principal component 1versusprincipal component 2:, product names;
◦
, attributes (A, aroma; Tx, texture; T, taste). [image:5.595.102.497.402.710.2]263
Table 3. Scores as least square means, standard error of mean (SEM) and significance for aroma, texture and taste attributesBroiler products
Attribute I657 L40 K8 Standard A Standard B SEM Significance (P)
Aroma attributes
Chicken (positive) 9.7a 7.9ab 9.9a 6.2b 7.3b 0.70 <0.05
Neck of pork (negative) 2.8 4.5 3.3 4.9 5.1 0.99 NS
Sourish (negative) 4.4 4.1 3.5 4.4 4.4 0.66 NS
Sweet/maize (positive) 4.7 4.7 5.6 8.6 7.1 1.12 NS
Bouillon (positive) 6.8a 6.2ac 7.8a 3.9b 4.4bc 0.77 <0.01
Iron/liver (negative) 3.2b 4.9a 2.5b 6.5a 5.5a 0.76 <0.05
Fat (neutral) 3.4a 3.4a 3.5a 2.3b 2.3b 0.51 0.05
Texture attributes
Hardness (negative) 6.0a 3.8ab 4.8ac 1.3b 2.0bc 0.96 <0.05
‘Elastic-like’ (negative) 4.8 3.1 3.9 1.1 1.5 0.96 0.06
Tenderness (positive) 6.9b 9.7bc 8.4b 12.8a 12.0ac 0.96 <0.01
Juiciness (positive) 7.0b 9.0a 8.6a 9.2a 10.1a 0.67 0.01
Short (neutral) 6.1b 6.4b 6.0b 11.3a 11.2a 1.05 <0.01
Crumbly (negative) 5.7bc 4.9b 6.1ab 7.7ac 8.1a 0.82 <0.05
Stringy (neutral) 5.1a 3.7a 4.4a 1.6b 1.6b 0.69 <0.01
Cohesive (neutral) 7.0a 7.6a 6.4ac 3.0b 4.4bc 0.88 <0.01
Taste attributes
Chicken (positive) 8.8 8.4 9.2 8.7 7.6 0.61 NS
Neck of pork (negative) 3.1 3.9 3.0 3.1 2.9 0.78 NS
Sourish (negative) 8.1a 7.5ab 6.6bd 5.0c 5.7cd 0.62 <0.01
Sweet/maize (positive) 2.5b 2.8b 3.9bc 7.8a 6.0ac 0.90 <0.01
Umami/bouillon (positive) 4.8 5.0 5.4 4.4 5.0 0.70 NS
Iron/liver (negative) 5.2 6.4 4.7 6.1 6.3 0.72 NS
Fat (neutral) 2.2 2.0 2.4 2.0 1.9 0.47 NS
Liking
Overall liking 6.1ab 5.0b 7.8a 4.2b 6.1ab 0.72 <0.05
Scores in a row not sharing a common letter are significantly different (P<0.05). NS, not significant.
Table 4. Pearson correlation coefficients between ‘liking’ and attributes (based on average value obtained by each assessor,n=15)
Positive correlations Negative correlations
Attribute Coefficient Significance (P) Attribute Coefficient Significance (P)
Aroma, chicken 0.800 <0.001 Aroma, iron/liver −0.676 <0.01
Taste, chicken 0.796 <0.001 Taste, iron/liver −0.569 <0.05
Taste, umami/bouillon 0.691 <0.01 Aroma, neck of pork −0.497 0.06
Aroma, bouillon 0.643 <0.01
Aroma, fat 0.528 <0.05
positive score as the other niche products, as it was considerably slower-growing and had probably not reached sexual maturity. However, it should also be borne in mind that this breed was given the same feed type as the other niche broilers, and, owing to its slower growth, this breed might have had different dietary requirements. Interactions between feed and breed in relation to sensory attributes of breast meat have been found in another study.15 The ‘Bresse-chicken’ is a broiler product produced in France and uses a similar breed to ‘L40’. It is known to be produced with special consideration to the feed allocated and has to have access to an outdoor area with vegetation. This together with the processing of the carcass produces broiler products with reputable meat qualities.2
[image:6.595.48.550.471.567.2]264
and ‘bouillon (umami/bouillon)’ (Table 4). The positive attributes aroma and taste of ‘chicken’ and ‘bouillon (umami/bouillon)’ are, in turn, closely correlated with the ‘K 8’ product, whereas the negative aroma and taste of ‘iron/liver’ is not (Figs 2 and 3). Thus the ‘K 8’ product was given the most favourable scores for these attributes compared with the other products, even though only significantly different for aroma as indicated by Table 3. Surprisingly, ‘tenderness’ did not seem to be the most important attribute when scoring the liking for the different products. However, all products were given relatively high scores for ‘tenderness’, i.e. the meat was not considered as ‘tough’ in any of the cases, despite significant differences. In fact, it may be hypothesised that meat actually can be too tender, even though it is considered a positive attribute.
In this context it should be realised that a sensory panel is not comparable to a consumer preference study, since the assessors in our study were selected according to the ISO14and completed a thorough training course to define product attributes and to unify their perception of the specific attributes.37However, normally only relatively few product traits such as ‘appearance’, ‘texture’, ‘flavour’ and ‘juiciness’ are assessed in consumer studies, and texture and tenderness, in particular, seem to be crucial consumer attributes. Therefore a consumer test might have achieved liking scores not comparable to those in the present study. Thus consumers often prefer the things they are familiar with, and it has been suggested that long-term exposure to conventional broiler meat may be an obstacle to the liking of meat from other broiler products.38However, a study by Ponteet al.39indicates that, even for a 30-person consumer panel, meat tenderness may not be the only important attribute when differences in overall liking are to be found. In addition, other factors such as geographical and cultural origins of the consumer can be expected to influence consumer preference for different qualities of food products,40just as other quality dimensions such as locally produced food, animal welfare, environment, etc. may influence consumer perception.1
In conclusion, there was a huge difference in the sensory profile of breast meat between the niche and standard broilers in our study, just as we found a small difference between the genotypes used in the niche system. The significant correlations between ‘overall liking’ and the aroma and taste of ‘chicken’, ‘umami/bouillon’ and ‘iron/liver’ indicate that differences in meat tenderness may not be the most important attribute for overall liking of broiler meat products, since broiler breast meat in general is considered as tender.
In future studies there is a need to generate more information on the sensory profile of thigh and drumstick, since higher kinetic activity in slow-growing broilers might influence the sensory profile of especially the leg muscles as a consequence of different muscle structures.
REFERENCES
1 Yiridoe EK, Bonti-Ankomah S and Martin RC, Comparison of consumer
perceptions and preference toward organicversusconventionally
produced foods: a review and update of the literature.Renew Agric
Food Syst20:193–205 (2005).
2 Verrier E, Tixier-Boichard M, Bernigaud B and Naves M, Conservation and value of local livestock breeds: usefulness of niche products
and/or adaptation to specific environments.Anim Genet Resour
Inform36:21–31 (2005).
3 Ba ´eza E, Chartrin P, Meteau K, Bordeau T, Juin H, Le Bihan-Duval E,
et al, Effect of sex and genotype on carcass composition and
nutritional characteristics of chicken meat.Br Poultry Sci51:344–353
(2010).
4 Pedersen HL, Olsen A, Horsted K, Korsgaard M and Pedersen B,
Combined production of broilers and fruits.11th Int. Conf. on
Cultivation Technique and Phytopathological Problems in Organic Fruit-growing, Weinsberg, pp. 131–136 (2004).
5 Horsted K, Henning J and Hermansen JE, Growth and sensory characteristics of organically reared broilers differing in strain, sex
and age at slaughter.Acta Agric Scand55:149–157 (2005).
6 Nielsen BL, Thomsen MG, Sørensen P and Young JF, Feed and strain
effects on the use of outdoor areas by broilers. Br Poultry Sci
44:161–169 (2003).
7 Dal Bosco A, Mugnai C, Sirri F, Zamparini C and Castellini C,
Assessment of a global positioning system to evaluate activities
of organic chickens at pasture. J Appl Poultry Res 19:213–218
(2010).
8 Sørensen P, Su G and Kerstin SC, Effects of age and stocking density
on leg weakness in broiler chickens.Poultry Sci79:864–870 (2000).
9 Bokkers EAM and Koene P, Behaviour of fast- and slow-growing
broilers to 12 weeks of age and the physical consequences.Appl
Anim Behav Sci81:59–72 (2003).
10 Lewis PD, Perry GC, Farmer LJ and Patterson RLS, Responses of two genotypes of chicken to the diets and stocking densities typical of UK and ‘Label Rouge’ production systems: I. Performance, behaviour
and carcass composition.Meat Sci45:501–516 (1997).
11 Westgren RE, Delivering food safety, food quality, and sustainable
production practices: the Label Rouge poultry system in France.Am
J Agric Econ81:1107–1111 (1999).
12 Harper GC and Makatouni A, Consumer perception of organic food
production and farm animal welfare.Br Food J104:287–299 (2002).
13 Poste LM, Butler G, Cave NA and Burrows VD, Sensory analysis of meat
from broiler chickens fed diets containing hulless oats (Avena nuda).
Can J Anim Sci76:313–319 (1996).
14 ISO, Sensory Analysis – Methodology – Method of Investigating
Sensitivity of Taste. ISO 3972 : 1991 (E), International Organization for Standardization, Geneva (1991).
15 Horsted K, Allesen-Holm BH and Hermansen JE, The effect of breed and feed-type on the sensory profile of breast meat in male broilers
reared in an organic free-range system.Br Poultry Sci51:515–524
(2010).
16 ASTM,Standard Guide for Serving Protocol for Sensory Evaluation of
Foods and Beverages. ASTM E1871-06, American Society for Testing and Materials, West Conshohocken, PA (2006).
17 ISO,Sensory Analysis – General Guidance for the Design of Test Rooms.
ISO 8589 : 1988 (E), International Organization for Standardization, Geneva (1988).
18 ASTM, Physical Requirements. Guidelines for Sensory Evaluation
Laboratories. ASTM STP 913, American Society for Testing and Materials, West Conshohocken, PA (1986).
19 ISO, Sensory Analysis – General Guidance for Establishing a Sensory
Profile. ISO 13299 : 2003 (E), International Organization for Standardization, Geneva (2003).
20 ISO, Sensory Analysis – General Guidance for the Selection, Training
and Monitoring of Assessors. ISO 8586-1 : 1993 (E), International Organization for Standardization, Geneva (1993).
21 Meilgaard M, Civille GV and Carr BT, Measuring responses, inSensory
Evaluation Techniques(4th edn), ed. by. CRC Press, Boca Raton, FL, pp. 43–57 (2007).
22 Biosyst `emes,FIZZ Software Solution for Sensory Analysis and Consumer
Tests [Online]. Available: http://www.biosystemes.com/data-collection,fizz-network.php [1 October 2010].
23 Littell RC, Milliken GA, Stroup WW and Wolfinger RD,SAS System for
Mixed Models. SAS Institute, Cary, NC (1996).
24 Matforsk AS, The PanelCheck Project [Online]. Available:
http://www.panelcheck.com/ [1 October 2010].
25 Hoo KA, Tvarlapati KJ, Piovoso MJ and Hajare R, A method of robust
multivariate outlier replacement. Comput Chem Eng 26:17–39
(2002).
26 Fanatico AC, Pillai PB, Emmert JL, Gbur EE, Meullenet JF and
Owens CM, Sensory attributes of slow- and fast-growing chicken
genotypes raised indoors or with outdoor access. Poultry Sci
86:2441–2449 (2007).
27 Sonaiya EB, Ristic M and Klein FW, Effect of environmental
temperature, dietary energy, age and sex on broiler carcase portions
and palatability.Br Poultry Sci31:121–128 (1990).
28 Lyon BG, Smith DP, Lyon CE and Savage EM, Effects of diet and feed withdrawal on the sensory descriptive and instrumental profiles of
265
29 Ricard FH, Leclercq B and Touraille C, Selecting broilers for low and high abdominal fat: distribution of carcass fat and quality of meat.
Br Poultry Sci24:511–516 (1983).
30 Chambers JR, Fortin A, Mackie DA and Larmonde E, Comparison of sensory properties of meat from broilers of modern stocks and
experimental strains differing in growth and fatness.Can Inst Food
Sci Technol J22:353–358 (1989).
31 Lei S and Van Beek G, Influence of activity and dietary energy on
broiler performance, carcase yield and sensory quality.Br Poultry Sci
38:183–189 (1997).
32 Dyubele NL, Muchenje V, Nkukwana TT and Chimonyo M, Consumer sensory characteristics of broiler and indigenous
chicken meat: a South African example. Food Qual Prefer 21:
818–819 (2010).
33 Touraille C, Kopp J, Valin C and Ricard FH, Chicken meat quality. 1. Influence of age and growth rate on physico-chemical and sensory
characteristics of the meat.Arch Gefl¨ugelkd45:69–76 (1981).
34 Touraille C, Ricard FH, Kopp J, Valin C and Leclercq B, Chicken meat quality. 2. Changes with age of some physico-chemical and sensory
characteristics of the meat.Arch Gefl¨ugelkd45:97–104 (1981).
35 Yang N and Jiang R-S, Recent advances in breeding for quality
chickens.World Poultry Sci J61:373–381 (2005).
36 Brown SN, Nute GR, Baker A, Hughes SI and Warriss PD, Aspects of meat and eating quality of broiler chickens reared under standard,
maize-fed, free-range or organic systems.Br Poultry Sci49:118–124
(2008).
37 Murray JM, Delahunty CM and Baxter I, Descriptive sensory analysis:
past, present and future.Food Res Int34:461–471 (2001).
38 Castellini C, Berri C, Le Bihan Duval E and Martino G, Qualitative attributes and consumer perception of organic and free-range
poultry meat.World Poultry Sci J64:500–512 (2008).
39 Ponte PIP, Rosado CMC, Crespo JP, Crespo DG, Mour ˜ao JL,
Chaveiro-Soares MA,et al, Pasture intake improves performance and meat
sensory attributes of free-range broilers.Poultry Sci87:71–79 (2008).
40 Berri C, Variability of sensory and processing qualities of poultry meat.