Mobile User Satisfaction
by
Setia Budi, MComp
Written under supervision of
Dr Vishv Malhotra
A dissertation submitted to the School of Computing and Information System
in partial fulfillment of the requirements for the degree of
Master of Computing
UNIVERSITY
OF
TASMANIA
Declaration
This thesis contains no material which has been accepted for the award of any other degree or diploma in any tertiary institution, and that, to my knowledge and belie the thesis contains no material previously published or written by another person except where due reference is made in the text of the thesis.
Signed
Abstract
Mobile devices have become more and more popular, and the services have grown in number and range. Ready access to the Internet is one of the characteristics of mobile devices which delivers significant value for their users. However, the users are also concerned about costs and other factors related to this access. This research tries to explore the trade-off between the desirable and the undesirable outcomes of data access to find out if it is possible to maintain the mobile user's satisfaction derived from the connectivity attributes for a single data-transfer task while lowering the concerns that come from the other issues, including cost of the access and battery life of the device. A simulation study is used in this research to determine if it is feasible to conduct such a trade-off
Acknowledgements
First, I would like to express my gratitude to Australian Development Scholarship which has given me a great opportunity to do a higher education in Australia. Study abroad was the thing that never comes up on my mind before and this scholarship program has opened a new window in my life to see, experience, and learn in an international environment.
Let me also express my great appreciation to my supervisor, Dr Vishv Malhotra. It was only because of his guidance I was able to complete this thesis, without him it would not have been possible. Research was a new thing when I was starting this honours work, and a good supervision is essential. I did really enjoy when I was working with him. It was a great honour for me to work with him and I do really hope that someday in the future I can be able to work with him again.
My housemates deserve my gratitude next. Thanks to Kim Yoonlcyotmg (Annette), Choi Kyungjin (Kelly), Kenny Soetjipto, and Kim Jaeyoon for all of your support while I was working on this thesis. All of you are like my own family in this beautiful island of Tasmania. Living in a healthy and friendly environment is a blessing for me and I do really appreciate it.
Table of Contents
Declaration
Abstract ii
Acknowledgements iii
Table of Contents iv-1
List of Figures v-1
List of Tables vi
Chapter 1 Introduction 1-1
1.1 Background 1-1
1.2 Motivation 1-2
1.3 Problem Description 1-2
1.4 Hypothesis 1-3
1.5 Plan to Prove the Hypothesis 1-4
1.6 Significance of the Study 1-4
1.7 Structure 1-4
1.8 Chapter Summary 1-5
Chapter 2 Literature Review 2-1
2.1 Introduction 2-1
2.2 Mobile Devices 2-2
2.3 Mobile Internet 2-4
2.3.1 Wireless Local Area Network (WLAN) 2-5
2.3.2 Cellular Data Network 2-8
2.3.3 Pricing 2-11
2.4 Mobile User 2-12
2.4.1 Mobile User Behaviour: Device-Network Interaction Pattern 2-13 2.4.2 Mobile Internet User Satisfaction Factors 2-17
2.5 Multi-Objective Optimisation Problems 2-18
2.5.1 Concept of Domination 2-22
2.5.2 Pareto optimal 2-25
2.6 Evolutionary Algorithms in Multi-Objective Optimisation Problem 2-26
2.6.1 NSGA 2-28
2.6.2 NSGA II 2-30
2.7 Chapter Summary 2-31
Chapter 3 Methodology 3-1
3.1 Need for Multiple Objectives 3-1
3.2 Related Study 3-1
3.3 Multi-objective Optimisation Problem 3-2
3.4 Approaches for Satisfaction Comparison 3-3
3.4.1 Aggregating Approach 3-3
3.4.2 Lexicographic Ordering Approach 3-5
3.4.3 Pareto Based Approach 3-6
3.5 Simulation Model 3-8
3.5.1 Decision Variables 3-8
3.5.2 Objective Functions 3-9
3.5.3 Constraints 3-16
3.6 Evolutionary Algorithms: NSGA II 3-17
Table of Contents
3.8 Simulation Scenario 3-19
3.9 Chapter Summary 3-20
Chapter 4 Experimental Evaluation 4-1
4. 1. Introduction 4-1
4. 2. Scenario 1 4-2
4.2.1 Case 1 4-4
4.2.2 Case 2 4-7
4.2.3 Case 3 4-9
4.2.4 Case 4 4-11
4.3 Scenario 2 4-13
4.3.1 Case 1 4-15
4.3.2 Case 2 4-17
4.3.3 Case 3 4-19
4.3.4 Case 4 4-21
4.4 Scenario 3 4-23
4.4.1 Case 1 4-25
4.4.2 Case 2 4-28
4.4.3 Case 3 4-30
4.4.4 Case 4 4-32
4.5 Scenario 4 4-34
4.5.1 Case 1 4-37
4.5.2 Case 2 4-40
4.5.3 Case 3 4-42
4.5.4 Case 4 4-44
4.6 Chapter Summary 4-46
Chapter 5 Summary, Conclusions and Future Works 5-1
5.1 Summary 5-1
5.2 Conclusions 5-2
5.3 Future Works 5-2
Reference List vii-1
List of Figures
Figure 2.1 Personal communication-device/mobile-device characteristics 2-4
Figure 2.2 Cellular mobile networks evolution 2-10
Figure 2.3 Time of mobile Internet access daily usage 2-14 Figure 2.4 The effect of network types on mobile Internet usage 2-15
Figure 2.5 Low response on platform mobile mail 2-17
Figure 2.6 Key components in Evolutionary Algorithms (EA) 2-28
Figure 2.7 NSGA Pseudocode 2-29
Figure 2.8 NSGA II Pseudocode 2-30
Figure 3.1 NSGA II Pseudocode 3-18
Figure 4.1 Access Parameters for Scenario 1 Case 1 4-5
Figure 4.2 Pareto Set and Pareto Front for Scenario 1 Case 1 4-5
Figure 4.3 Access Parameters for Scenario 1 Case 2 4-7
Figure 4.4 Pareto Set and Pareto Front for Scenario 1 Case 2 4-8
Figure 4.5 Access Parameters for Scenario 1 Case 3 4-9
Figure 4.6 Pareto Set and Pareto Front for Scenario 1 Case 3 4-10
Figure 4.7 Access Parameters for Scenario 1 Case 4 4-11
Figure 4.8 Pareto Set and Pareto Front for Scenario 1 Case 4 4-12
Figure 4.9 Access Parameters for Scenario 2 Case 1 4-15
Figure 4.10 Pareto Set and Pareto Front for Scenario 2 Case 1 4-16 Figure 4.11 Access Parameters for Scenario 2 Case 2 4-17 Figure 4.12 Pareto Set and Pareto Front for Scenario 2 Case 2 4-18
List of Tables
Table 2.1 Comparisons of the IEEE 802.11 family 2-8
Table 2.2 Comparison of the Internet access cost in Australia 2-11 Table 2.3 Composite priority weights for mobile user requirements — satisfaction
factors 2-18
Table 3.1 Price comparison of the Internet access in Australia 3-20
Table 4.1 Resource Types for Scenario 1 4-2
Table 4.2 Resource Availability Schedule for Scenario 1 4-3
Table 4.3 Power Outlet Availability for Scenario 1 4-4
Table 4.4 Experiment Cases for Scenario 1 4-4
Table 4.5 Resource Types for Scenario 2 4-13
Table 4.6 Resource Availability Schedule for Scenario 2 4-14
Table 4.7 Power Outlet Availability for Scenario 2 4-14
Table 4.8 Experiment Cases for Scenario 2 4-15
Table 4.9 Resource Types for Scenario 3 4-23
Table 4.10 Resource Availability Schedule for Scenario 3 4-24 Table 4.11 Power Outlet Availability for Scenario 3 4-24
Table 4.12 Experiment Cases for Scenario 3 4-25
Table 4.13 Resource Types for Scenario 4 4-34
Table 4.14 Resource Availability Schedule for Scenario 4 4-36 Table 4.15 Power Outlet Availability for Scenario 4 4-37
Table 4.16 Experiment Cases for Scenario 4 4-37
Chapter 1
Introduction
1.1 Background
Nowadays, mobile devices have become more and more popular, and the services have grown in number and range. BBC News reports that at the moment (October 2012) there are around six billion mobile phone subscriptions in the world (BBC 2012). CNET News also reports that recently, Google Play Store reached their 25 billionth download (CNET 2012). In the context of Australian mobile users, there is an interesting report which mentions that the mobile Internet usage in Australia is increasing rapidly and people are concerned about the higher Internet costs that they might have to pay (The Age 2012).
A mobile device is a Personal Communication Device (PCD), which means, in general a mobile device belongs to only one person and it is personally identifiable. The person who owns the device will carry it almost all the time or for a significant portion of time. As a communication tool, a mobile device can connect to a communication network in various ways to send and receive different forms of messages. A mobile device is also a handheld device. The device can be operated using a single hand, two hands, or a hand with a surface. In addition, mobile devices can provide an 'always on' experience to the users. A mobile device can be awakened quickly by a single touch of the user or by the communication network. A mobile device can receive a new text message any time, even when the device is in the sleep or standby mode (Ballard 2007).
Internet without necessarily interrupting their current activity. By using mobile Internet access, the users can get Internet access while they are having dinner at a restaurant, watching TV in the living room, or lying in their bedroom (Cui & Roto 2008).
1.2 Motivation
Ready access to the Internet is one of the characteristics of mobile devices which delivers significant value for their users. However, the users are also concerned about the costs and other factors related to this access. This research tries to explore the trade-off between the desirables and the undesirables to find out if it is possible to maintain mobile user satisfaction derived from the connectivity attributes for a single data-transfer task while lowering the concerns that come from other issues including the access cost and battery usage. A simulation study is used in this research to determine if it is feasible to conduct such a trade-off
1.3 Problem Description
There are many factors that can influence the users' satisfaction in terms of the usage of the mobile devices for data transfer; for example, how much money users have to spend to transfer the data through the mobile Internet connection using the available data carrier, how critical or how valuable the data which is required to be transmitted is in terms of time span, the battery power consumption to make a mobile Internet connection using the available network carrier and how it will affect the remaining battery life, and finally, how the remaining battery life will affect the future opportunity value for the user of being able to
utilise the mobile device without having any issue as a result of a flat battery. Moreover, the optimum level of mobile user satisfaction cannot be achieved by only focusing on optimising a single satisfaction factor and ignoring the rest. The problem in optimising the mobile Internet user satisfaction can be studied as a multi-objective optimisation problem, since there are several conflicting objectives required to be optimised simultaneously (Bui et aL 2008; Deb 2009; Coello et aL 2007; Jones 1998; Goldberg 1989). Each satisfaction factor can be treated as an objective that needs to be optimised. Since it is nearly
impossible to have a single solution that can optimise all the objectives, the focus in multi-objective optimisation is in searching for a set of optimum solutions.
As described previously in this section, user satisfaction has many origins in terms of access to a range of quality features and functions available on the mobile device. The user's ability to use the features economically and effectively is essential and it will support the use of the device more often and to a higher degree/level
The actual use of the mobile device is also limited by the data connectivity and power source availability. The mobile device becomes less useful without data connectivity and is rendered completely useless without the battery power.
1.4 Hypothesis
In order to provide a clear direction for this study, a hypothesis is introduced:
"It is possible to improve mobile user's satisfaction for a single data-transfer task by controlling transmission related decisions"
The hypothesis is based on an assumption that for a typical mobile device, other actors, apart from the connectivity attributes, are less amenable to change as they are often fixed by the choice of the hardware and related software platform. Some example of connectivity factors are:
1. Mobile Internet technology such as Wireless Local Area Network (WLAN) and ceThilar data networks
2. Cost of mobile data usage 3. Data rate or speed of access 4. Network availability
5. The utility value of data transfer
1.5 Plan to Prove the Hypothesis
In order to prove the hypothesis, first a mathematical model is constructed to formalise the mobile user's concerns and benefits related to the data connectivity features. Afterward, this model is used to provide support for the mobile user in decision making related to the data transfer in an optimised way.
1.6 Significance of the Study
A successful execution of this study may produce a computation support system that could be able to assist the users when they are making a decision related to the data transfer from their mobile device. Users can make an effective and economical decision about the data transfer based on the list of possible decision-outcome tuples produced with the assistance of the computation support system. The users' concern related to access cost can be lowered without sacrificing some other connectivity attributes that may also influence the satisfaction of the users such as battery life and network availability. The results also have applications in other areas and problems.
1.7 Structure
This thesis is organised as follows:
• Chapter 2 presents a review of the literature which is used to provide a solid basis for this study. There are five areas covered in this chapter, which are mobile device characteristics, mobile Internet characteristics, mobile users' characteristics including their behaviours, the multi-objective optimisation problems, and the evolutionary algorithms in multi-objective optimisations problems.
• Chapter 3 provides an in-depth explanation of the methodology which is used in this study. This chapter covers several key points such as the need of multiple objectives in this research, related studies that have been conducted, the multi-objective optimisation problem, several possible approaches for satisfaction
comparison, the simulation model which is used in this study, evolutionary algorithms for multi-objective optimisation problem, and jMetal framework as the building blocks to construct the simulation model
• Chapter 4 describes several details of the experiment as the main part of the simulation study including its findings In this chapter several scenarios and cases of data transmission will be presented. In total, there are four different scenarios and four different cases within each scenario. These scenarios and cases are built in order to understand how the selection of decision variables in data transmission influences the overall user satisfliction.
• Finally, chapter 5 concludes this thesis and presents several possible future directions related to this study.
1.8 Chapter Summary
A brief introduction to my Master thesis proposal is presented in this chapter in order to give a general idea to the readers about the research This chapter is started with the background section which describes the current trends of mobile devices followed by an overview of mobile device characteristics and mobile Internet user. In the motivation section, a general idea of this study is clearly stated followed by the problem description section. In this section, a brief description of the problem which is going to be solved in this study is presented. A clear statement of the hypothesis which is used as the main guidance in this study is also provided in the hypothesis section followed by a general plan to prove the hypothesis. An overview of the structure in this thesis is described in the structure section in order to give a general idea about how the paper is organised.
Chapter 2
Literature Review
2.1 Introduction
In order to get a firm foundation for this research, a literature review has been conducted. There are five areas covered in this literature review chapter and they will be presented in five different sections, namely mobile devices, mobile Internet, mobile users, multi-objective optimisation problems, and evolutionary algorithms in multi-objective optimisations problems.
The first two sections are focused on mobile technology. These sections are motivated to find the nature of mobile devices and several communication technologies which are available in mobile environment including their cost and speed implications. In the mobile devices section, several key characteristics of mobile devices will be presented. This section is followed by the mobile Internet section where several key characteristics of mobile Internet will be identified. In this section, two main technologies in mobile Internet will also be presented.
The mobile users section will examine key characteristics of mobile users including their behaviours. Several factors that might influence their satisfaction when they are using their devices will also be identified.
The last two sections are related to the optimisation techniques especially in relation to the multi-objective situations. In the multi-objective optimisation problems section, several key concepts related to the problems in multiple objectives optimisation are introduced, and finally, in the last section, evolutionary algorithm as an approach to address the
multi-objective optimisation problem is explored. Some examples of evolutionary algorithms which are commonly used in multi-objective optimisation problems are also presented in this section.
2.2 Mobile Devices
Dictionary.com (2012) defines a mobile device as a portable, wireless computing device that is small enough to be used while held in the hand; a hand-held: a large selection of smartphones, PDAs, and other mobile devices. Moreover, Reference.com (2012) provides a more specific definition of a mobile device: A mobile device (also known as cellphone device, handheld device, handheld computer, 'Palmtop" or simply handheld ) is a pocket-sized computing device, typically having a display screen with touch input or a miniature keyboard. In the case of the Personal Digital Assistant (PDA) the input and output are combined into a touchscreen interface. Smartphones and PDAs are popular amongst those who require the assistance and convenience of a conventional computer, in environments where carrying one would not be practical. Defining mobile devices based on size &dors might introduce ambiguity. For example, by defining mobile device as a handheld and pocket sized computer, a tablet PC will not be able to be classified as a mobile device since in general it cannot be fit into any pocket. In order to solve the problem of definition in mobile devices, Ballard (2007) argues that fundamentally, the attribute 'mobile" in mobile device refers to the user, and not to the device or the application. Mobile devices can be defined as computing devices that can be used to support the user's mobility.
Ballard (2007), in her book Designing the Mobile User Experience, describes four main characteristics of mobile devices, which are personal, comrrnmicative, handheld, and
for a significant portion of time. The 'always with you' experience which is provided by the mobile device is something which cannot be found in desktop computers or any other stationary devices. As a communication device, a mobile device can connect to a communication network in various ways to send and receive various forms of messages. Most communications in mobile devices are text based messaging such as Short Message Service (SMS), instant messaging and email. However, this may not always be the case. A mobile device is also a handheld device. The device can be operated using a single hand, two hands, or a hand with a surface. As a wakable device, a mobile device can be awakened quickly by a single touch of the user or by the communication network. A mobile device can receive a new text message any time, even when the device is in the sleep or standby mode. Mobile devices can provide an 'always on' experience to the user which cannot be found in personal computers. In general, personal computers cannot communicate through the communication network when they are in the sleep mode. These characteristics of mobile device make the device indispensable and the users tend to carry it with them almost all the time.
Apart from several capabilities offered by mobile devices, Chen (2008), states that compared to stationary computing devices, mobile devices in general have several limitations such as screen size, computational power, battery capacity, input interface, and network access. Based on the technology point of view, the limitations in mobile devices can be broadly classified into two categories, which are communication related limitations and device related limitations (Subramanya & Byung 2006). Communication related limitations in mobile devices include higher error rates, higher disconnection rates, more noise, and lower bandwidth. In addition, limited processing power, smaller memory capacity, smaller screen sin, limited battery power and limited input interfaces are most common device related limitations. Apparently, these device related limitations M mobile devices are mainly introduced by the requirements for mobile devices to be small, light, and fairly affordable for the users.
voice email wearable
or pocketabte
Personal
Communications
Device
multi- function
battery powered
wireless
instant messaging
always available
always on
[image:20.562.92.486.68.388.2]one owner
Figure 2.1 Personal communication-device/mobile-device characteristics
(Ballard 2007)
2.3 Mobile Internet
to the stationary Internet (Kim et al 2002).
Mobile Internet can be categorised into two major network technologies, which are Wireless Local Area Network (WLAN) and cellular data network. WLAN is known for Internet access with high bandwidth and hot spot local coverage, meanwhile, cellular data network is known for wide area coverage Internet access with a relatively lower bandwidth, compared to WLAN (Honkasalo et al 2002; Jaseemuddin 2003; Manku et al. 2004).
2.3.1 Wireless Local Area Network (WLAN)
There are two main components in Wireless Local Area Network (WLAN) communication which are Wireless Terminals (WT) and WLAN Access Points (AP). A wireless terminal can be a desktop computer, a laptop, a smartphone, a tablet, or any other mobile devices that comes with WLAN capabilities. Every wireless terminal will communicate with a WLAN access point through radio links (Ghetie 2008).
There are two organisations that regulate and provide the standardisations and specifications far WLAN technology. The first one is the Institute of Electrical and Electronics Engineers (IEEE) which provides the WLAN specifications in the US, and the second one is the European Telecommunications Standard Institute (ETSI) which is based in Europe and responsible for regulating and providing the WLAN specifications in Europe. Currently, there are three main specifications for WLAN, which are IEEE 802.11a, MEE 802.11b, and IEEE 802.11g (Ghetie 2008).
The WEE 802.11a is the first WLAN specifications promoted by the IEEE and it has adopted in 1999. The IEEE 802.11a is designed to operate in the 5 GHz Unlicensed National Information Infrastructure (UNIT) spectrum and using two different bands, which are the 200 MHz band from frequency 5.15 GHz to 5.35 GHz, and the 100 MHz band from frequency 5.725 GHz to 5.825 GHz For the encoding mechanism, the IEEE 802.11a implements the Orthogonal Frequency Division Multiplexing (OFDM). By using the OFDM, the data carrier is divided into several sub-carriers and transmitted in parallel. By
implementing this technique, the differences in delay of signals arriving at the receiver end point can be minimised and the interference issues, which are mainly caused by signal delay differences, can be overcome. In the IEEE 802.11a, the lower 200 MHz band is divided into 8 independent clear channels. Each of them has 20 MHz width. Furthermore, each of the independent clear channels is divided into 52 sub-channels (carriers), with the width of 300 KHz for each sub-channel. These 8 channels are assigned for indoor WLAN. Moreover, the next 100 MHz band in IFEE802.11a is divided into 4 independent clear channels and assigned for point-to-point outdoor WLAN communications. In 802.11a, there are three power domains, which are divided based on the 100 MHz band. The maximum power output which is allowed for the first 100 MHz band is 50 mWatt. The second 100 MHz band is restricted to the maximum of 250 mWatt power output. The third 100 MHz, which is used for point-to-point outdoor communications, is allowed up to 1 Watt power output. Moreover, since IEEE 802.11a uses different frequency than the IEEE 802.11b and the 802.11g, the IEE802.11a is not compatible with them (Ghetie 2008; au et aL 2004).
available bandwidth into 75 sub-channels with 1 MHz width for each sub-channel. The FHSS treats these 75 sub-channels as shared sub-channels which are used by multiple transmitters and receivers. In order to provide a good noise reduction, the FHSS implements a hopping pattern mechanism which is agreed by the communication parties in the beginning of the communication session. Regarding the output power regulation, in the US, the IEEE 802.11b output power is allowed up to 1 Watt. However, must mamifacturers limit the devices to produce output power around 30 mWatt only. This is to minimise the heat which is produced by the devices and also to conserve the battery power of the devices.
Following the IEEE 802.11b, the IEEE 802.11g specifications also operate in the 2.4 GHz Industrial Scientific Medical (ISM) spectrum. The IEEE 802.11g WLAN specification was adopted in the third quarter of 2003. Similar to the IEEE 802.11b, the access scheme for the IEEE 802.11g can use either the DSSS or the FHSS. This is to ensure that the IEEE 802.11g is fully compatible with the IEEE 802.11b, therefore it can promote an easy migration process from the previous predominated IEEE 802.11b standard to the new IEEE 802.11g standard. Moreover, the WEE 802.11g provides a high data rate up to 54 Mbps, which is higher compared to the data rate provided by the IEEE 802.11b. The Wi-Fi Alliance also takes part in providing the interoperability testing and the Wi-Fi certification for the IEEE 802.11g devices (Ghetie 2008; Zhu et aL 2004).
The HiperLAN2 is the WLAN specification promoted by ETSI which is implemented as the alternative to the JEFF. 802.11a specification in Europe. This is because in the beginning, the IEEE 802.11a specification was not accepted in Europe. The HiperLAN2 operates in the 5 GHz unlicensed spectrum which is the shared spectrum used by the military and civilians in Europe fibr satellite communications and ground tracking stations. In order to avoid interferences with other applications that operate in the same spectrum, HiperLAN2 implements Dynamic Frequency Selection (DFS) and Transmit Power Control (TPC). Similar to the IEEE 802.11a, the HiperLAN2 also implements Orthogonal Frequency Division Multiplexing (OFDM) as the encoding scheme. However, compared to the IEEE 802.11 WLAN specifications Dimly, the HiperLAN2 implements a different data
link layer which makes it closer to the ATM network than to the Ethernet network. The different implementation of data link layer in the HiperLAN2 compared to the WEE
802.11a brings differences in the MAC address implementation and the Quality of Service
(QoS) mechanism. In contrast to the popularity of the HiperLAN2, the popularity of the IEEE 802.11 WLAN family increased significantly and the WLAN implementations are dominated by the WEE 802.11 specifications family. Recently, the JEFF 802.11 fimnly has been accepted in Europe and the attraction of HiperLAN2 is fading (Ghetie 2008).
The IEEE 802.11n provides high speed data rates up to 300 Mbps and 600 Mbps within 20 MHz and 40 MHz bandwidth, respectively. The significant improvement in the data rate of the IBM 802.11n primary through the implementation of spatial multiplexing using Multiple Input Multiple Output (MIMO) and also the use of 40 MHz bandwidth Moreover, the implementation of multiple antenna, Space Time Block Coding (STBC), and Low Density Parity Check (LDPC) in the WEE 802.11n bring enhancement for the robustness factor. Dual band mode also introduced in the IEEE 802.11n, which makes it possible to operate in both 2.4 GHz and 5 GHz (Perahia & Stacey 2008).
Table 2.1 Comparisons of the IEEE 802.11 family (Perahia & Stacey 2008)
802.11b 802.11a 802.11g 802.11n
PHY technology DSSS OFDM OFDM DSSS SDM/OFDM
Data rates 5.5, 11 Mbps 6-54 Mbps 1-54 Mbps 6-600 Mbps Frequency band 2.4 GHz 5 GHz 2.4 GHz 2.4 and 5 GHz Channel spacing 25 MHz 20 MHz 25 MHz 20 and 40 MHz
2.3.2 Cellular Data Network
cellular network to evolve and start using the individual micro cellular radio system This
system introduces the reusability of frequencies across geographical regions. The micro
cellular radio is generated either by on-earth radio transmitters or by satellite radio
transmitters (Ghetie 2008).
The mobile communication networks have kept evolving in the last thirty years since their
first implementation in 1980s. They have evolved to increase efficiency in both access
methods and migration paths in order to provide higher data transmission rate capabilities
(Ghetie 2008). The first generation (1G) of mobile communication networks is the analog
and voice-oriented technologies. The Advanced Mobile Phone Service (AMPS) is the first
generation (1G) of mobile analog networks technology and it operates in 900 MHz band.
In the USA, AMPS is implemented as Narrowband AMPS (NAMPS). Similar technology
is implemented in the UK known as Totals Access Communication System (TACS) and in
Japan known as Japanese TACS (JTACS). Furthermore, the second generation of mobile
cellular networks technology (2G) is based on digital technologies with low data
transmission rate capabilities. This second generation technology was introduced in the
1990s and operates in the 800 MHz and 1.5 GHz bands. It comes with data transmission
rate capabilities up to 9.6 Kbps. There are four well known implementations of 2G, which
are Global System for Mobile Communications or Groupe Speciale Mobile (GSM), Code
Division Multiple Access (CDMA one), Digital AMPS (D-AMPS), and Personal Digital
Cellular (PDC). Since then, the data transmission service in GSM has evolved to provide a
dedicated data communication network with Internet connection capability. This service is
known as the GSM Packet Radio Service (GPRS). There is an intermediary generation
between the second and the third generation which is known as 2.5G or 2.75G. This
intermediary generation implements new architecture and radio interface which is known as
Personal Communication System (PCS). Moreover, it also operates in a new spectrum
band and provides higher data rate capabilities compared to the data rate offered by 2G. In
the intermediary generation, the GSM operates in 1,800 MHz and 1,900 MHz
Furthermore, its GPRS service has evolved to a new form of data service known as the
Enhanced Data rates for GSM Evolution (EDGE). EDGE provides a higher data rate up to
144 Kbps. The third generation (3G) of mobile cellular data network focuses on
- Primarily voice and low bit rate data (9.6-13 Kbps)
- Implemented as D-A MPS, (IS-54), COMA-one (15-95) (America), GSM TDMA (IS-136), GPRS Phase 1 (Europe), PDC (Japan)
•Spectrum in IAA 1850-1990
MHz
- Spectrum in Europe 900 MHz (GSM multi-band)
- Primarily voice and medium bit rate data (100- 144 Kbps)
- Implemented as D-AMPS (1S-136+), PCS-1900 PACS, COMA-1 (IS-95 Rev.B) (America), GSM 1800, GSM 1900, GPRS Phase 11 (Europe) EDGE - Spectrum in USA i850-1990 MHz
- Primarily voice and broadband data rates (144-384 Kbps) for high mobility,
high coverage and 2 Mbps for low mobility, low coverage - Worldwide roaming
- Implemented as UWC-136 CDMA-2000 (1S-41) (America), CDMA-CDMA-2000 Is RTT EV, DO, DV, UMTS /EDGE, W-COMA GSM MAP (Europe), W -CDM A (Japan)
•Spectrum in USA 1850-1990 MHz
1G
- Primarily voice - Implemented as AMPS, NAMPS (America), TACS, NMT (Europe), NTT, JTACS (Japan) - Spectrum in USA 824-891 MHz (395 channels of 30 kHz)
1980 (analog) 1990 (digital) 2000 (PCS) 2010 (IMT-2000)
Legend:csm-oionai System for Mobik Communications; GPRS-Gencral Packet Radio Service; EDGE-Enhanced Data for GSM Einlution: AMPS-Advanced Mobile Phone Service; 1)-AMPS-Digital AMPS: NAMPS-Narmnband AMPS; TDMA-Time Division Multiplex Access: LIMTS-Universal Mobile Telecommunications System; IMT-2000-International Mobik Telecommunications 2000; IS-International Standard; COMA I aRTT, CV, DO, DV- CDMA One Carrier Radio Transmission Technology Enhanced Version, Data Only, Data and Video.
broadband data services and dealing with more sophisticated data services such as
multimedia data services. In the third generation, the data rate capabilities in the mobile
cellular data network increased up to 2 Mbps and it implements a new architecture known
as Universal Mobile Telecommunications System/ International Mobile
Telecommunications (UMTS/IMT-2000). Several well known implementations in the third
generation of mobile cellular data networks are CDMA 2000 which is implemented in the
USA, and Wideband Code Division Multiple Access (W-CDMA) which is implemented in
Europe and Japan (Dahlman et aL 2011; Ghetie 2008).
Figure 2.2 Cellular mobile networks evolution (Ghetie 2008)
The creation and development of new services for mobile devices and also the
advancement in mobile system technology have contributed to the evolution of 3G to 4G.
The fourth generation of cellular data networks (4G) refers to a standard called the Long
Term Evolution (LTE), which is defined by the 3rd Generation Partnership Project (3GPP)
as a continuing work of W-CDMA for 3G system. Orthogonal Frequency Division
Multiplexing (OFDM) is used as downlink transmission scheme in LTE. OFDM oilers
robustness against time dispersion on the radio channel without introducing any complex
channel equalization on the receiver side. By using OFDM, the terminal cost and power
based on OFDM. However, due to the lower transmission power for the uplink, compared
to the downlink, LTE implements a different mechanism of OFDM for the uplink. Single
carrier transmission based on Discrete Fourier Transform (DST) precoded OFDM is used
for the LTE uplink transmission. It has a smaller peak to average power ratio compared to
the regular OFDM which is used for the downlink transmission. By implementing DST
precoded OFDM, the power consumption at the transmitter can be reduced and the
coverage can be improved (Astely et al. 2009; Dahlman et al. 2011). Within 20 MHz
bandwidth, the downlink peak data rates in LTE can reach up to 173 Mbps and 326
Mbps for 2x2 and 4x4 Multiple Input Multiple Output (MIMO), respectively. On the other
hand, the uplink peak data rates in LTE are limited up to 86 Mbps within 20 MHz
bandwidth (Khan 2009).
2.3.3 Pricing
A pricing comparison for mobile Internet access is provided in this section. The sources for
[image:27.564.136.464.417.765.2]the data are from several Internet service providers in Australia.
Table 2.2 Comparison of the Internet access cost in Australia
(Data collected in May 2012)
Network Type Provider Quota (GB) (AUD) Price
50 $49.95 BigPond 200 $69_95 500 $89.95 120 $59_99 WLAN / ADSL Optus 150 $69.99 500 $79.99 100 $59.95 iinet 200 $79.95 400 $99.95 1 $19.95 BigPond 4 $29.95 8 $39.95 15 $79.95 1 $20.00 5 $40.00
Optus 6 $50.00
Cellular Data
Networks 15 $130.00 8 $80_00 2 $10.00 Vodafone 4 $15_00 8 $25.00 1 $10.00 Virgin Mobile 2 $20.00 $30.00
It clearly can be seen from the comparison table that in general the mobile Internet pricing using cellular data networks is relatively more expensive compared to the one that using WLAN.
2.4 Mobile User
The Webster's online dictionary (2012) defines mobile user as: "The user is the individual or entity designated by the customer, individually or by class, as having access to the mobile service and having such authorization, individually or by class, as may be required by the public land mobile network (PLMN) operator or an authorized agent concerned". According to Ballard (2007), there are six mobile user characteristics that can be identified, which are mobile, interruptible and easily distracted, available, sociable, contextual, and identifiable. Mobile is the main characteristic of mobile users. Being mobile means that the users' location, including their physical and social context, are changing frequently. The user may be in rush-hour traffic, in a conference, in class, on a bus, walking down the street, at a restaurant, at the library, or in a restroom. Their location keeps changing in an unlimited range of shifting environments.
from their current activity with the mobile device.
Availability is the other side of interruptibility. Most mobile users keep their mobile devices
with them almost all the time. Therefore, mobile users are highly available to be reached by
their distant friends, family, colleagues, and clients (Ballard 2007). Some users even feel
uncomfortable when they are apart from their mobile devices because the devices enable
them to feel more connected with others. Being present and readily available is the
characteristic of mobile users. Moreover, they also tend to keep and look at the devices
frequently even though they are with others.
2.4.1 Mobile User Behaviour: Device-Network Interaction Pattern
Related to mobile user behaviour, there are several interesting studies that have been
conducted. One of the studies is about how the pricing of mobile services affects the users
behaviour in mobile Internet usage. According to Blechar et aL (2006), when both the
stationary Internet access and mobile Internet access are available, it has been found that
the users prefer to access the Internet services via stationary Internet access over the
mobile Internet access. In this context, the mobile Internet access refers to the mobile
Internet access via cellular telecommunication network such as EDGE, GPRS, 3G, or 4G.
The users perceive the cost of mobile Internet access as too expensive. This is because the
mobile service users often make reference to the existing stationary Internet access pricing,
which they are already farmliar with, when making their mobile Internet access decision
Their mobile Internet access usage tends to be influenced by their past experiences with
similar Internet service provided via stationary Internet access. Furthermore, several users
also have their stationary Internet access at their office or at the school which they do not
directly pay for. This condition makes some users perceive the stationary Internet access as
a free of charge service. Therefore when they start to compare the pricing between the
stationary Internet access and the mobile Internet access, they believe that the mobile
Internet access is far more expensive. Blechar et aL (2006) also mentions that most mobile
users use mobile Internet access in the evening, which is the time period when the users are
away from their desktop computers and their laptops to access a stationary Internet
connection.
I II
II
Daily service use
2 3 4 5 6 7 8 9 10 11 12 13 14 15 16 17 18 19 20 21 22 23 24
time (hour)
num
ber
o
f serv
ices
50
45
40
35
30
25
20
15
10
5
[image:30.562.102.487.94.330.2]0 1
Figure 2.3 Time of mobile Internet access daily usage (Blechar et al. 2006)
The mobile Internet usage is very suitable for accessing information unilaterally, such as
reading emails, checking stock quotes and news headlines, in order to fill the users' time
slot when they are in the waiting state, for example during the short bus ride or while
waiting in a line. Some users tend to use mobile Internet access to keep themselves
engaged or entertained in their free time. Bilateral use of data services via mobile Internet,
such as instant messaging and other text messaging services, is also effective under many
circumstances. Some mobile Internet users associate the mobility of Internet with efficiency.
The expectation of continuous availability of data and information services naturally fits with
the fast-paced society that rely their decision making on information in many aspects of
their life (Sarker & Wells 2003).
Cui & Roto (2008), based on their field exploration using four different context fictors of
mobile Internet access usage, show several interesting findings related to mobile user
behaviour. The four contextual factors that they use are spatial factors, temporal factors,
Internet access without necessarily interrupting their current activity. By accessing Internet
via mobile Internet access, the users can have Internet access while they are having dinner
at a restaurant, watching TV in the living room, or lying in their bedroom. Based on the
temporal factors, Cui & Roto (2008) uncovered a similar users behavior as what Sarker &
Wells (2003) found. They found that the users tend to use mobile Internet access for short
breaks or the moments between planned activities, for example waiting for a bus to arrive
or friends to show up, and even when waiting for a traffic light to change Furthermore,
based on social factors, Cui & Roto (2008) fotmd that users also use mobile Internet
access as a conversation enhancer. They occasionally use it thr starting a new discussion
topic, participating in ongoing discussion, and sometimes they also get involved in a dispute.
From access factors, Cui & Roto (2008) try to identify mobile users behavior based on
their usage of two main mobile Internet access types, which are via Wireless Local Area
Network (WLAN) and cellular data network. The users tend to use WLAN more often
than cellular data network, even though cellular data network offers a higher mobility level
compared to WLAN. The main reason for this behavior is also similar to what Blechar et
aL (2006) mentioned before, that the users are concerned about the higher data traffic
expenses in cellular data network. Moreover, WLAN offers not only cheaper but also
faster mobile Internet access. Therefore the mobile users prefer to use WLAN than cellular
data network to access heavy content such as video, music, and others multimedia content.
Time ---*-- Traffic
6 -300
5 z
o 4
4
3 2.4
A
44 ..2 -100
WCDMA EDGE GPRS WLAN
Figure 2.4 The effect of network types on mobile Internet usage (Cui & Roto 2008)
un
it:
minu
tes
Furthermore, Cui & Roto (2008) also categorise the mobile user activities into three main groups, which are information seeking, communication, and content object handling. Information seeking is the activity to gain more knowledge or entertainment and it can be fact finding, information gathering or casual browsing activity. In fact finding activity, the mobile users use the mobile Internet access to seek a piece of small and specific information such as today's weather forecast, an address of a restaurant, or list of new movies. Mobile users also use the mobile Internet access for information gathering activity where the they collect information from multiple sources and use it for decision making purposes or to collect knowledge related to a particular topic. Some mobile users use mobile Internet access to get more detailed information about a particular product and they even start to compare it with some other products or other shops to support their purchase decision. Another common activity among the mobile users related to information seeking is casual browsing, where the users are accessing general information without any specific goal, for example reading an online newspaper.
Sent out 495 mails
(5%)
Received 10502 mails
(95%)
Figure 2.5 Low response on platform mobile mail (Cm & Roto 2008)
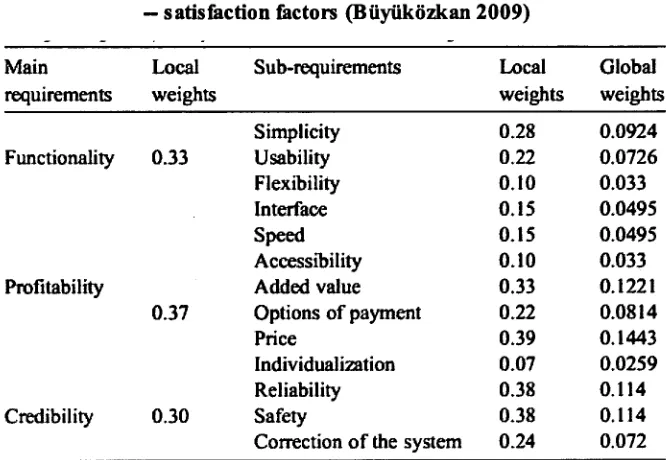
2.4.2 Mobile Internet User Satisfaction Factors
In order to identify mobile Internet user satisaction factors, several studies have been
conducted (El-Kki & Lawrence 2006; Scheepers et aL 2006). In addition, EitiyiikOzkan
(2009) provides an analytic fi-arnework to identify mobile user requirements, specifically in
the context of mobile commerce. Even though the focus of the study is mainly the mobile
commerce context, however, it is still relevant to be used in the broader context such as to
identify the mobile user requirements in generaL Mobile user satisfaction would eventually
be affected by the fulfillment of these requirements. In other words, these mobile user
requirements can also be treated as mobile user satisfaction actors.
In the top level, Buyiikozkan (2009) classifies these mobile user satisfaction actors into
three main categories, which are functionality, profitability, and credibility. Functionality
covers the interface related issues between the mobile technologies and the user. The
mobile platform should be as easy as possible to access by the user. Portability, as the
second category, covers both concrete and conceptual benefits that can be offered to the
user. The concrete benefits can also be represented in financial terms. The last category,
credibility, covers several issues that would attract the user to keep using the mobile
services. There are two aspects that would influence the credibility, the first one is credibility issues produced by the system and the second one is those perceived by the
user. Furthermore, each category can be divided into more specific factors in order to
address the mobile user satisfaction. There are six specific factors that can be derived from
functionality, which are simplicity, usability, flexibility, interface, speed, and accessibility.
Similar to functdonality, the profitability category can also be divided into four derived
factors, which are added value, options of payment, price, and individualization. Moreover,
there are three specific factors derived from the credibility category, which are reliability,
safety, and correction of the system. A further study is also conducted by Biiyukozkan
(2009) by implementing the fuzzy number technique in order to produce weight based
[image:34.563.125.458.259.489.2]composite priority among those identified mobile user satisfaction factors.
Table 2.3 Composite priority weights for mobile user requirements
— satisfaction factors (BilyilkozIcan 2009)
Main Local Sub-requirements Local Global
requirements weights weights weights
Simplicity 0.28 0.0924
Functionality 0.33 Usability 0.22 0.0726
Flexibility 0.10 0.033
Interface 0.15 0.0495
Speed 0.15 0.0495
Accessibility 0.10 0.033
Profitability Added value 0.33 0.1221
0.37 Options of payment 0.22 0.0814
Price 0.39 0.1443
Individualization 0.07 0.0259
Reliability 0.38 0.114
Credibility 0.30 Safety 0.38 0.114
Correction of the system 0.24 0.072
2.5 Multi-Objective Optimisation Problems
Optimisation can be defined as the task of finding one or more feastole solutions which can
produce desired or useful values of one or more objectives. Optimisation itself can be
single-objective optimisation or multi-objective optimisation. If there is only one objective
function that needs to be satisfied, the task of finding the optimal solution is called
single-objective optimisation. It follows then that if there is more than one objective function
that needs to be satisfied, the task of finding one or more optimum solutions is called
Most problems in real world applications have multiple objectives which are possibly conflicting each other. By optimising one objective, it may be sacrificing the other objectives (Bui & Alam 2008). A simple example can be found in computing equipment purchase decisions. People in general want to have computing equipment with high performance. However, people also want to save their money and spend less in every purchasing activity, including purchasing their computing equipment In this case, the objective of having the computing equipment with the best performance cannot be achieved without abandoning the objective of spending less money in purchasing. On the other hand the objective of spending less cannot be achieved without sacrificing the objective of having computer equipment with the best performance. Both objectives in the purchasing decision are conflicting each other. In formal study, the problems that deal with more than one objective, which need to be satisfied or optimised simultaneously, are known as Multi-Objective Optimisation Problems (Coello 2006).
In order to conduct further study in multi-objective optimisation problems, Coello (2007) provides a clear definition of these phenomena as:
the problem of Ending a vector of decision variables which satisfies constraints and optimises a vector function whose elements represent the objective functions. These fi.mctions form a mathematical description of performance criteria which are usually in conflict with each other. Hence, the term 'optimise' means finding such a solution which would give the values of all the objective functions acceptable to the decision maker.
The decision variables in multi-objective optimisation problems are the numerical values which are chosen in such a problem In mathematical notation, the variables can be represented as:
xi
7
j
E
{1, ...,
n}
Decision Variables (Coello 2001)
And the vector x of n decision variables will be represented as:
X = [Xi) •••7 Xn]
Vector x of n Decision Variables (Coello, C. 2001)
A vector of n decision variables in a multi-objective optimisation problem is called a solution (Deb 2009).
Constraints in optimisation problems are the restrictions or limitations introduced by the environment or resources, such as physical limitations, time restrictions, processing power limitations, and several other kind of limitations Certain solutions can be considered acceptable when these solutions can satisfy all the available constraints (Coello 2001). In mathematical notation, the constraints can be represented in mathematical inequalities:
Constraints Inequalities (Coello 2007)
and equalities:
E ...) M}
Constraints Equalities (Coello 2001)
In addition to constraints, Deb (2009) also mentions the decision variable bounds as a part of the constraints set. In mathematical notation, the variable bounds can be represented as:
(L)
x.
< X • <
XCU)3 —
Decision Variables Bounds (Deb 2009)
These variable bounds restricting each decision variable 'Si to take a value only in the range between the lower value xj(L) and the upper value xjm. These variable bounds represent a decision variable space D also known as decision space.
A solution x that satisfies all of the constraints and the variable bounds is known as a feasble solution. On the other hand, if any solution x does not satisfy all the constraints and the variable bounds, it is known as an infeasiale solution. Clearly, not all solutions in the entire decision variable space D are feasble solutions. The set of all feasible solutions is known as feasble region S (Deb 2009).
According to Coello (2001), objective fimctions are the computable functions of the decision variables that are used as criteria to evaluate a certain solution in order to know how good the solution is. In real world optimisation problems, some functions are required to be minimised while other functions are required to be maximised. Moreover, in multi-objective optimisation problems, these functions in many cases are conflicting each other. Optimising a particular objective function may sacrifice the other objective functions. These objective functions may be measured using the same measurement units, which are known as commensurable, or the functions may also be measured using different measurement units, known as non-commensurable. In mathematical notation, the objective functions can be represented as:
f
(Y)
f
k
(Y)
Objective Functions (Coello 2007)
where k represents the number of objective ftmctions being solved in the multi-objective optimisation problem.
The objective functions will form a vector function which can be represented in mathematical notation as:
Vector Function (Coello 2007)
Using this notation, the goal in multi-objective optimisation problems can clearly be seen as optimisation of all k objective functions simultaneously. The optimisation process itself can be done by maximizing the values of all k objective functions, or by minimizing the values of all k objective functions, or even in some cases by combining the maximisation and the minimisation values of these k objective functions (Coello, C. 2007). Since the task in multi-objective optimisation problems is about optimising a vector of objectives instead of a single-objective, multi-objective optimisation is also known as vector optimisation (Deb 2009).
Deb (2009) notes that many optimisation algorithms have been developed to deal with only one type of optimisation problem which is either minimisation or maximisation. In order to simplify the task dealing with mixed types of optimisation problems, the duality principle can be applied. In the context of optimisation, the duality principle suggest that a maximisation problem can be converted into minimisation problem by multiplying the objective function by -1. The same thing works vice versa.
2.5.1 Concept of Domination
In the case of comparing two solutions, solution x1 and solution x2, solution x1 is said to dominate the other solution x2 if it complies with the two domination conditions, which are:
1. The solution x1 is no worse than x2 in all objectives
2. The solution x1 is strictly better than x2 in at least one objective Or in mathematical notation can be represented as:
Vj :
-
1
(f3(x1) fi(x2)) j
E {1,...
and
3
j:
f3(x1)
<1
i3 (x2)
j E
Concept of Domination (Deb 2009)
In this case, k represents the number of objective functions being solved in the
rmli- objectives optimisation problem.
Operator .4 is used to represent "better than" relationship between two solutions. For example, a 1 b means a is better than b Operator <1 is commonly used to describe optimisation problems since it can produce a better understanding compared to operator < and > which often produce ambiguity. For example, Wan objective function in optimisation problems is to be minimised then the < operator would express the same meaning with operator < since in minimisation problem, the solution that can produce a lower value is better compared to the one that produce a higher value. The same thing works vice versa when an objective function in optimisation problems is to be maximised (Deb 2009).
If all the two domination conditions are true, then it can be said that solution x dominates solution y or in mathematical notation can be represented as:
x
y
Dominance Notation (Deb 2009)
Furthermore, in the context of minimisation as an optimisation problem, the concept of domination between two solutions, x and y, can be represented in mathematical notation as:
=
= [Yil ...) Yk]
xi < Yi
Concept of Domination in Minimisation (Coe Ho 2007)
According to Deb (2009), apart from representing solution x dominating solution y, this mathematical notation also implies that:
• solution y is dominated by solution x • solution x is non dominated by solution y • solution x is non inferior to solution y
Deb (2009) also states that there are three possible outcomes that can be produced from a dominance check between two solutions x and y, which are:
• solution x dominates solution y
• solution x gets dominated by solution y
• solution x and solution y do not dominate each other
In addition to the concept of domination, Bui & Alam (2008) describes the four properties of dominance relation which are:
1. Irreflexive
The dominance relation is irreflexive, since a solution does not dominate itself 2. Asymmetric
The dominance relation is asymmetric, since x -< y does not imply y x. 3. Not Antisymmetric
4. Transitive
The dominance relation is transitive since ifx -< y and y -‹ z, then x -< z.
2.5.2 Pareto Optimal
It is nearly impossible to have a single solution that can optimise all the objective fimctions. Therefore in multi-objective optimisation problems the focus is looking for a trade-off among the objective functions instead of looking for a single solution (Coello 2007). In single-objective optimisation, when there is only one objective function to be optimised, the notion of optimality can be clearly identified. The optimum solution can be found by simply looking for the best value of the predefined objective function, which can be the highest value in the case of maximisation or the lowest value in the case of minimisation. However, in multi-objective optimisation, the notion of optimality has become harder to identify, since there are more objective functions that need to be optimised. The notion of optimality needs to be redefined to guarantee that it can respect the integrity of each objective function. The concept of Pareto optimality can be applied in order to find a set of optimum solutions (Goldberg 1988).
According to Deb (2009), all possible pairwise comparisons can be performed for a given finite set of solutions in order to find which solutions are non-dominated with respect to each other. The set of non-dominated solutions that is left has the property of dominating all other solutions apart from the solutions which belong to this set In other words, the set of non-dominated solutions is simply better compared to all other solutions. Moreover, Deb (2009) explains that ifP is a set of solutions and P* is a set of non-dominated solutions, the P* are those that are not dominated by any member of P. Furthermore, if P is the entire search space of solutions, or P = D, then P* is called the Pareto Optimal Set In mathematical notation, Pareto optimality can be represented as:
P* := {Y E 1 3
1
-1]Y* E D
: f(_*)
(x)}
Pareto Optimal Set Notation (Coello 2007)
where D is the entire space of solutions or decision variables.
The global Pareto Optimal Set can be defined as the non-dominated set of the entire feasble search space S. Often the globally Pareto Optimal Set is simply referred to as Pareto Optimal Set (Deb 2009). Moreover, by plotting the Pareto Optimal Set in objective space, the non-dominated vectors are collectively known as the Pareto Front (Coello 2007). In mathematical notation, Pareto Front can be represented as:
P F* := fu
= f (Y)
1 Y
E P
*
1
Pareto Front Set Notation (Coe Ho 2007)
2.6 Evolutionary algorithms in Multi-Objective
Optimisation Problem
In order to solve multi-objective optimisation problems, the Operations Research community has developed several approaches based on a variety of mathematical programming techniques since the 1950s. However, there are several limitations in mathematical programming techniques when dealing with multi-objective optimisation problems. Most of them only produce a single solution for each run, therefore in order to produce a Pareto Optimal Set, several runs are required. Moreover, mathematical programming techniques in general are susceptible to the shape and continuity of the Pareto Front. In contrast, evolutionary algorithms can find several metnbers of the Pareto Optimal Set in a single run. Evolutionary algorithms are also less susceptible to the shape or continuity of the Pareto Front (Coello 2006).
The individuals in evolutionary algorithms are commonly represented by strings or vectors that have a fixed length. Every individual encodes a unique possible solution to address a particular problem. In an evolutionary algorithm, a set of individuals is known as a population. The evolutionary algorithm is started with an initial population consisting of a particular number of randomly generated individuals. String values in every individual are generated randomly by a random number generator. Furthemore, a fitness value is assigned to each individual. In order to generate the fitness value, each individual is decoded to produce a possible solution to the problem. The fitness function will calculate the solution value to produce a fitness value for the corresponding individual The individuals with higher fitness values represent better solutions to address the problem, compared to the ones with lower fitness values. This initial process is followed by the main iterative cycle which consists of two main operations, mutation and recombination. In every iteration, the individuals in the current population produce a new set of individuals called children. After the fitness value is assigned to every child, a new population is created. The current individuals and the children are allocated to become members of the new population. This new population will be treated as the current population in the next iteration cycle. In order to control the growth of the population, the similar approach to the natural evolutionary strategy, the survival of the fittest, is applied and the individuals start competing against each other. This kind of approach in evolutionary algorithms is known as the selection process. The fitness value is used as the basis for the selection process. The individuals with better fitness values have more chance of being selected as parents, in order to be able to produce children, and also to be selected to form a new population (Jones 1998).
...
.c
E
0 Parent 0 Member of Current Generation111 1
4,
44 I
: P)r'es
R
co
L
2
0 Children 0 Members of Next Generation
0 Generation 0 Successively Created Populations (EA Iteration)
Figure 2.6 Key components in Evolutionary Algorithms (EA) (Coello 2007)
Coen() (2007) identifies four main pi unary goals of evolutionary algorithms in order to solve multi-objective optimisation problems:
1. Maintain the non-dominated points in the objective space and associated solution
points in the decision space
2. Continually make algorithmic progress towards the Pareto Front in the objective function space
3. Maintain diversity on the Pareto Front and the Pareto Optimal Set
4. Provide a sufficient number of Pareto Optimal Set for the decision maker
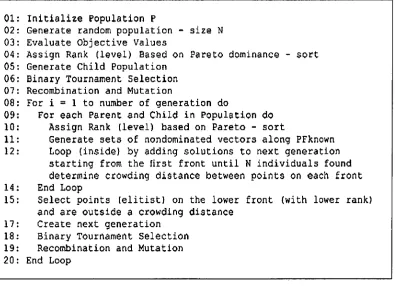
2.6.1 NSGA
NSGA or Non-dominated Sorting Genetic Algorithm is one example of evolutionary algorithm in multi-objective optimisation problem. NSGA is proposed by Srinivas and Deb
as another variation of Goldberg's approach (Goldberg 1988; Srinivas & Deb 1994;
Coello 2007). The algorithm is based on a non-dominated sorting procedure and it differs
from a simple genetic algorithm in the selection operation. The population is ranked based on an individual's non-domination before the selection operation is performed. Ranking
selection method and niche selection method are implemented in NSGA. A ranking
selection method is impletnented in order to emphasise good points and a niche selection
method is implemented to maintain stable subpopulations of good points.
CI Population 0 Set of Individuals (Solutions)
The fitst non-dominated individuals which are identified from the current population will be
classified as the first non-dominated front in the population. A large dummy fitness value is
assigned to these non-dominated individuals. In order to give an equal reproductive
potential to all these non-dominated individuals, these individuals are assigned with the
same fitness value. These classified individuals are then shared with their dummy fitness
values in order to maintain the diversity in the population. This causes multiple optimal
points to co-exist in the population. Furthermore, the rest unclassified individuals in the
population will be processed in the same way in order to identify individuals for the second
non-dominated front. These newly identified non-dominated individuals are then assigned
with a new dummy fitness value which is kept smaller than the minimum shared dummy
fitness value of the previous front The process is continued until the entire population is
classified into several fronts of non-dominated individuals. Later on, the population is
reproduced according to the dummy fitness values. Individuals in the first front always get
more copies than the rest of the population since they have the highest fitness value. The
reproduction or crossover process is aimed to search for non-dominated regions or Pareto
Optimal Front. The computational efficiency in NSGA is achieved using a non-dominated
sorting method where multiple objectives are reduced to a dummy fitness function (Srinivas
& Deb 1994).
1: Initialize Population P 2: Evaluate Objective Values
3: Assign Rank Based on Pareto dominance in Each Wave 4: Compute Niche Count
5: Assign Shared Fitness
6: For i=1 to number of generation Do
7: Selection via Stochastic Universal Sampling 8: Single Point Crossover
9: Mutation
10: Evaluate Objective Values
11: Assign Rank Based on Pareto dominance in Each Wave 12: Compute Niche Count
13: Assign Shared Fitness 14: End Loop
Figure 2.7 NSGA Pseudocode (Srinivas & Deb 1994; Coello 2007)