This article has been accepted for publication and undergone full peer review but has not been through the copyediting, typesetting, pagination and proofreading process, which may lead to differences between this version and the Version of Record. Please cite this article as doi: 10.1111/evo.13397.
This article is protected by copyright. All rights reserved. Research article
Signatures of selection in embryonic transcriptomes of lizards adapting in
parallel to cool climate
Nathalie Feiner1,2*, Alfredo Rago1, Geoffrey M. While2,3 and Tobias Uller 1,2
1Department of Biology, Lund University, Sölvegatan 37, 223 62 Lund, Sweden 2Department of Zoology, University of Oxford, Oxford OX1 3PS, UK
3School of Biological Sciences, University of Tasmania, Hobart, Tasmania 7005, Australia
Running title: Signatures of selection in lizard transcriptomes
Key words: climate, transcriptomics, thermal adaptation, non-native, lizard, convergent
evolution;
*Corresponding author contact details: [email protected]
Author contributions
NF, GMW and TU conceived the study, designed the experiment and collected the data. NF,
This article is protected by copyright. All rights reserved. 2
TU interpreted results and wrote the manuscript. GMW revised the draft. All authors
approved the final version of the manuscript.
Acknowledgements
We thank Weizhao Yang for discussion of the bioinformatics analyses, Hanna Laakkonen for
assistance with FST calculations, and Roberto Sacchi, Marco Zuffi, Fabien Aubret and Jérémie Souchet for logistical support. This research was supported by an early career
research grants from the Royal Society of London and a grant from the John Templeton
Foundation (60501), both to TU, a Humboldt Foundation Fellowship and a Wenner-Gren
postdoctoral fellowship to NF, and a Royal Society of London University Research
Fellowship and a Wallenberg Academy Fellowship from the Knut och Alice Wallenberg to
TU. We thank the High-Throughput Genomics Group at the Wellcome Trust Centre for
Human Genetics for the generation of sequencing data. Computational resources were
provided by the Swedish National Infrastructure for Computing (SNIC) at Uppsala
Multidisciplinary Center for Advanced Computational Sciences (UPPMAX). The study was
conducted according to the University of Oxford‟s Local Ethical Review Process and the UK
Home Office (PPL: 30/2560). Fieldwork was carried out under licenses and permits from
Natural England (20146129, 20144863), Direction Régionale de l‟Environnement, de
l‟Aménagement et du Logement (No 2010/DDEA/SEPR/175, No 11/2012, No
2010-DDEA-SE-105, No 29/2012, No 11/DDTM/657-SERN-NB) and Ministero dell‟Ambiente e della
Tutela del Territorio del Mare – DG Protezione della Natura e del Mare (DPR 357/97) and
This article is protected by copyright. All rights reserved. 3
Data archive location
Illumina reads were deposited in the NCBI SRA database under the accession number
SRP113322 (BioProject PRJNA394646, BioSample SAMN07357074).
Abstract
Populations adapting independently to the same environment provide important insights into
the repeatability of evolution at different levels of biological organization. In the 20th century, common wall lizards (Podarcis muralis) from southern and western Europe were introduced
to England, north of their native range. Non-native populations of both lineages have adapted
to the shorter season and lower egg incubation temperature by increasing the absolute rate of
embryonic development. Here we tested if this adaptation is accompanied by signatures of
directional selection in the transcriptomes of early embryos and, if so, if non-native
populations show adaptive convergence. Embryos from non-native populations exhibited
gene expression profiles consistent with directional selection following introduction, but
different genes were affected in the two lineages. Despite this, the functional enrichment of
genes that changed their expression following introduction showed substantial similarity
between lineages, and was consistent with mechanisms that should promote developmental
rate. Moreover, the divergence between non-native and native populations was enriched for
This article is protected by copyright. All rights reserved. 4
small populations are able to adapt to new climatic regimes, but the means by which they do
so may largely be determined by founder effects and other sources of genetic drift.
Introduction
Populations inhabiting similar environments often evolve similar phenotypes. Birds and
mammals living at high altitudes commonly exhibit higher haemoglobin-oxygen affinity
(Natarajan et al. 2016; Storz 2016), sticklebacks colonizing freshwater predictably lose their
body armour (Colosimo et al. 2005), and reptiles expanding into cool climates often become
live-bearing (Webb et al. 2006). Convergent evolution of phenotypes is sometimes
underpinned by convergence of its underlying molecular mechanisms (e.g., evolution of
toxins and resistance; Jensen et al. 2011; Ujvari et al. 2015), but similar phenotypes can also
be produced by very different processes (e.g., wing shape in Drosophila; Huey et al. 2000).
Revealing the patterns of convergence at different levels of biological organisation, and
understanding the causes of those patterns, represent major challenges for evolutionary
biologists (Agrawal 2017).
Adaptive evolution often involves changes in gene regulation, suggesting that
populations with similar phenotypes may have convergent gene expression profiles. For
example, a study of 900 genes expressed in the liver of juvenile brown trout (Salmo trutta)
found that gene expression profiles clustered according to whether the populations are
migratory or resident rather than the populations‟ genetic similarity (Giger et al. 2006).
Despite this, the evidence that selection plays a major role in divergence in gene expression
This article is protected by copyright. All rights reserved. 5
that, although differences in gene expression between populations can be substantial, usually
only a small number of genes exhibit convergent expression in populations that share the
same environment (Dayan et al. 2015; Ghalambor et al. 2015; Zhao et al. 2015).
A weak signature of convergence in gene expression profiles may suggest that most of
the variation in transcriptomes observed between populations accumulates under neutrality
(e.g., Khaitovich et al. 2005). Furthermore, there are many developmental routes to the same
phenotype (Wagner 2011). Most characters are not only polygenic, but developmental
pathways are often highly redundant and harbour substantial genetic variation (Paaby and
Gibson 2016). This suggests that selective history, founder effects and other sources of
genetic drift will influence the extent to which populations evolving in the same environment
converge with respect to gene expression. For example, abundant standing genetic variation
at a key locus in marine sticklebacks appears to have facilitated the repeated evolutionary loss
of body armour following colonization of freshwater (Colosimo et al. 2005).
A well-known example of convergent evolution in ectotherms is that individuals from
cool climates grow and develop more rapidly than individuals from warmer climates, in
particular at low temperatures (“counter-gradient adaptation”, Conover et al. 2009). For
example, lizard embryos from populations at high altitude or latitude grow absolutely faster
than conspecific embryos from populations in warmer climates (e.g., Oufieroi and Angilletta
2006; Du et al. 2010; Rodriguez-Diaz and Brana 2012). This implies that populations
colonizing cooler environments evolve changes in gene regulation that counter-act the direct
effect of temperature on growth and metabolism. It has been hypothesized that this mode of
This article is protected by copyright. All rights reserved. 6
(Ghalambor et al. 2007); reducing the maladaptive direct effects of temperature on gene
expression while exaggerating existing plastic expression patterns that facilitate maintenance
of growth and development at low temperature. However, despite the contemporary focus on
thermal adaptation in vertebrates, almost nothing is known about the mechanism by which
embryos adapt to incubation temperature.
Here we test for adaptive divergence and convergence of gene expression profiles in
lizard embryos, using two genetically distinct lineages of wall lizards adapting to cool climate
following their introduction from Europe to England. Embryos in English, non-native,
populations face drastically cooler soil temperatures during incubation than do embryos in
native populations (While et al. 2015a). While low temperature slows down growth and
development, strong natural selection for early hatching has made embryos of non-native
populations develop absolutely faster, in particular at low temperature (While et al. 2015a).
We compared gene expression of early embryos incubated at harsh and benign temperatures,
and tested for signatures of adaptive divergence between native and non-native populations
and adaptive convergence of non-native populations.
Materials and Methods
STUDY SYSTEM AND EXPERIMENTAL DESIGN
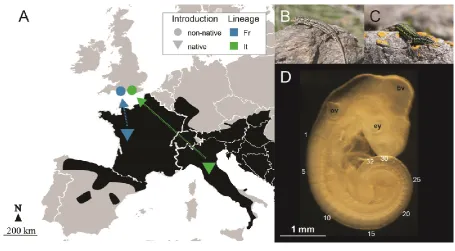
The common wall lizard is a small (approx. 50–70 mm snout-to-vent length), egg-laying
lacertid, widely distributed in Europe. Here we focus on two main genetic lineages inhabiting
This article is protected by copyright. All rights reserved. 7
ago (Gassert et al. 2013). Lizards from each of the two lineages have repeatedly and
independently been introduced to England over the last 100 years (Michaelides et al. 2013).
There are currently more than 25 populations across southern England, and the introduction
history has been reconstructed in detail (Michaelides et al. 2015).
Our aim was to analyse differences in gene expression profiles in early embryos, at
three different levels of comparison: (1) harsh (15 °C) versus benign (24 °C) temperatures,
(2) French versus Italian lineage, and (3) native versus non-native populations. This resulted
in a 2 x 2 x 2 experiment in which we refer to the main factors as (1) „temperature‟, (2)
„lineage‟ and (3) „introduction‟. We used a split clutch design in which embryos from each
clutch were divided between the two thermal treatments (see below) allowing us to control
for variation in the response to temperature caused by genetic similarity due to relatedness
(Supplementary Figure S1A).
In April 2015 we collected 13 gravid females from France (Fr; Pouzagues [46.788 N,
20.448 E]) and 18 from Italy (It; Greve in Chianti [43.588 N, 11.318 E], Colle di Val d‟Elsa
[43.428 N, 11.118 E], Certaldo [43.548 N, 11.042 E]), as well as 12 each from non-native
populations of both lineages in England (Italian origin: Ventnor Town [50.598 N, 21.218 E],
Ventnor Botanical Garden [50.588 N, 21.228 E]; French origin: Cheyne Weare [50.538 N,
22.438 E] and East Portland [50.548 N, 22.428 E]). The non-native Italian and French
populations were introduced in the 1930s and 1980s for the Italian and French lineages,
respectively (Michaelides et al. 2015). The native populations were chosen because they fall
within the approximate geographic origin of the non-native populations (Michaelides et al.
This article is protected by copyright. All rights reserved. 8
mm) with sand as substrate, bricks as shelter, and a water bowl. They were kept at a light
cycle of 12 L:12 D, and given access to basking lights (60 W) for 8 h per day and a UV light
(EXO-TERRA 10.0 UVB fluorescent tube) for 4 h per day. Mealworms and crickets were
provided ad libitum. Females were inspected in the morning and in the afternoon for signs of
egg-laying to ensure that eggs were collected within a maximum of 12 hours after
oviposition. Within each clutch, one egg was dissected immediately upon laying to determine
the developmental stage at laying (S0) and the remaining eggs were divided into two groups. One group of eggs was incubated at 15 ˚C (cool) and the other group was incubated at 24 ˚C
(warm). The cool incubation treatment represented temperatures frequently encountered by
eggs in nests under English climatic conditions, but below the constant temperature
conditions that allow successful hatching (While et al. 2015a). The warm incubation
treatment represented temperature within the range encountered in natural nests of both
lineages, and within the optimum thermal range for the species as estimated from the
incidence of scale malformations (While et al. 2015a). All eggs were incubated in small
plastic containers filled two-thirds with moist vermiculite (5:1 vermiculite:water volume
ratio) and sealed with clingfilm.
To compare gene expression patterns at a precise developmental stage, we needed to
account for the increase in developmental rate with temperature by adjusting the incubation
duration. We estimated developmental rates of P. muralis embryos from native and
non-native populations at 15 and 24 °C based on While et al. (2015a). We chose to target the
embryonic stage 27 (Dufaure and Hubert 1961), which roughly corresponds to the
pharyngula stage, since this allowed the warm incubated embryos to develop for at least 12
This article is protected by copyright. All rights reserved. 9
embryos to reach that stage in less than 4 weeks (approximate developmental rates at 24 ˚C: 4
somites per 1 day and at 15 ˚C: 4 somites per 7 days). Based on this prediction, we selected
eggs for dissection at regular intervals to ensure that a sufficient number of embryos of the
targeted developmental stage were obtained. Since embryonic stage 27 encompasses a range
of 29 to 34 somites, we further narrowed the developmental time point for the subset of
embryos subjected to gene expression by selecting only embryos with 32 ± 1 somites (Fig.
1D).
We further decreased the confounding variation among our samples by following a
strict protocol. First, we performed dissections between paired embryos of a clutch at the
same time of day (within a one-hour interval) to minimize variation caused by diurnal
patterns of embryonic gene expression (Seron-Ferre et al. 2007). Second, all eggs were
processed within five minutes of removal from the incubator to avoid changes in gene
expression patterns. Embryos were separated from yolk and extraembryonic membranes in
DEPC-treated PBS (phosphate-buffered saline) by using sterile forceps under a dissecting
microscope. Each embryo was photographed, staged (including somite count), and
submerged in RNAlater (Qiagen) to stabilize RNA. Total RNA from a total of 96 embryos
(40 for single- and 56 for pooled embryo-sampling strategy) at developmental stage 27 (31 ±
1 somites) was extracted by using the RNeasy Micro Kit (Qiagen). The yield of total RNA
was measured with the Qubit® 2.0 Fluorometer system using the Qubit RNA BR Assay Kit
(Thermo Fisher Scientific) and determined to be on average 7.45 (± 0.38) µg per embryo.
RNA integrity was assessed with the Experion system using the Eukaryote Total RNA
This article is protected by copyright. All rights reserved. 10
TRANSCRIPTOME SEQUENCING
An overview of the applied bioinformatics pipeline is provided in Supporting Information
Fig. S1B. For each of the eight experimental groups, five samples, each consisting of the total
RNA of a single, whole embryo, were used for expression analysis. In addition, we pooled
equimolar amounts of RNA from 4-6 (4.63 ± 1.19) embryos from different mothers per study
group to obtain one gene expression data set with minimal individual variation. These pooled
samples were used in de novo transcriptome assembly to ensure a maximally complete
reference set (see below). Thus, a total of 6 samples per study group were subjected to library
preparation, resulting in a total of 48 samples. Per sample, 2 µg of purified, high-quality total
RNA (RQI values >9) was subjected to RNA sequencing. In brief, the mRNA fraction was
converted into cDNA, end-repaired, A-tailed and adapter-ligated. Size selected and
multiplexed libraries were paired-end sequenced (100 bp) over a total of 16 lanes on a
HiSeq2000 Sequencing System (Illumina) by applying a balanced block design (Auer and
Doerge 2010).
We obtained on average 39.3 million raw reads per sample. Quality control was
performed using FastQC software (URL:
http://www.bioinformatics.babraham.ac.uk/projects/fastqc/). Low quality reads were removed
and a sliding window approach was used to trim low quality bases at the ends of the reads
using Trimmomatic Version 0.32 (settings: LEADING:3 TRAILING:3
SLIDINGWINDOW:4:20 MINLEN:36;Bolger et al. 2014). The French and Italian lineages
This article is protected by copyright. All rights reserved. 11
separate reference transcriptomes. For this purpose, we pooled 8 representative samples for
each lineage: each one consisting of a randomly selected single embryo sample and the
pooled sample for cool and warm incubation treatments for native and non-native
populations. Prior to assembly, using the Trinity software Version 2.3.2 (Haas et al. 2013)
and strand-specific information, the redundancy in the French and Italian pooled datasets
were removed by performing in silico normalization as part of the Trinity pipeline. The raw
assemblies were further filtered in three steps: first, duplicates were removed by clustering
the assembly at 95% sequence similarity using CD-HIT-EST version V4.6.5 (Li and Godzik
2006). Second, pools containing all French and Italian reads, respectively, were mapped to
the respective raw assembly using Bowtie 2 (Langmead and Salzberg 2012), and all
transcripts with a FPKM coverage of <1 were discarded by using the RSEM algorithm (Li
and Dewey 2011) implemented in the Trinity wrapper. Third, if several isoforms of a given
transcript were present in the assembly, only the longest isoform was retained. To make
expression profiles of French and Italian lizard embryos comparable, we merged the two de
novo assemblies by using the Proteinortho software Version 5.15 (Lechner et al. 2011) and a
custom script, and created a shared wall lizard reference transcriptome (divergent nucleotides
are masked as „N‟s). To exclude the possibility of biotic contamination of our samples, we
excluded transcripts with bit scores at least 10 times higher in blastx searches against
invertebrate metazoan peptides (NCBI: taxid 33208 and excluding taxid 89593) than against
vertebrate peptides (NCBI: taxid 89593) using NCBI‟s Entrez Direct. Trimmed reads of all
48 samples were mapped to the shared reference transcriptome using Bowtie 2 and raw
counts per sample were estimated using the RSEM algorithm. To avoid spurious effects from
This article is protected by copyright. All rights reserved. 12
than 50% of the samples. Our substantial filtering methodology resulted in a transcriptome
comprising 20,221 transcripts with a N50 value of 2,894. We refer to expressed sequences as
transcripts in the technical sense but use the term „genes‟ and „gene expression‟ in more
general discussions.
FUNCTIONAL ANNOTATION OF TRANSCRIPTS
The de novo assembled transcriptome of embryonic P. muralis lizards was functionally
annotated using the Trinotate pipeline (https://trinotate.github.io/). The longest open reading
frames of a minimum of 50 amino acids in length were predicted using Transdecoder v.2.0.1
(http://transdecoder.sourceforge.net/). These putative peptides (and original transcripts) were
used as queries in blastp (blastx) searches against the UniProtKB/Swiss-Prot database
(release “2017_02_15”). From accepted blast hits (E-value cut-off 10−5), Trinotate retrieves Gene Ontology (GO) annotations (Ashburner et al. 2000). We found significantly similar
peptides in the Swissprot-Uniprot database for 9,991 out of total 20,221 transcripts (49.4%),
and for 9,421 transcripts (46.6%) we retrieved at least one GO term (see Supplementary File
1). Note that the Trinotate pipeline also retrieves annotations from other sources (e.g. KEGG
or PFAM), but since we obtained by far the most annotations from GO terms, which we
consider to be most informative, we restricted our enrichment analysis to these annotations.
The R package GOseq (Young et al. 2010) was used to detect over- and under-represented
GO terms by using a FDR adjusted P-value <0.05. By using information theoretic similarity
concepts, we estimated similarities between sets of GO terms (similarity calculation based on
This article is protected by copyright. All rights reserved. 13
analysis, we removed GO terms whose direct „parent‟ GO term was also included in the same
dataset to avoid pseudo-replication.
NEUTRAL EXPECTATION OF DIFFERENCES IN GENE EXPRESSION
Non-native populations are likely to become different from the source population due to
founder effects and subsequent genetic drift. To evaluate the extent to which gene expression
differences between populations are the result of neutral processes versus directional
selection, a null model of gene expression differences is needed. We employed a comparison
of FST – MST values, where FST is the differentiation index derived from putatively neutral molecular marker loci, and MST is the proportion of total variance in gene expression explained by the variance between populations (Whitehead and Crawford 2006; Hughes et al.
2015). MST, as well as the related and more commonly used index QST (used for quantitative phenotypic traits), are derived from the variances within and between populations, and are
directly comparable to FST values (Whitlock 2008; Leinonen et al. 2013). The conventional interpretation is that traits or gene expressions with QST or MST values higher than FST values are putative signatures of natural (directional) selection, while values lower than FST are signatures of stabilizing selection and QST or MST equal to FST indicates neutral evolution of traits or gene expressions (Whitlock 2008; Leinonen et al. 2013).
FST values were recalculated from a previously published dataset of 13 microsatellite loci (Michaelides et al. 2015) using Arlequin 3.5.1.3 (Excoffier and Lischer 2010). MST values were calculated from the expected mean squares of a one-way ANOVA with
This article is protected by copyright. All rights reserved. 14
was executed for variance-stabilized count data for every transcript, and independently for
each lineage and temperature, resulting in four sets of MST estimates („Fr-cool‟, „Fr-warm‟, „It-cool‟ and „It-warm‟). The rationale for subdividing the dataset is that we are interested in
comparing MST values between the two lineages and that the experimental design did not allow precise estimates of family variation independently of the temperature treatment.
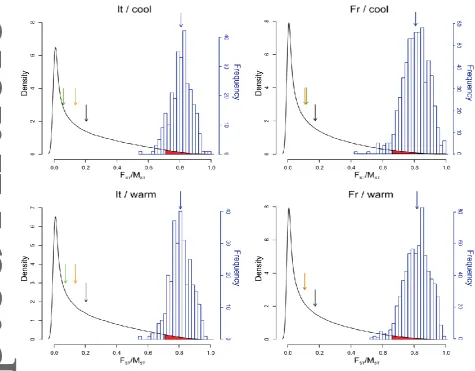
Since these calculations provide only point estimates of FST and MST values, and since these estimates are generally associated with large variances, we followed the approach of
Whitlock and Guillaume (2009) to derive the expected distribution of MST values based on the FST estimates for microsatellite markers and the variance of gene expression within populations (Vawithin; see Supplementary File 2). Assuming the approximation of MST = FST, which should be true for neutral traits, we simulated one million neutral MST values (MST_neutral) by sampling the distribution of observed FST values and the variance in gene expression within each population (Vawithin) under the Chi-square distribution of Lewontin and Krakauer (1973); (R script adapted from Lind et al. 2011). We evaluated the observed
MST values of the entire transcriptome (MST_observed) and of the subgroup of genes differentially expressed following introduction (MST_DEG) against the MST values under neutral evolution (MST_neutral). We considered transcripts with associated MST values that lie above the 97.5% confidence interval of MST_neutral to be candidates under directional selection.
This article is protected by copyright. All rights reserved. 15
To gain a first overview of the broad patterns of variation in gene expression profiles, we
applied a principal component analysis to the full dataset by using the R package DESeq2
(Love et al. 2014). After we confirmed that samples derived from a pool of embryos are
clustering closely with samples derived from single embryos (Supplementary Figures S2), we
exclude the pooled samples from further analyses to avoid deflating within-population
variances. We used a FDR (false discovery rate) adjusted P-value <0.01 as the cutoff for
differential expression. First, we interrogated the dataset for differentially expressed genes by
fitting a full factorial model that contained „lineage‟ (Fr – It), „temperature‟ (cool – warm)
and „introduction‟ (native – non-native), plus all possible interactions as fixed effects.
Second, we divided the data into four subsets partitioning out the effect of „lineage‟ and
„temperature‟, to obtain more specific insights into gene expression changes that are
associated with the introduction of lizards to England. This strategy allowed us to also assess
if responses are stronger at low incubation temperature, which we might expect for
populations adapting to a cooler environment (see Discussion). This analysis produced four
sets of genes that are differentially expressed between native and non-native populations
(DEGintro). Third, we selected the total set of DEGintro for a given lineage and examined to what extent these genes are recruited from a pool of ancestrally temperature-responsive
genes. To address the question, we asked if DEGintro are enriched in genes that are differentially expressed in native populations in response to temperature. This set of
ancestrally „plastic‟ genes (DEGancPlast) was obtained fitting a model with „temperature‟ as sole factor to a dataset containing only native populations. Fourth, we investigated how the
This article is protected by copyright. All rights reserved. 16
factor to the set of DEGintro and assessed if the total number and regulation of temperature-responsive genes changed following introduction.
To verify if our results are robust against different strategies of analysis, we also
investigated the effect of the introduction by controlling for temperature in the statistical
model, instead of analyzing the two incubation temperatures separately (see above). The
results of these latter approach produced very similar findings as the main analyses and are
presented in Supplementary File 3.
TRANSCRIPT CLUSTERING AND DIFFERENTIAL CLUSTER EXPRESSION
To overcome the limitations of differential gene expression analysis at the level of single
genes (e.g., the problem of multiple-testing, general noise in gene expression data; Horgan
and Kenny 2011; Conesa et al. 2016), we applied co-expression-based transcriptome
clustering (Langfelder and Horvath 2008). This approach reduces the high dimensionality
inherent in transcriptomic datasets, and thereby increases the power of detecting modules of
genes that exhibit shared gene expression profiles (Meng et al. 2016). We performed
co-expression-based clustering of our variance-stabilized transcript count data using the R
package WGCNA (Langfelder and Horvath 2008), which constructs a network based on
pairwise correlations of transcript expression, and aggregates transcripts which share the
same neighbors into modules. We subsequently used the first principal component of each
This article is protected by copyright. All rights reserved. 17
Robust pairwise correlations were calculated using bi-weight mid-correlations, which
penalize scores proportionally to their distance from the median (Langfelder and Horvath
2008). We also allowed the two most extreme data points (5%) to be considered as outliers
and excluded these from calculations. We constructed a signed network to retain information
on the sign of the correlations as well as their strength, and power-transformed it to the
lowest exponent that generated a scale-free topology (17), which is expected for gene
expression networks (Langfelder and Horvath 2008). We tested a different range of clustering
specificities and compared their results to select the parameters that minimized correlation
between modules while retaining unique patterns. We opted to apply the most permissive
split criterion („deepSplit‟ option set to 0), merging modules which diverged at tree height
lower than 20% and setting a minimal modules size of 20 transcripts. A heatmap of the
eigengene correlations between the resulting modules is shown in Supplementary Figure S3.
To look systematically for modules that show significant response to any of our
explanatory variables, we applied linear mixed models (LMMs) as implemented in the R
package lme4 (Bates et al. 2015) to the eigenvalues of each module. We specified clutch
identity as a random factor to account for the expected correlation due to higher genetic
similarities within the same clutch. Starting from a full model containing all three terms
(„lineage‟, „temperature‟ and „introduction‟) and their interactions, we fitted a model for
every combination of those factors. We then compared the resulting model set by using AICc,
selecting the models that best fit the data (ΔAICc < 2; Supplementary Table S1). Only five
modules out of total 25 showed multiple models being equally fit, and we selected the model
with fewest terms for these five cases (Supplementary Table S1). To ensure appropriate fit of
This article is protected by copyright. All rights reserved. 18
and null models for each module (data not shown). All model-set comparisons were
performed using the R package MuMIn (Barto 2015).
ENRICHMENT ANALYSES
Enrichments or general significance in overlapping sets of transcripts or GO terms was tested
by simulating 10,000 permutations of a randomly selected dataset. If the observed number of
overlapping transcripts or GO terms was larger than the 97.5% confidence interval of the
permutated dataset, the enrichment was considered to be significant.
Results
PATTERNS OF VARIATION IN GENE EXPRESSION
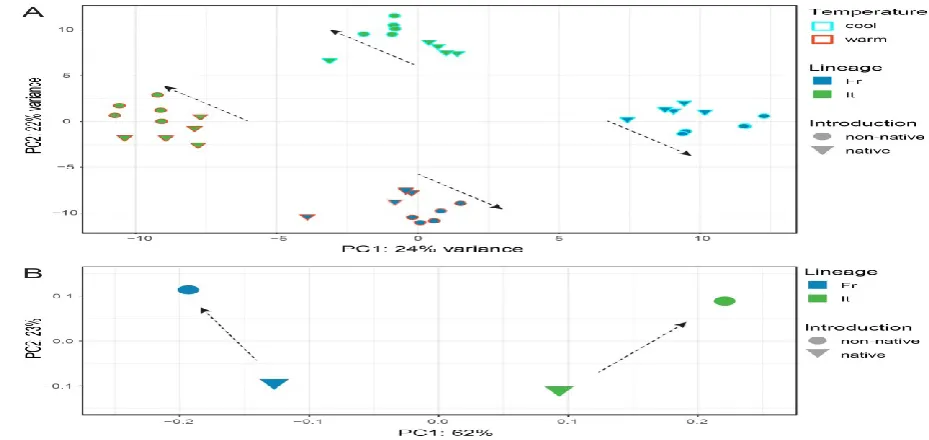
The principal components showed that the eight experimental groups clearly separate into
four clusters according to the two main effects, incubation temperature and lineage (Fig. 2A).
The signal of introduction, setting native and non-native populations apart, was substantially
smaller. However, within lineages and temperatures, native embryos were significantly more
similar to each other than to their non-native counterparts (see dashed arrows in Fig. 2A). The
direction of divergence between native and non-native populations was different for the two
lineages; that is, the principal component values did not fall along the same axis (Fig. 2A).
This pattern was consistent with the prediction from putatively neutral microsatellite markers,
This article is protected by copyright. All rights reserved. 19
dissimilar to each other than were the native populations of French and Italian origin (Fig.
2B).
DIFFERENTIALLY EXPRESSED TRANSCRIPTS
Using a model including all interaction terms, we found that 21.7% (4,393) of all transcripts
were differentially expressed in response to incubation temperature and 19.8% (3,998)
showed differences between lineages (Table S2). The number of transcripts that were
consistently differently expressed between native and non-native populations were fewer, but
still substantial (3.9%, 783 differentially expressed transcripts). There was also a significant
number of transcripts for which we identified a significant interaction between lineage and
introduction (2.4%, 476 differentially expressed transcripts; Table S2).
We partitioned our dataset into four subsets along the major factors (lineage and
temperature) to identify transcripts that were differentially expressed (DEGintro) between non-native and non-native populations (see below). When comparing the observed MST values for the four subsets to the MST_neutral distribution, we found that substantially more transcripts than expected by chance had MST values above the 97.5% confidence interval (Table 1; Supplementary Figure S4). This effect was particularly pronounced for the French lineage,
where there were almost three times as many transcripts with highly divergent expression
than expected. In addition, the vast majority of MST values associated with the DEGintro identified in the single gene analysis (see below) fall well outside of the 97.5% confidence
This article is protected by copyright. All rights reserved. 20
DEGintro identified in the single gene analysis are candidates for being under directional selection following introduction to England.
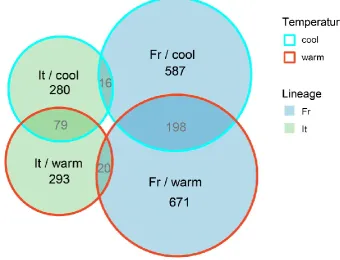
Overall, more transcripts were differentially expressed in lizard embryos of French
origin and at the warm incubation temperature (Fig. 4). More than 15% of transcripts that
differed in their expression between non-native and native embryos (DEGintro) were consistently up-or down-regulated at both temperatures within a lineage (198 (18.7%) versus
79 transcripts (16.0%) for French and Italian origin, respectively; note that all of these
transcripts showed the same sign of expression difference at both temperatures; Fig. 4). The
overlap of DEGintro between lineages was small, but higher than expected by chance at both cool and warm temperature (15 °C: 16 transcripts; 1.9%; neutral expectation: 8, 95% CI
[4-13]; 24 °C: 20 transcripts; 2.1%; neutral expectation: 10, 95% CI [5-15]). However, only half
of these DEGintro shared between lineages showed a consistent direction of expression change. We identified only one transcript that was differentially expressed in all four data
subsets, and the direction of the change in non-native compared to native populations differed
between lineages.
Transcripts that were differentially expressed in non-native versus native populations
were significantly (approximately 1.6 fold) enriched for transcripts that showed a
temperature-dependence in native populations (i.e. „ancestral plasticity‟; Table S3). However,
we did not find evidence that transcripts differentially expressed following introduction
change their response to temperature, and there was a large overlap of
temperature-responsive transcripts between native and non-native populations (Fr: 124 transcripts; 33%;
This article is protected by copyright. All rights reserved. 21
CI [13-28]). Furthermore, the vast majority (96%) of transcripts that were temperature
responsive in the native population („ancestral plasticity‟) qualitatively retained their
expression profile in respect to temperature following introduction (Table S4).
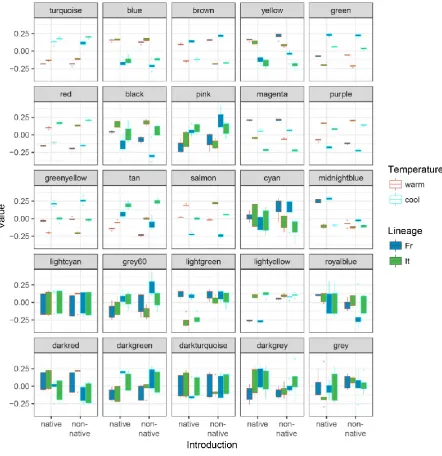
DIFFERENTIALLY EXPRESSED GENE MODULES
Co-expression-based clustering produced 24 modules of co-expressed genes plus one module
that consisted of three genes that showed no significant co-expression (module „grey‟;
naming of modules by color names is default in the WGCNA software; Fig. 5). The average
size of modules was 842 genes, with the largest module containing 3443 genes (module
„turquoise‟), and the smallest module 30 genes (module „darkgrey‟).
Consistent with the results described above, 18 out of 25 modules showed significant
differences in expression at 15 °C versus 24 °C (Supplementary Table S1), and the
expression pattern of six modules was best explained by temperature alone. While there was
no statistical support for a module with lineage as the only explanatory variable, lineage was
included as an explanatory factor in the best models for 14 modules. In six of those modules
temperature and lineage alone provided the best explanation for the observed expression
patterns, in two modules lineage and introduction were selected as best predictors, and in the
remaining six modules all three factors best explained variation in the data. All eight modules
which supported „introduction‟ as a main effect include the interaction term between
„introduction‟ and „lineage‟ (Supplementary Table S1), consistent with the lack of
This article is protected by copyright. All rights reserved. 22
comparison, out of the 18 temperature-responsive modules, only two show lineage-specific
responses to temperature.
The overall divergence between native and non-native populations is evident in the
graphical representation of the eigenvalues of gene modules (Fig. 5). For example, modules
„red‟, „purple‟, „salmon‟ and „tan‟ have significantly lower expression in French populations
introduced to the UK compared to native French populations, whereas the same modules
show higher expression in Italian populations introduced to the UK compared with native
Italian ones. In contrast, the eigenvalues of the two modules „midnightblue‟ and „lightyellow‟
are characterized by identical expression profiles across experimental groups except for
French native lizard embryos (Fig. 5). A corresponding pattern, but with Italian native lizards
exhibiting the divergent expression profile is shown by module „lightgreen‟. These three
modules („midnightblue‟, „lightyellow‟, and „lightgreen‟) are significantly enriched in genes
that are differentially expressed following introduction (percentage of DEGintro in whole dataset: 7.44%; percentage in „midnightblue‟: 31.80%; percentage in „lightyellow‟: 37.86%;
percentage in „lightgreen‟: 21.05%).
FUNCTIONAL CHARACTERIZATION OF RELEVANT GENES
Comparing the GO terms associated with genes differentially expressed between native and
non-native populations (DEGintro) against a neutral expectation, we find enrichment of 209, 300, 210 and 244 GO terms for the Fr-cool, Fr-warm, It-cool and It-warm datasets,
respectively. GO terms overlapped within lineages between incubation temperatures (Fr: 38;
This article is protected by copyright. All rights reserved. 23
The similarity between the shared group of GO terms between the French and the Italian
lineage was significantly higher than expected by chance for the two main GO domains
„biological process‟ and „molecular function‟ (Table 2), suggesting convergence between
non-native populations at the level of gene function. For example, French DEGintro are enriched in the term „purine nucleobase catabolic process‟ (GO:0006145), while the
corresponding Italian group of genes are overrepresented with the term „pyrimidine
nucleoside catabolic process‟ (GO:0046135).
Discussion
Following their introduction to England in the 20th century, wall lizards originating from France and Italy have adapted to the cooler climate experienced in their non-native range by
increasing developmental rate (While et al. 2015a). A faster rate of embryonic development
shortens incubation duration, which enables lizards to hatch before the onset of autumn
despite the low incubation temperatures in England. Our results here suggest this faster
development rate has been accompanied by adaptive modification of cellular metabolism.
However, the genes that have evolved higher or lower expression following introduction
showed no, or at best very limited, overlap for lizards of the French and Italian lineages.
Nevertheless, we find that these genes share substantial similarity in their putatively assigned
gene functions. Our study thus exemplifies that founder effects and other sources of historical
contingency can allow convergence of phenotype in the face of divergence of gene
This article is protected by copyright. All rights reserved. 24
SIGNATURES OF NEUTRALITY AND SELECTION IN TRANSCRIPTOMES
Introduced populations often become genetically more different from each other because of
founder effects and drift due to low population size. The wall lizard populations studied here
were introduced by humans, likely through the release of tens of individuals, and show a
modest reduction in genetic diversity compared to populations in their native range
(Michaelides et al. 2016). Indeed, estimates of neutral genetic divergence (FST) show that non-native populations of the two lineages are genetically more different to each other than
the corresponding comparison of populations from the native range (see also Michaelides et
al. 2016), suggesting that genetic drift has played an important role during or following
introduction.
The overall divergence in embryonic gene expression between non-native and native
populations (i.e., MST) followed the pattern predicted by FST, and hence the majority of variation in transcriptomes among populations are selectively neutral. This result is in line
with the limited number of other studies that have compared divergence in transcriptomes to
a neutral model based on FST (e.g., Roberge et al. 2007; Lamy et al. 2011; Hughes et al. 2015). Nevertheless, the analyses revealed more highly divergent transcripts than expected by
chance, suggesting that at least part of the transcriptome has been under directional selection
since the populations were introduced. This was also supported by the analyses of modules of
co-expressed genes, which revealed a small number of modules for which the non-native and
native populations differed substantially from each other. Both types of analyses strongly
suggested that the targets of directional selection in gene expression patterns were different
This article is protected by copyright. All rights reserved. 25
The signal of directional selection was particularly strong for the French lineage, a
more recent introduction that has retained more neutral genetic diversity (Michaelides et al.
2016). Since populations in western France are genetically more homogenous than in Italy
(Michaelides et al. 2015), the more pronounced difference between non-native and native
populations of French compared to Italian origin is unlikely to be caused by sampling bias.
Nevertheless, an obvious limitation for inference of selection on transcriptomes, which
applies to our study as well, is that a robust rejection of selective neutrality (and
environmental maternal effects) requires an experimental design that allows more precise
estimates of additive genetic variance (e.g. a quantitative genetic breeding design).
Although few studies have compared divergence in transcriptomes to a neutral model
based on sequence data (Leinonen et al. 2013), other studies of genetically distinct
populations of animals that inhabit similar environments have found that a (usually very
small) part of the transcriptome has converged. This is evidence that the expression of those
genes have been under directional selection. For example, Zhao et al. (2015) showed that
around 1% of the transcriptomes of two Drosophila species exhibit the same changes
between pairs of high and low altitude populations. The results from wall lizard embryos are
consistent with directional selection on gene expression in populations of both lineages
following introduction. However, we found very limited support for convergence of gene
expression profiles between lineages in non-native, cool-adapted, populations. Specifically,
while more transcripts with divergent expression between non-native and native populations
were in fact shared between lineages than expected by chance, these transcripts did not show
a consistent up- or down-regulation in non-native populations. In addition, the relatively low
This article is protected by copyright. All rights reserved. 26
lineage suggests that a portion of the putative targets of selection are false positives. This may
have limited the overall signal of convergence between lineages. However, given the low
number of shared transcripts (fewer than 20 for a given temperature) between lineages,
together with the limited signal in the Italian lineage, we conclude that there is no robust
evidence for convergence in the expression of particular genes in non-native populations.
Despite limited evidence for convergence in gene expression, we did find
considerable similarity in the putative functionalities associated with genes that were
differentially expressed in non-native populations. For example, genes differentially
expressed in embryos from non-native populations of both lineages were highly enriched for
GO terms associated with nucleotide- and glucose-metabolism. Although functional
annotations should be interpreted with caution, the enrichment of functional categories
suggests that non-native populations of both lineages exhibit an increase in absolute
transcription and replication rate, a higher cellular metabolism and faster cell cycle. Thus,
these results are consistent with the faster developmental rate of embryos from non-native
populations, a difference that is apparent already at this early stage of development.
The lack of overlap in modules of co-expressed genes under putative directional
selection, and at best a very modest overlap of individual genes, implies that there is a very
large number of variants that can contribute to thermal adaptation. In non-native populations,
the standing genetic variation available to natural selection will largely be determined by
founder effects. The English wall lizard populations studied here are isolated with no gene
flow, which restricts the likelihood of convergence of gene expression profiles when
This article is protected by copyright. All rights reserved. 27
natural range expansion. For example, common wall lizards are abundant even at thermally
challenging altitudes across their native range. Because high-altitude lizard populations often
show an adaptive increase in developmental rate, there are opportunities to test if populations
that adapt independently to cool climate without the bottlenecks and genetic isolation
associated with an introduction event show more consistent gene expression profiles. More
generally, such comparisons of populations with different demographic histories may be
useful to identify how historical contingencies influence the extent of convergent evolution at
the molecular level, and thus the repeatability of adaptive evolution at different levels of
biological organization.
TEMPERATURE-DEPENDENT GENE EXPRESSION AND ADAPTATION
Despite the highly conserved embryonic stage we based our analysis on, there was a strong
effect of temperature on transcription profiles with as many as 20% of all transcripts showing
differences in their relative expression at 15 °C versus 24 °C. There does not appear to be any
comparable data for other vertebrate embryos, but this figure is consistent with what has been
reported for temperature-dependent gene expression in Drosophila melanogaster and D.
simulans where 10-20% of all genes responded significantly to a temperature difference of 8
˚C (Zhao et al. 2015). The existence of temperature-specific gene expression suggest that it
should be possible for organisms to adapt to low temperature without necessarily changing
their response to high temperature. In contrast to their native counterparts, wall lizard
embryos in England are likely to consistently experience temperatures below 20 °C (While et
This article is protected by copyright. All rights reserved. 28
to be particularly pronounced at very low temperature. This does not appear to be the case,
however. Within each lineage, the putatively adaptive gene expression differences that have
accumulated in non-native populations were equal in magnitude across the two incubation
temperatures. This result may reflect the strong selection for shorter incubation in non-native
populations since a faster developmental rate at high temperatures can have a
disproportionate effect on incubation period even if such temperatures are encountered only
rarely (While et al. 2015a). Indeed, cool-adapted populations of ectotherms often develop and
grow faster also at high temperatures that should only occasionally be encountered in the wild
(Angilletta 2009). In our study, some 16-18 % of transcripts that were differentially
expressed between the non-native and native populations (i.e., DEGintro) showed a consistent response at both 15 and 24 °C. These genes are perhaps particularly likely candidates for
directional selection for faster developmental rate, not the least since they were highly
enriched for processes related to nucleotide metabolism and transcription, as described above.
There is a growing interest in how environment-dependent gene expression may
change during adaptation to novel environments. On the one hand, maladaptive plasticity in
gene expression is expected to quickly become eliminated by natural selection. For example,
in guppies, gene expression under putative directional selection in a predator-free
environment showed reduced sensitivity to predatory cues (Ghalambor et al. 2015). In the
context of adaptation to cool climate, this should involve selective removal of extreme gene
expression profiles at low temperature, resulting in an overall weaker
temperature-dependence. On the other hand, strong temperature-dependent expression may reflect
adaptive plasticity. In this case, selection in more extreme thermal environments may
This article is protected by copyright. All rights reserved. 29
thermal sensitivity (Lande 2009). Thus, both reduced and increased plasticity in gene
expression are possible outcomes of adaptation to an extreme environment.
There is some empirical evidence that transcripts that are highly responsive to
temperature also figure disproportionally as candidates for climate adaptation. In the
estuarine fish Fundulus heteroclitus, eight out of eleven genes that were upregulated in
muscle at cool acclimation temperatures were downregulated in cool-adapted versus
warm-adapted populations (Dayan et al. 2015). Our results also provide some support for the
prediction that adaptation to cool climate will preferentially involve genes that show native
temperature-responsiveness (i.e. ancestral plasticity). The putative adaptive gene expression
differences in lizard embryos from England were enriched for transcripts that were
significantly up- or down-regulated with temperature in native populations from both Italy
and France. However, there was no evidence for a consistent increase or decrease in the
temperature-sensitivity of expression of those genes. Thus, it appears as if evolution in
non-native populations did not tinker with the thermal sensitivity of gene expression, but rather
adjusted constitutive expressions. Suffice to say that the results suggest that evolutionary
adaptation to temperature preferentially involves modification of the same regulatory
interactions that also make embryos developmentally responsive to temperature.
References
Agrawal, A. A. 2017. Toward a Predictive Framework for Convergent Evolution: Integrating
Natural History, Genetic Mechanisms, and Consequences for the Diversity of Life.
This article is protected by copyright. All rights reserved. 30
Angilletta, M. J. 2009. Thermal Adaptation: A Theoretical and Empirical Synthesis. Oxford
University Press.
Ashburner, M., C. A. Ball, J. A. Blake, D. Botstein, H. Butler, J. M. Cherry, A. P. Davis, K.
Dolinski, S. S. Dwight, J. T. Eppig, M. A. Harris, D. P. Hill, L. Issel-Tarver, A.
Kasarskis, S. Lewis, J. C. Matese, J. E. Richardson, M. Ringwald, G. M. Rubin, and
G. Sherlock. 2000. Gene ontology: tool for the unification of biology. The Gene
Ontology Consortium. Nature genetics 25:25-29.
Auer, P. L. and R. W. Doerge. 2010. Statistical design and analysis of RNA sequencing data.
Genetics 185:405-416.
Barto, K. 2015. MuMln: Model Selection and Model Averaging Based on Information
Criteria (AICc and alike). R-package version 1.15.1.
Bates, D., M. Mächler, B. Bolker, and S. Walker. 2015. Fitting Linear Mixed-Effects Models
Using lme4. Journal of Statistical Software; Vol 1, Issue 1 (2015).
Bolger, A. M., M. Lohse, and B. Usadel. 2014. Trimmomatic: a flexible trimmer for Illumina
sequence data. Bioinformatics 30:2114-2120.
Colosimo, P. F., K. E. Hosemann, S. Balabhadra, G. Villarreal, Jr., M. Dickson, J.
Grimwood, J. Schmutz, R. M. Myers, D. Schluter, and D. M. Kingsley. 2005.
Widespread parallel evolution in sticklebacks by repeated fixation of Ectodysplasin
This article is protected by copyright. All rights reserved. 31
Conesa, A., P. Madrigal, S. Tarazona, D. Gomez-Cabrero, A. Cervera, A. McPherson, M. W.
Szczesniak, D. J. Gaffney, L. L. Elo, X. Zhang, and A. Mortazavi. 2016. A survey of
best practices for RNA-seq data analysis. Genome biology 17:13.
Conover, D. O., T. A. Duffy, and L. A. Hice. 2009. The covariance between genetic and
environmental influences across ecological gradients: reassessing the evolutionary
significance of countergradient and cogradient variation. Annals of the New York
Academy of Sciences 1168:100-129.
Dayan, D. I., D. L. Crawford, and M. F. Oleksiak. 2015. Phenotypic plasticity in gene
expression contributes to divergence of locally adapted populations of Fundulus
heteroclitus. Molecular ecology 24:3345-3359.
Du, W. G., D. A. Warner, T. Langkilde, T. Robbins, and R. Shine. 2010. The physiological
basis of geographic variation in rates of embryonic development within a widespread
lizard species. The American naturalist 176:522-528.
Dufaure, J. and J. Hubert. 1961. Table de developpement du lezard vivipare: Lacerta
vivipara. Archives d'Anatomie Microscopique et de Morphologie Experimentale
50:309–328.
Excoffier, L. and H. E. Lischer. 2010. Arlequin suite ver 3.5: a new series of programs to
perform population genetics analyses under Linux and Windows. Mol Ecol Resour
This article is protected by copyright. All rights reserved. 32
Frohlich, H., N. Speer, A. Poustka, and T. Beissbarth. 2007. GOSim--an R-package for
computation of information theoretic GO similarities between terms and gene
products. BMC bioinformatics 8:166.
Gassert, F., U. Schulte, M. Husemann, W. Ulrich, D. Rödder, A. Hochkirch, E. Engel, J.
Meyer, and J. C. Habel. 2013. From southern refugia to the northern range margin:
genetic population structure of the common wall lizard, Podarcis muralis. Journal of
Biogeography 40:1475-1489.
Ghalambor, C. K., K. L. Hoke, E. W. Ruell, E. K. Fischer, D. N. Reznick, and K. A. Hughes.
2015. Non-adaptive plasticity potentiates rapid adaptive evolution of gene expression
in nature. Nature 525:372-375.
Ghalambor, C. K., J. K. McKay, S. P. Carroll, and D. N. Reznick. 2007. Adaptive versus
non-adaptive phenotypic plasticity and the potential for contemporary adaptation in
new environments. Functional Ecology 21:394-407.
Giger, T., L. Excoffier, P. J. Day, A. Champigneulle, M. M. Hansen, R. Powell, and C. R.
Largiader. 2006. Life history shapes gene expression in salmonids. Current biology :
CB 16:R281-282.
Haas, B. J., A. Papanicolaou, M. Yassour, M. Grabherr, P. D. Blood, J. Bowden, M. B.
Couger, D. Eccles, B. Li, M. Lieber, M. D. Macmanes, M. Ott, J. Orvis, N. Pochet, F.
Strozzi, N. Weeks, R. Westerman, T. William, C. N. Dewey, R. Henschel, R. D.
This article is protected by copyright. All rights reserved. 33
from RNA-seq using the Trinity platform for reference generation and analysis.
Nature protocols 8:1494-1512.
Horgan, R. P. and L. C. Kenny. 2011. „Omic‟ technologies: genomics, transcriptomics,
proteomics and metabolomics. The Obstetrician & Gynaecologist 13:189-195.
Huey, R. B., G. W. Gilchrist, M. L. Carlson, D. Berrigan, and L. Serra. 2000. Rapid evolution
of a geographic cline in size in an introduced fly. Science 287:308-309.
Hughes, D. A., M. Kircher, Z. He, S. Guo, G. L. Fairbrother, C. S. Moreno, P. Khaitovich,
and M. Stoneking. 2015. Evaluating intra- and inter-individual variation in the human
placental transcriptome. Genome biology 16:54.
Jensen, N. B., M. Zagrobelny, K. Hjerno, C. E. Olsen, J. Houghton-Larsen, J. Borch, B. L.
Moller, and S. Bak. 2011. Convergent evolution in biosynthesis of cyanogenic
defence compounds in plants and insects. Nature communications 2.
Khaitovich, P., S. Paabo, and G. Weiss. 2005. Toward a neutral evolutionary model of gene
expression. Genetics 170:929-939.
Lamy, J. B., L. Bouffier, R. Burlett, C. Plomion, H. Cochard, and S. Delzon. 2011. Uniform
selection as a primary force reducing population genetic differentiation of cavitation
resistance across a species range. PloS one 6:e23476.
Lande, R. 2009. Adaptation to an extraordinary environment by evolution of phenotypic
This article is protected by copyright. All rights reserved. 34
Langfelder, P. and S. Horvath. 2008. WGCNA: an R package for weighted correlation
network analysis. BMC bioinformatics 9:559.
Langmead, B. and S. L. Salzberg. 2012. Fast gapped-read alignment with Bowtie 2. Nature
methods 9:357-359.
Lechner, M., S. Findeiss, L. Steiner, M. Marz, P. F. Stadler, and S. J. Prohaska. 2011.
Proteinortho: detection of (co-)orthologs in large-scale analysis. BMC bioinformatics
12:124.
Leinonen, T., R. J. McCairns, R. B. O'Hara, and J. Merila. 2013. Q(ST)-F(ST) comparisons:
evolutionary and ecological insights from genomic heterogeneity. Nature reviews.
Genetics 14:179-190.
Lewontin, R. C. and J. Krakauer. 1973. Distribution of gene frequency as a test of the theory
of the selective neutrality of polymorphisms. Genetics 74:175-195.
Li, B. and C. N. Dewey. 2011. RSEM: accurate transcript quantification from RNA-Seq data
with or without a reference genome. BMC bioinformatics 12:323.
Li, W. and A. Godzik. 2006. Cd-hit: a fast program for clustering and comparing large sets of
protein or nucleotide sequences. Bioinformatics 22:1658-1659.
Lind, M. I., P. K. Ingvarsson, H. Johansson, D. Hall, and F. Johansson. 2011. Gene flow and
selection on phenotypic plasticity in an island system of Rana temporaria. Evolution
This article is protected by copyright. All rights reserved. 35
Love, M. I., W. Huber, and S. Anders. 2014. Moderated estimation of fold change and
dispersion for RNA-seq data with DESeq2. Genome biology 15:550.
Meng, C., O. A. Zeleznik, G. G. Thallinger, B. Kuster, A. M. Gholami, and A. C. Culhane.
2016. Dimension reduction techniques for the integrative analysis of multi-omics
data. Brief Bioinform 17:628-641.
Michaelides, S., G. M. While, C. Bell, and T. Uller. 2013. Human introductions create
opportunities for intra-specific hybridization in an alien lizard. Biol Invasions
15:1101-1112.
Michaelides, S. N., G. M. While, N. Zajac, F. Aubret, B. Calsbeek, R. Sacchi, M. A. Zuffi,
and T. Uller. 2016. Loss of genetic diversity and increased embryonic mortality in
non-native lizard populations. Molecular ecology 25:4113-4125.
Michaelides, S. N., G. M. While, N. Zajac, and T. Uller. 2015. Widespread primary, but
geographically restricted secondary, human introductions of wall lizards, Podarcis
muralis. Molecular ecology 24:2702-2714.
Natarajan, C., F. G. Hoffmann, R. E. Weber, A. Fago, C. C. Witt, and J. F. Storz. 2016.
Predictable convergence in hemoglobin function has unpredictable molecular
underpinnings. Science 354:336-339.
Oufieroi, C. E. and M. J. Angilletta, Jr. 2006. Convergent evolution of embryonic growth and
development in the eastern fence lizard (Sceloporus undulatus). Evolution
This article is protected by copyright. All rights reserved. 36
Paaby, A. B. and G. Gibson. 2016. Cryptic Genetic Variation in Evolutionary Developmental
Genetics. Biology 5:28.
Roberge, C., H. Guderley, and L. Bernatchez. 2007. Genomewide identification of genes
under directional selection: gene transcription Q(ST) scan in diverging Atlantic
salmon subpopulations. Genetics 177:1011-1022.
Rodriguez-Diaz, T. and F. Brana. 2012. Altitudinal variation in egg retention and rates of
embryonic development in oviparous Zootoca vivipara fits predictions from the
cold-climate model on the evolution of viviparity. Journal of evolutionary biology
25:1877-1887.
Schlicker, A., F. S. Domingues, J. Rahnenfuhrer, and T. Lengauer. 2006. A new measure for
functional similarity of gene products based on Gene Ontology. BMC bioinformatics
7:302.
Seron-Ferre, M., G. J. Valenzuela, and C. Torres-Farfan. 2007. Circadian clocks during
embryonic and fetal development. Birth defects research. Part C, Embryo today :
reviews 81:204-214.
Storz, J. F. 2016. Hemoglobin-oxygen affinity in high-altitude vertebrates: is there evidence
for an adaptive trend? Journal of Experimental Biology 219:3190-3203.
Ujvari, B., N. R. Casewell, K. Sunagar, K. Arbuckle, W. Wuster, N. Lo, D. O'Meally, C.
Beckmann, G. F. King, E. Deplazes, and T. Madsen. 2015. Widespread convergence
in toxin resistance by predictable molecular evolution. Proceedings of the National
This article is protected by copyright. All rights reserved. 37
Wagner, A. 2011. The origins of evolutionary innovations : a theory of transformative change
in living systems. Oxford University Press, Oxford.
Webb, J. K., R. Shine, and K. A. Christian. 2006. The adaptive significance of reptilian
viviparity in the tropics: testing the maternal manipulation hypothesis. Evolution
60:115-122.
While, G. M., J. Williamson, G. Prescott, T. Horvathova, B. Fresnillo, N. J. Beeton, B.
Halliwell, S. Michaelides, and T. Uller. 2015a. Adaptive responses to cool climate
promotes persistence of a non-native lizard. Proceedings. Biological sciences / The
Royal Society 282:20142638.
While, G. M., S. Michaelides, R. J. Heathcote, H. E. MacGregor, N. Zajac, J. Beninde, P.
Carazo, I. d. L. G. Perez, R. Sacchi, M. A. Zuffi, T. Horvathova, B. Fresnillo, U.
Schulte, M. Veith, A. Hochkirch, and T. Uller. 2015b. Sexual selection drives
asymmetric introgression in wall lizards. Ecology letters 18:1366-1375.
Whitehead, A. and D. L. Crawford. 2006. Neutral and adaptive variation in gene expression.
Proceedings of the National Academy of Sciences of the United States of America
103:5425-5430.
Whitlock, M. C. 2008. Evolutionary inference from QST. Molecular ecology 17:1885-1896.
Whitlock, M. C. and F. Guillaume. 2009. Testing for spatially divergent selection: comparing
QST to FST. Genetics 183:1055-1063.
Young, M. D., M. J. Wakefield, G. K. Smyth, and A. Oshlack. 2010. Gene ontology analysis
This article is protected by copyright. All rights reserved. 38
Zhao, L., J. Wit, N. Svetec, and D. J. Begun. 2015. Parallel Gene Expression Differences
between Low and High Latitude Populations of Drosophila melanogaster and D.
simulans. Plos Genet 11:e1005184.
Tables
Table 1. Comparison of observed MST values of whole transcriptome and of subset of
DEGintro with the neutral expectation derived from FST values.
Data subs et Mea n FST Mean MST_neut ral Mean MST_observ ed Mean MST of
DEGint ro Expecte d number of genes outside 97.5% CI Observe d number of total transcrip ts outside 97.5% CI Fold enrichme nt Observe d number of DEGintr o outside 97.5% CI [percent of all DEGintr o] It / cool 0.13
7 0.205 0.060 0.808 463-549 599 1.2 x
257 [91.8%]
It / warm
0.13
7 0.204 0.074 0.809 462-549 686 1.4 x
271 [92.5%]
Fr / cool
0.10
9 0.176 0.119 0.808 463-550 1405 2.8 x
566 [96.4%]
Fr / warm
0.10
9 0.174 0.107 0.818 463-548 1509 3.0 x
This article is protected by copyright. All rights reserved. 39
The neutral expectation of the number of transcripts with have MST values higher than the 97.5% confidence interval was estimated using permutation tests. The distributions of the
estimated MST_neutral and the MST_DEG are shown in Fig. 3, and the distribution of all observed MST values (MST_observed) is plotted in Figure S3. DEGintro refers to genes that are differentially expressed between native and non-native populations.
Table 2. Comparison of similarities between sets of GO terms between French and Italian lineage.
Category Number of GO terms Fr number of GO terms It Observed similarity 95% CI of simulated similarity
BP 10 14 0.2356 0.0645-0.1641
MF 12 13 0.1072 0.0408-0.1071
Both categories BP („biological process‟) and MF („molecular function‟) show significant
similarity between the two lineages. Note that the number of GO terms in each category does
not correspond to the total number of enriched GO terms since not all GO terms were
associated with an „Information content‟ which is a prerequisite for calculating similarities
(Schlicker et al. 2006). Category CC („cellular component‟) had too few GO terms with an