https://doi.org/10.5194/cp-13-1491-2017 © Author(s) 2017. This work is distributed under the Creative Commons Attribution 3.0 License.
Regional Antarctic snow accumulation over the past 1000 years
Elizabeth R. Thomas1, J. Melchior van Wessem2, Jason Roberts3,4, Elisabeth Isaksson5, Elisabeth Schlosser6,7, Tyler J. Fudge8, Paul Vallelonga9, Brooke Medley10, Jan Lenaerts2, Nancy Bertler11,12, Michiel R. van den Broeke2, Daniel A. Dixon13, Massimo Frezzotti14, Barbara Stenni15,16, Mark Curran3, and Alexey A. Ekaykin17,18
1Ice Dynamics and Paleoclimate, British Antarctic Survey, Cambridge, UK CB3 0ET
2Institute for Marine and Atmospheric Research Utrecht (IMAU), Utrecht University, Utrecht, the Netherlands 3Antarctic Climate and Ecosystems, Australian Antarctic Division, Hobart, Tasmania 7050, Australia
4Antarctic Climate & Ecosystems Cooperative Research Centre, University of Tasmania, Hobart, 7001, Australia 5Geology and Geophysics, Norwegian Polar Institute, 9296 Tromsø, Norway
6Institute of Atmospheric and Cryospheric Sciences, Austrian Polar Research Institute, Vienna, Austria 7Institute of Atmospheric and Cryospheric Sciences, University of Innsbruck, Innsbruck, Austria 8Earth and Space Sciences, University of Washington, Seattle, USA
9Centre for Ice and Climate, Niels Bohr Institute, University of Copenhagen, Copenhagen, Denmark 10Cryospheric Sciences Laboratory, NASA Goddard Space Flight Center, Greenbelt, Maryland, USA 11Antarctic Research Centre, Victoria University, Wellington 6012, New Zealand
12National Ice Core Research Laboratory, GNS Science, Lower Hutt 5040, New Zealand 13Climate Change Institute, University of Maine, Orono, Maine 04469, USA
14ENEA, Agenzia Nazionale per le nuove tecnologie, l’energia e lo sviluppo sostenibile, Rome, Italy
15Department of Environmental Sciences, Informatics and Statistics, Ca’ Foscari University of Venice, Venice, Italy 16Institute for the Dynamics of Environmental Processes, CNR, Venice, Italy
17Climate and Environmental Research Laboratory, Arctic and Antarctic Research Institute, St. Petersburg, 199397, Russia 18Institute of Earth Sciences, Saint Petersburg State University, St. Petersburg, 199178, Russia
Correspondence to:Elizabeth R. Thomas ([email protected])
Received: 13 February 2017 – Discussion started: 28 March 2017
Revised: 25 August 2017 – Accepted: 20 September 2017 – Published: 10 November 2017
Abstract. Here we present Antarctic snow accumulation variability at the regional scale over the past 1000 years. A to-tal of 79 ice core snow accumulation records were gathered and assigned to seven geographical regions, separating the high-accumulation coastal zones below 2000 m of elevation from the dry central Antarctic Plateau. The regional com-posites of annual snow accumulation were evaluated against modelled surface mass balance (SMB) from RACMO2.3p2 and precipitation from ERA-Interim reanalysis. With the ex-ception of the Weddell Sea coast, the low-elevation compos-ites capture the regional precipitation and SMB variability as defined by the models. The central Antarctic sites lack coherency and either do not represent regional precipitation or indicate the model inability to capture relevant precipita-tion processes in the cold, dry central plateau. Our results show that SMB for the total Antarctic Ice Sheet (including
1 Introduction
The Antarctic Ice Sheet (AIS) is the largest reservoir of fresh water on the planet and has the potential to raise global sea level by about 58.3 m if melted completely (IPCC, 2013). Even small changes in its volume could have significant im-pacts, not just on global mean sea level, but also on the wider hydrological cycle, atmospheric circulation, sea surface tem-perature, ocean salinity, and thermohaline circulation. The mass balance of the AIS constitutes the difference between mass gains, mainly by snow accumulation, and mass losses, mainly by ice flow over the grounding line. Ice sheet mass balance is currently estimated in three ways: (1) ice sheet volume change is calculated using repeated surface eleva-tion measurements from radar or laser altimeters on airborne or spaceborne platforms followed by a conversion from vol-ume change to mass change using a model for firn density. (2) Ice sheet mass changes can be directly measured using the Gravity Recovery and Climate Experiment (GRACE) satel-lite system. (3) Surface mass balance (SMB) and solid ice discharge can be individually estimated and subtracted (Rig-not et al., 2011). These three techniques have significantly advanced our understanding of contemporary AIS mass bal-ance, with growing evidence of increased mass loss over re-cent decades (Velicogna and Wahr, 2006; Allison et al., 2009; Chen et al., 2009; Rignot et al., 2011; Shepherd et al., 2012). However, the uncertainties in these assessments may be as high as 75 % (Shepherd et al., 2012), and another study even suggested a positive trend over the same period (Zwally et al., 2015).
The discrepancies and uncertainties may in part reflect the large interannual (Wouters et al., 2013) and spatial (Anschütz et al., 2006) variability in snowfall and hence SMB, but also the difficulty with which SMB is measured and the complex-ities of the data interpretation. AIS SMB is the net result of multiple processes such as surface mass gains from snow-fall and deposition and losses from snow sublimation and wind erosion. Mass losses from meltwater runoff are small in Antarctica, except for some parts of the Antarctic Peninsula. Multiple in situ SMB observations can be combined to pro-duce an SMB map for selected ice sheet regions (Rotschky et al., 2007) or for the entire AIS (Favier et al., 2013). Al-ternatively, SMB can be simulated by (regional) atmospheric climate models, such as the Regional Atmospheric Climate Model (RACMO) version 2.3 (Van Wessem et al., 2014), and various reanalysis products such as ERA-Interim (Dee et al., 2001) or JRA55 (Kobayashi et al., 2015). Estimates of SMB can be improved by combining methods following, for ex-ample, the approach of Arthern et al. (2006) by interpolat-ing field measurements with remotely sensed data as a back-ground field or Van de Berg et al. (2006), who fitted output from a regional model to in situ observations. The resulting values of SMB averaged over the grounded AIS range from 143 kg m−2yr−1 (Arthern et al., 2006) to 168 kg m−2yr−1 (van de Berg et al., 2006). Several studies have evaluated
modelled SMB with in situ observations across Antarctica (Thomas and Bracegirdle, 2009, 2015; Agosta et al., 2012; Sinisalo et al., 2013; Medley et al., 2013 and Wang et al., 2015). Finally, the resulting maps of SMB can be combined with estimates of dynamical mass loss to estimate regional or continental ice sheet mass balance.
An increase in Antarctic SMB is expected in a warmer cli-mate as a result of increased precipitation when atmospheric moisture content increases (Krinner et al., 2007; Agosta et al., 2012; Ligtenberg et al., 2013; Frieler et al., 2015), with climate models on average predicting a 7.4 % precipitation increase per degree of atmospheric warming (Palerme et al., 2017). This potentially results in a mitigation of sea level rise in the future (Krinner et al., 2007; Agosta et al., 2012) ranging from 25 to 85 mm during the 21st century, depend-ing on the climate scenario (Palerme et al., 2017). However, almost all of the models in the Fifth Climate Model Inter-comparison Project (CMIP5) overestimate Antarctic precipi-tation (Palerme et al., 2017).
In order to better constrain predictions of future contribu-tions to global sea level, it is therefore of vital importance to gain a thorough understanding of past and present changes in SMB and its relationship with the climate system. Whereas the methods discussed above are invaluable in determining contemporary SMB and its spatial variability, only ice core records have the ability to investigate past SMB beyond the instrumental and satellite period. Previous studies have eval-uated ice core records to reveal an insignificant change in Antarctic accumulation rates since the 1950s (Monaghan et al., 2006a, b), and Frezzotti et al. (2013) extended this anal-ysis to conclude that the current SMB is not exceptionally high in the context of the past 800 years.
focused study of snow accumulation beyond the instrumen-tal period.
Here we compile all the available Antarctic ice core snow accumulation records as part of the PAGES (Past Global Changes) Antarctica 2k working group, an initiative of the Future Earth research platform. The aim is to improve re-gional estimates of SMB variability using well-constrained and quality-checked snow accumulation records from ice cores. We will assess the regional representativeness of ice core snow accumulation composites and the spatial pattern of variability by utilizing precipitation data derived from reanalysis products and SMB from the RACMO2.3p2 re-gional climate model. We review the dominant atmospheric drivers of regional SMB, evaluate the changes over centen-nial timescales, and place these changes in the context of the past 1000 years.
2 Data and methods
2.1 Snow accumulation from ice cores
Ice cores have the potential to record the amount of snow ac-cumulation at a specific location over a range of timescales. Barring post-depositional processes, the recorded snow accu-mulation is the net result of solid precipitation, sublimation, wind erosion or deposition, and meltwater runoff. Integrated over the AIS the contributions made by sublimation or de-position, wind redistribution, rainfall, and meltwater runoff are relatively small (van Wessem et al., 2014) and therefore the dominant component of Antarctic SMB is solid precipi-tation. Locally, however, drifting snow erosion or deposition and sublimation may play an important role, especially in re-gions of strong katabatic flow (Lenaerts and Van den Broeke, 2012).
2.2 Calculating snow accumulation and correcting for thinning and flow
Estimates of snow accumulation are based on the physi-cal distance between suitable age markers within the ice core, corrected for firn density and the integrated influ-ence of the vertical strain rate profile (so-called “layer thin-ning”). Depending on the timescale of interest, age markers may include bulk changes in isotopic composition reflecting glacial cycles, volcanic eruptions for decadal to millennial timescales, seasonal variations in stable water isotopes, and chemical species including sea salts, hydrogen peroxide, ra-dio isotopes, and biologically controlled compounds (Dans-gaard and Johnsen, 1969). Once suitable age markers have been identified, the effects of firn density can be corrected for by convolving the physical depth in the ice core (z0) by the density as a function of depth (ρ(z0)) as a fraction of a
reference density (ρref) to give an equivalent depth (z):
z= 1 ρref
z0 Z
surface
ρ(y) dy. (1)
Typically, the reference density is either the density of glacial ice (resulting in “ice equivalent” measurements) or taken as 1000 kg m−3to give “water equivalent” (w.e) results.
Finally, due to the differential vertical velocity with depth (the vertical strain rate), the distance between layers at the surface will decrease with depth. If the profile of vertical strain rate with depth is known and is assumed to be in-variant over time, then it can be corrected for. However, the vertical stain rate is typically unknown. In the absence of any other data, the vertical strain rate profile can be ap-proximated as a constant (Nye, 1963), which in general is applicable in the upper portion of the ice sheet. Further re-finement to this approximation was suggested by Dansgaard and Johnsen (1969) who proposed a piecewise linear verti-cal strain rate profile, constant in the upper portion of the ice sheet and below that decreasing linearly to zero at the base of the ice sheet, or a non-zero value in the presence of basal melt.
Roberts et al. (2015) show that a more realistic vertical strain rate profile, based on the power-law distribution of horizontal velocity of Lliboutry (1979), may provide a bet-ter estimate of strain rate even in the upper portion of the ice sheet. Additionally, recently deployed ground-based phase-sensitive ice-penetrating radar systems have demonstrated the ability to measure the vertical strain rate profile (Nicholls et al., 2015).
Uncertainties in the accumulation rate associated with the vertical strain increase with depth. Most of the ice cores in this study are relatively shallow, and therefore uncertainty in the vertical strain rate is expected to be low. Roberts et al. (2015) found the influence of the vertical strain rate model to be concentrated at lower frequency and to be small (less than 4 % of the accumulation rate).
2.3 Antarctica 2k snow accumulation database
The criteria for this study were that all ice-core-derived snow accumulation records must be published, peer reviewed, and have an annual resolution. Each record must cover at least the reference period (1960–1990) and have demonstrated that reference horizons (such as volcanic markers) were used to constrain the dating. Published dating errors range from 1– 3 years for the period 1800–2010, increasing to∼5 years for some sites prior to∼1500 AD. The published thinning function was applied to each record (from one of those de-scribed above), as this is assumed to be the most suitable for the individual site.
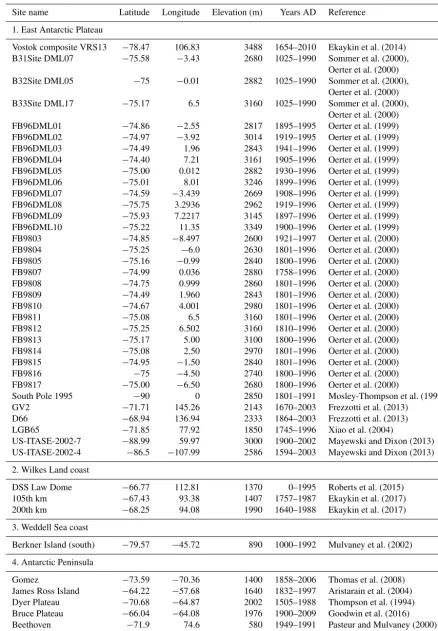
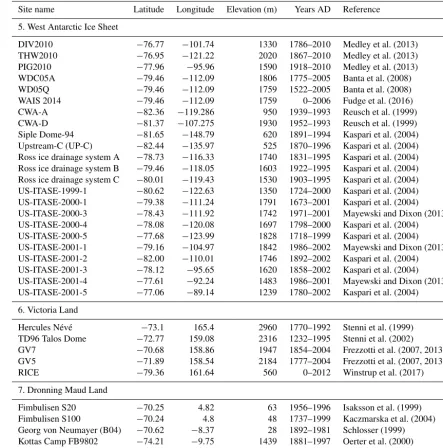
Table 1.Ice core data used in this study. Data citations can be found in Table S1 and in Thomas (2017).
Site name Latitude Longitude Elevation (m) Years AD Reference
1. East Antarctic Plateau
Vostok composite VRS13 −78.47 106.83 3488 1654–2010 Ekaykin et al. (2014) B31Site DML07 −75.58 −3.43 2680 1025–1990 Sommer et al. (2000),
Oerter et al. (2000) B32Site DML05 −75 −0.01 2882 1025–1990 Sommer et al. (2000),
Oerter et al. (2000) B33Site DML17 −75.17 6.5 3160 1025–1990 Sommer et al. (2000),
Oerter et al. (2000) FB96DML01 −74.86 −2.55 2817 1895–1995 Oerter et al. (1999) FB96DML02 −74.97 −3.92 3014 1919–1995 Oerter et al. (1999) FB96DML03 −74.49 1.96 2843 1941–1996 Oerter et al. (1999) FB96DML04 −74.40 7.21 3161 1905–1996 Oerter et al. (1999) FB96DML05 −75.00 0.012 2882 1930–1996 Oerter et al. (1999) FB96DML06 −75.01 8.01 3246 1899–1996 Oerter et al. (1999) FB96DML07 −74.59 −3.439 2669 1908–1996 Oerter et al. (1999) FB96DML08 −75.75 3.2936 2962 1919–1996 Oerter et al. (1999) FB96DML09 −75.93 7.2217 3145 1897–1996 Oerter et al. (1999) FB96DML10 −75.22 11.35 3349 1900–1996 Oerter et al. (1999) FB9803 −74.85 −8.497 2600 1921–1997 Oerter et al. (2000) FB9804 −75.25 −6.0 2630 1801–1996 Oerter et al. (2000) FB9805 −75.16 −0.99 2840 1800–1996 Oerter et al. (2000) FB9807 −74.99 0.036 2880 1758–1996 Oerter et al. (2000) FB9808 −74.75 0.999 2860 1801–1996 Oerter et al. (2000) FB9809 −74.49 1.960 2843 1801–1996 Oerter et al. (2000) FB9810 −74.67 4.001 2980 1801–1996 Oerter et al. (2000) FB9811 −75.08 6.5 3160 1801–1996 Oerter et al. (2000) FB9812 −75.25 6.502 3160 1810–1996 Oerter et al. (2000) FB9813 −75.17 5.00 3100 1800–1996 Oerter et al. (2000) FB9814 −75.08 2.50 2970 1801–1996 Oerter et al. (2000) FB9815 −74.95 −1.50 2840 1801–1996 Oerter et al. (2000) FB9816 −75 −4.50 2740 1800–1996 Oerter et al. (2000) FB9817 −75.00 −6.50 2680 1800–1996 Oerter et al. (2000)
South Pole 1995 −90 0 2850 1801–1991 Mosley-Thompson et al. (1999) GV2 −71.71 145.26 2143 1670–2003 Frezzotti et al. (2013)
D66 −68.94 136.94 2333 1864–2003 Frezzotti et al. (2013) LGB65 −71.85 77.92 1850 1745–1996 Xiao et al. (2004)
US-ITASE-2002-7 −88.99 59.97 3000 1900–2002 Mayewski and Dixon (2013) US-ITASE-2002-4 −86.5 −107.99 2586 1594–2003 Mayewski and Dixon (2013)
2. Wilkes Land coast
DSS Law Dome −66.77 112.81 1370 0–1995 Roberts et al. (2015) 105th km −67.43 93.38 1407 1757–1987 Ekaykin et al. (2017) 200th km −68.25 94.08 1990 1640–1988 Ekaykin et al. (2017)
3. Weddell Sea coast
Berkner Island (south) −79.57 −45.72 890 1000–1992 Mulvaney et al. (2002)
4. Antarctic Peninsula
Table 1.Continued.
Site name Latitude Longitude Elevation (m) Years AD Reference
5. West Antarctic Ice Sheet
DIV2010 −76.77 −101.74 1330 1786–2010 Medley et al. (2013) THW2010 −76.95 −121.22 2020 1867–2010 Medley et al. (2013) PIG2010 −77.96 −95.96 1590 1918–2010 Medley et al. (2013) WDC05A −79.46 −112.09 1806 1775–2005 Banta et al. (2008) WD05Q −79.46 −112.09 1759 1522–2005 Banta et al. (2008) WAIS 2014 −79.46 −112.09 1759 0–2006 Fudge et al. (2016) CWA-A −82.36 −119.286 950 1939–1993 Reusch et al. (1999) CWA-D −81.37 −107.275 1930 1952–1993 Reusch et al. (1999) Siple Dome-94 −81.65 −148.79 620 1891–1994 Kaspari et al. (2004) Upstream-C (UP-C) −82.44 −135.97 525 1870–1996 Kaspari et al. (2004) Ross ice drainage system A −78.73 −116.33 1740 1831–1995 Kaspari et al. (2004) Ross ice drainage system B −79.46 −118.05 1603 1922–1995 Kaspari et al. (2004) Ross ice drainage system C −80.01 −119.43 1530 1903–1995 Kaspari et al. (2004) US-ITASE-1999-1 −80.62 −122.63 1350 1724–2000 Kaspari et al. (2004) US-ITASE-2000-1 −79.38 −111.24 1791 1673–2001 Kaspari et al. (2004) US-ITASE-2000-3 −78.43 −111.92 1742 1971–2001 Mayewski and Dixon (2013) US-ITASE-2000-4 −78.08 −120.08 1697 1798–2000 Kaspari et al. (2004) US-ITASE-2000-5 −77.68 −123.99 1828 1718–1999 Kaspari et al. (2004) US-ITASE-2001-1 −79.16 −104.97 1842 1986–2002 Mayewski and Dixon (2013) US-ITASE-2001-2 −82.00 −110.01 1746 1892–2002 Kaspari et al. (2004) US-ITASE-2001-3 −78.12 −95.65 1620 1858–2002 Kaspari et al. (2004) US-ITASE-2001-4 −77.61 −92.24 1483 1986–2001 Mayewski and Dixon (2013) US-ITASE-2001-5 −77.06 −89.14 1239 1780–2002 Kaspari et al. (2004)
6. Victoria Land
Hercules Névé −73.1 165.4 2960 1770–1992 Stenni et al. (1999) TD96 Talos Dome −72.77 159.08 2316 1232–1995 Stenni et al. (2002) GV7 −70.68 158.86 1947 1854–2004 Frezzotti et al. (2007, 2013) GV5 −71.89 158.54 2184 1777–2004 Frezzotti et al. (2007, 2013) RICE −79.36 161.64 560 0–2012 Winstrup et al. (2017)
7. Dronning Maud Land
Fimbulisen S20 −70.25 4.82 63 1956–1996 Isaksson et al. (1999) Fimbulisen S100 −70.24 4.8 48 1737–1999 Kaczmarska et al. (2004) Georg von Neumayer (B04) −70.62 −8.37 28 1892–1981 Schlosser (1999) Kottas Camp FB9802 −74.21 −9.75 1439 1881–1997 Oerter et al. (2000) H72 −69.2 41.08 1214 1832–1999 Nishio et al. (2002) Derwael Ice Rise IC12 −70.25 26.34 450 1744–2011 Philippe et al. (2016)
building upon previous SMB compilation studies by Favier et al. (2013) and Frezzotti et al. (2013). Of the 79 records se-lected, 41 records extend over the past 200 years, and there-fore this period has been selected as a focus for our recon-struction. All spatial correlations, plots, and trends presented during this period (with the exception of the Weddell Sea coast, WS) are based on multiple records in each region to avoid introduced errors associated with the switch to single sites. Prior to 1800 the number of records drops dramati-cally, with only eight records covering the past 500 years, four records covering the past 1000 years, and only the Law Dome, RICE, and WAIS ice cores covering the full
2000-year period. Therefore it was decided to limit our analysis to the past 1000 years.
2.4 Modelled surface mass balance
ear-lier reanalyses (Bromwich et al., 2011; Bracegirdle and Mar-shall, 2012). A recent evaluation of 3265 multiyear averaged in situ observations concluded that ERA-Interim exhibits the highest performance in capturing interannual variability in observed Antarctic precipitation of the available reanalysis products (Wang et al., 2016).
In addition, we use the latest version of RACMO ver-sion 2.3p2 (RACMO2.3p2), which succeeds RACMO2.3 (Van Wessem et al., 2014) and combines the hydrostatic dynamics of the High Resolution Limited Area Model (HIRLAM) with the physics package of the ECMWF Inte-grated Forecast System. RACMO2.3p2 has been specifically adapted for use over glaciated regions, as it is coupled to a multilayer snow model (Ettema et al., 2010) that calculates processes in the firn, such as grain size growth, firn com-paction, meltwater percolation or retention, and meltwater runoff. As it also includes a drifting snow routine that calcu-lates sublimation and divergence or convergence of blowing snow (Lenaerts et al., 2012), RACMO2.3p2 explicitly calcu-lates all SMB components over the AIS.
ERA-Interim reanalysis data (Dee et al., 2011) force the model at its lateral boundaries and prescribe sea surface tem-perature and sea ice cover for the period 1979–2015. The re-laxation zone, where the forcing is applied to RACMO2.3p2, is located over the oceans so that the model is able to evolve freely over the continent. An important update in RACMO2.3p2 with respect to RACMO2.3 is the addition of upper-air relaxation at the two top model layers as described in Van de Berg and Medley (2016); this improves the inter-annual variability of the modelled SMB, which now better matches annually resolved ice core records.
2.5 Defining the regions
One of the goals of this paper is to investigate the regional differences in snow accumulation and reduce the bias intro-duced in previous continental reconstructions, in which re-gions of high data density overpower the signal in data-sparse low-elevation and coastal zones. Therefore, the Antarctic continent is divided into seven geographical regions (Fig. 1), each with distinct climates. The East Antarctic Plateau (EAP) corresponds to locations in East Antarctica above 2000 m of elevation, allowing for the separation of ice cores with a continental signal from those with a marine signature. The coastal regions of East Antarctica were separated into DML, defined as the areas between 15◦W and 70◦E, Wilkes Land coast (WL; 70–150◦E), and Victoria Land (VL; 150– 170◦E). The Weddell Sea coast (WS) covers the Ronne–
Filchner Ice Shelf and into Coats Land (60–15◦W). Note
the difference from the common usage of the geographical names; DML and WL in our definition refer only to the coastal regions, whereas the higher-altitude regions belong to EAP. In this study the AP is treated separately from the West Antarctic Ice Sheet (WAIS), with a division at 88◦W.
2.6 Methods for composite time series
The ice cores were first separated into geographical regions (Fig. 1a) and normalized based on the mean and standard deviation during the reference period 1960–1990. Based on the defined boundaries, the largest density of data is the EAP (accounting for 45 % of the records); nevertheless, the spatial distribution of the data is often poor. There are inadequate records in high-accumulation coastal and slope areas and in the vast polar plateau, where snow accumulation is lower than 70 mm w.e. yr−1 and seasonally deposited chemical or physical signals are frequently erased or changed by the ac-tion of the near-surface wind (Eisen et al., 2008). To avoid biases introduced because of high data density, which is es-pecially relevant in areas such as EAP and WAIS, records from the same grid box (chosen with a size of 2◦ latitude and 10◦longitude) were averaged together. The standardized records were then averaged together to form the standardized regional composites.
3 Results and discussion
3.1 Representative of regional SMB?
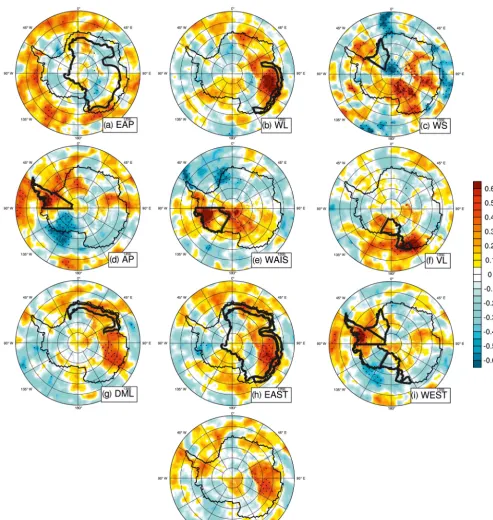
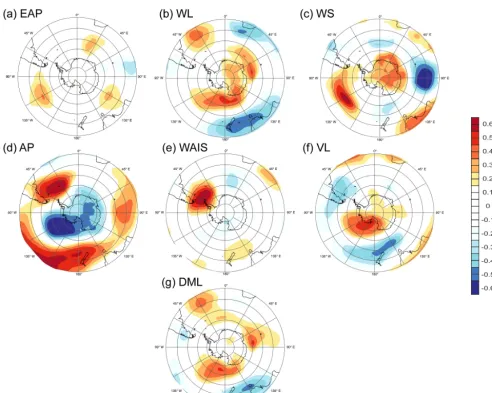
Due to small-scale variations in surface slope and roughness, the snow accumulation at an ice core site may vary somewhat from the local spatial mean. The comparison between the an-nual average snow accumulation at each site and the anan-nual average SMB from RACMO2.3p2 since 1979 is shown in Fig. 1b. Individual sites where the correlation is significant atp> 0.05 are highlighted in Fig. 1a. Before we investigate the temporal changes in the records we first establish how representative each composite is of regional SMB by testing annual average snow accumulation against annual average (January to December) SMB from RACMO2.3p2 (Fig. 2) and precipitation from ERA-Interim (Fig. 3; direct SMB is not available from the reanalysis product). Areas of high cor-relation (red) indicate that a large fraction of snow accumu-lation variability in the composite time series is explained by the modelled SMB or precipitation variability during the pe-riod 1979–2010. The cut-off of 2010 was chosen as very few records extend beyond this.
Figure 1.(a)Location of all ice cores and the regional boundaries used in this study. EAP (blue), WL (cyan), WS (green), AP (yellow), WAIS (orange), VL (red), and DML (brown). Stars denote sites where correlation between ice core snow accumulation and RACMO2.3p2 SMB is significant atp< 0.05.(b)RACMO2.3p2 SMB (1979–2016) overlain with ice core SMB since 1979 at each location.
2015), from positive at the start of the period (1977–1997) to negative from the late 1990s. The Southern Annular Mode (SAM), the dominant mode of atmospheric variability in the Southern Hemisphere, is predominantly in its positive phase during this period, which has been demonstrated to influence precipitation, especially in AP (Thomas et al., 2008; Abram et al., 2014) and WAIS (Fogt et al., 2012; Raphael et al., 2016). Therefore, some care must be taken when extrapo-lating results beyond the instrumental period.
Despite the good agreement in most regions, the opposite is true for the records from EAP and WS. WS represents a single ice core and therefore we have been unable to re-duce the signal-to-noise ratio achieved in the regions with multiple records spread over a large area. The poor relation-ship between snow accumulation and precipitation at this site may be a result of post-depositional changes at the coastal dome or reflect the model inability to capture precipitation and SMB variability at this site. In addition, there is a rela-tively small period of overlap with the modelled and reanal-ysis datasets (1979–1992).
The EAP has many records that cover the full calibration period (1979–2010), but they are restricted in the area of the DML plateau around Kohnen Station, the South Pole, and Talos Dome, while the inner part is represented only by the Vostok site. As such, the EAP composite is poorly related to SMB (Figs. 2a and 3a), but reducing the EAP area and producing smaller “subregions” is no improvement. One possible explanation is that the models do not take into account precipitation processes such as diamond dust that likely have a relatively large influence on precipitation vari-ability in these extremely cold areas (van de Berg et al., 2005;
Mahesh et al., 2001). Additionally, large glaze and/or dune fields cover a large percentage (more than 500 000 km2) of the EAP (Fahnestock et al., 2000) and these have been shown to significantly confound accumulation measurements in ice cores (Dixon et al., 2013). A combination of large topograph-ical gradients and strong katabatic winds provides challenges for models in the grounding line area and this is where the largest differences appear between field data and the mod-elled SMB (e.g. Sinisalo et al., 2013). Large areas along the margins of the EAP are characterized by steep slopes and thus often suffer from challenges in describing the physical processes related to SMB in the lower-resolution model do-mains.
Figure 2.Spatial correlation plots of standardized regional and continental composites of snow accumulation with SMB from RACMO2.3p2 (1979–2010). Grid points with > 95 % significance are dotted. Note that correlation with WS only covers the period 1979–1992.
composite by adopting a similar approach to previous SMB studies focusing on continental reconstructions (e.g. Mon-aghan et al., 2006a; Frezzotti et al., 2013). Evaluation with RACMO2.3p2 (Fig. 2) and ERA-Interim (Fig. 3) confirms that continental-style reconstructions reduce the representa-tiveness of SMB and are susceptible to bias from highly
Figure 3.Spatial correlation plots of standardized regional and continental composites of snow accumulation with precipitation from ERA-Interim (1979–2010). Grid points with > 95 % significance are dotted. Note that correlation with WS only covers the period 1979–1992.
Spatial correlation plots with SMB from RACMO2.3p2 (Fig. 2) and precipitation from ERA-Interim (Fig. 3) high-light some interesting relationships. Significant positive cor-relations with precipitation in AP are mirrored by negative correlations in WAIS, especially the region around Marie Byrd Land (Figs. 2d and 3d). The relationship is reversed
This persistent area of low pressure, the result of the fre-quency and intensity of individual cyclones (Baines and Fraedrich, 1989; Turner et al., 2013), is known to affect the climatic conditions on the AP and WAIS (Hosking et al., 2013; Thomas et al., 2015; Raphael et al., 2016).
In East Antarctica, positive correlations exist between WL and DML due to similar synoptic regimes and the influence of changes in the general atmospheric circulation, such as the Southern Annular Mode (SAM; e.g. Marshall, 2003) or zonal wave number 3 (ZW3) index (Raphael, 2007). We explore the drivers of regional SMB further by using the available meteorological data from ERA-Interim together with satel-lite observations of sea ice conditions.
3.2 Drivers of regional precipitation 3.2.1 East Antarctic Plateau (EAP)
Accumulation in EAP is generally extremely low (< 50 mm yr−1 on the high plateau) and exhibits high interannual variability. The temporally prevailing type of precipitation is diamond dust consisting of very fine needles or platelets formed when air in an almost saturated atmosphere is further cooled radiatively or mixed with the colder air of the inversion layer (Stenni et al., 2016; Walden et al., 2003). Much less frequently, synoptically caused snowfall occurs, which typically has daily amounts an order of magnitude higher than diamond dust precipitation. Thus a few snowfall events per year can yield up to 50 % of the annual accumulation. The occurrence of such event-type precipitation is closely related to the amplification of Rossby waves, sometimes with corresponding blocking anticyclones (e.g. Massom et al., 2004), and is thus more frequent in the negative state of the SAM or positive ZW3 index (Raphael, 2007; Schlosser et al., 2016) when the meridional exchange of heat and moisture is increased. This agrees well with the pattern in Fig. 4a, which shows three distinct maxima in the correlation of SMB and the 850 hPa geopotential height above the Southern Ocean between ca. 60 and 45◦S, south of South Africa and Australia and west of South America, respectively. A similar pattern is observed when comparing the SMB from RACMO2.3p2 with 850 hPa geopotential height (Fig. S2), adding confidence that the ice core composite and the modelled SMB are influenced by similar atmospheric drivers. This spatial pattern is most likely due to the above-mentioned positive ZW3 index related to distinct troughs and ridges in the westerlies, which cause the advection of relatively warm and moist air to the interior of the continent (Noone et al., 1999; Schlosser et al., 2008, 2010a, b; Massom et al., 2004). There is no straightforward correlation with sea ice extent (Fig. 5a).
Ice and firn cores from EAP do not exhibit a uniform tem-poral trend. At Kohnen Station (EPICA DML drilling site), which is situated at 2892 m of elevation at the slope, an in-crease in SMB was found in the past 2 centuries (Oerter et al., 2000; Altnau et al., 2015). This is parallel to an increase in temperature (derived from stable isotopes) and thus most likely caused thermodynamically (Altnau et al., 2015). An-schütz et al. (2009, 2011) found no clear overall trend in SMB based on data from a traverse from coastal DML to the South Pole, with an increase at some sites and a decrease at others. However, above 3200 m, all sites exhibited a de-crease in SMB since 1963. Fujita et al. (2011) report that SMB data from a traverse between Dome Fuji and EPICA DML is strongly influenced by topography and is found to be approximately 15 % higher in the second half of the 20th century than averages over centennial or millennial averages. No significant trend was found in accumulation rates in cores up to 100 years old before 1996 from Amundsenisen in DML (Oerter et al., 1999). The Dome C area (Frezzotti et al., 2005; Urbini et al., 2008) has exhibited high accumulation since the 1960s, as observed along the traverse between Dome Fuji and EPICA DML, whereas no significant changes have been ap-parent at Dome A since 1260 (Ding et al., 2011; Hou et al., 2009). In the Talos Dome area at the border between EAP and VL, century-scale variability shows a slight increase (of a few percent) in accumulation rates over the last 200 years, in particular since the 1960s, compared with the period 1816– 1965 (Frezzotti et al., 2007).
3.2.2 Wilkes Land coast (WL)
The snow accumulation regime of Law Dome is determined by the intensity of the onshore transport of maritime air masses by cyclonic activity (Bromwich, 1988). While the magnitude of snow accumulation varies along the Wilkes Land coast, the accumulation is temporally coherent at least as far away as the Shackleton Ice Shelf (Roberts et al., 2015). In general, this region shows accumulation variability asso-ciated with both ENSO and IPO (Roberts et al., 2015; Vance et al., 2015), which influence the meridional component of the large-scale circulation (van Ommen and Morgan, 2010; Roberts et al., 2015; Vance et al., 2015).
Law Dome sea ice proxies (Curran et al., 2003; Valle-longa et al., 2017) are correlated with observations of sea ice extent. The weak negative correlation between WL accu-mulation and sea ice concentration (Fig. 5b) may be indica-tive of a common forcing from cyclonic systems depositing snow over Law Dome while also contributing to local sea ice break-up and/or dispersion.
3.2.3 Weddell Sea coast (WS)
Figure 4.Spatial correlation plots of standardized regional snow accumulation composites with annual 850 hPa geopotential heights from ERA-Interim (1979–2010). Grid points with > 95 % significance are dotted. Note that correlation with WS only covers the period 1979–1992.
the southern Indian Ocean (Fig. 4c). However, this is based on just one ice core which is poorly related to modelled SMB and precipitation. Figure 5c suggests that snow accumula-tion is associated with sea ice concentraaccumula-tion in the Weddell Sea, possibly resulting in enhanced moisture availability or reflecting an anticyclone that could draw more northerly air masses to the site. Unfortunately the reduced period of over-lap for this site (1980–1992) makes the interpretation less reliable.
In order to establish the expected atmospheric drivers and relationship with sea ice, we repeat the spatial correlation plots in Figs. 4 and 5 using RACMO2.3p2 SMB. The re-lationship with 850 hPa geopotential height is reversed when using the modelled SMB, with negative correlations over the Antarctic continent, especially over the Bellingshausen Sea (Fig. S2c), reminiscent of the pattern for AP (Figs. 4d and S1d). The strong correlations with sea ice concentration also
disappear when using the modelled SMB, suggesting a posi-tive correlation with sea ice in the Bellingshausen and north-western Weddell Sea (Fig. S3c).
3.2.4 Antarctic Peninsula (AP)
Figure 5.Spatial correlation plots of standardized regional snow accumulation composites with annual sea ice concentration from bootstrap analysis (1981–2010). Grid points with > 95 % significance are dotted. Note that correlation with WS only covers the period 1979–1992.
highest interannual and seasonal variability. High snow accu-mulation is associated with reduced regional SLP, leading to strengthened circumpolar westerlies and enhanced northerly flow. The mechanism of lower SLP in the Amundsen Sea sector creates a dipole pattern of enhanced precipitation in Ellsworth Land and reduced precipitation over western West Antarctica (Thomas et al., 2015), reflecting the clockwise ro-tation of air masses and moisture advection paths and ex-plaining the dipole of correlations observed in Figs. 2 and 3.
AP ice cores reveal a significant increase in snowfall dur-ing the 20th century (Thomas et al., 2008, 2015; Goodwin et al., 2016), which has been linked to the positive phase of the SAM, marked by high pressure anomalies in the mid-latitudes and stronger circumpolar westerly winds since the 1970s. ENSO also plays a role through the modulation of the South Pacific Convergence Zone (IPCZ); however, the
relationship between snow accumulation and both SAM and ENSO is not temporally stable (Thomas et al., 2008, 2015; Goodwin et al., 2016). It has been suggested that the coupling between these two modes of variability modulates snow ac-cumulation in the AP (Clem and Fogt, 2013) and may explain the acceleration since the 1990s when both modes are in-phase. The increased snowfall has also been linked to warm-ing sea surface temperatures in the western Pacific (Thomas et al., 2015), an area not associated with ENSO, and with the phase changes of the Pacific Decadal Oscillation (PDO), which exhibits major phase shifts in the late 1940s and mid-1970s (Goodwin et al., 2016).
ocean and the atmosphere. Sea ice reconstructions have re-vealed a 20th century decline in sea ice in the Bellingshausen Sea (Abram et al., 2010) and evidence that the current rate of sea ice loss is unique for the post-1900 period (Porter et al., 2016). The result is enhanced availability of surface level moisture and increased poleward atmospheric moisture transport (Tsukernik and Lynch, 2013). This was used to ex-plain the longitudinal differences between AP ice core sites (Thomas et al., 2015), with the least significant changes in accumulation in Ellsworth Land and the greatest changes ob-served in the south-western AP where adjacent sea ice ex-hibits the largest decreasing trend (Turner et al., 2009).
3.2.5 West Antarctic Ice Sheet (WAIS)
The WAIS region has been comparatively well sampled (Fig. 1) with records covering a large portion of the area and spanning many centuries. Although accumulation rates are relatively high, firn cores recovered as part of the WAIS Di-vide ice core project have proDi-vided records covering the past 2000 years. Because of its complex topography and divide geometries, the WAIS region is commonly differentiated into two smaller regions: the Amundsen Sea sector, home to Pine Island and Thwaites Glacier, and the Ross Sea sector where the Siple Coast ice streams flow into the Ross Ice Shelf.
[image:13.612.313.543.64.485.2]The low-elevation terrain of the Amundsen Sea sector pen-etrates far into the interior; thus, the region is subject to fre-quent warm, marine air intrusions that bring cloud cover, higher amounts of snowfall, and higher temperatures (Nico-las and Bromwich, 2011). In general, the accumulation gra-dient is dependent on elevation; however, terrain geometry plays an important role. The steep coastal region of Marie Byrd Land receives relatively high accumulation because of orographic lifting, while the region directly south in the cipitation shadow of the Executive Committee Range is pre-cipitation starved. Thus, the highest accumulation rates are found on the low-elevation coastal domes and much of the interior of the Amundsen Sea sector where marine air intru-sions bring moisture and heat (Nicolas and Bromwich, 2011). Because of the ice sheet geometry, the accumulation records from the Amundsen Sea sector are poorly correlated with those from the Ross Sea sector. Correlation of the WAIS record with RACMO2.3p2 SMB and ERA-Interim precipita-tion shows a very strong resemblance to the Amundsen Sea sector and a very weak relationship with the Ross Sea sec-tor (Figs. 2e and 3e). Even though there are records from the Ross Sea sector (Fig. 1), they are largely out of date, cover-ing up to the middle to late 1990s. Records from the Amund-sen Sea sector provide data up to 2010; thus, the most re-cent decade of the WAIS record is composed of records only from the Amundsen Sea sector, which has a stronger correla-tion with modelled SMB. This limitacorrela-tion must be considered when evaluating the drivers of WAIS accumulation.
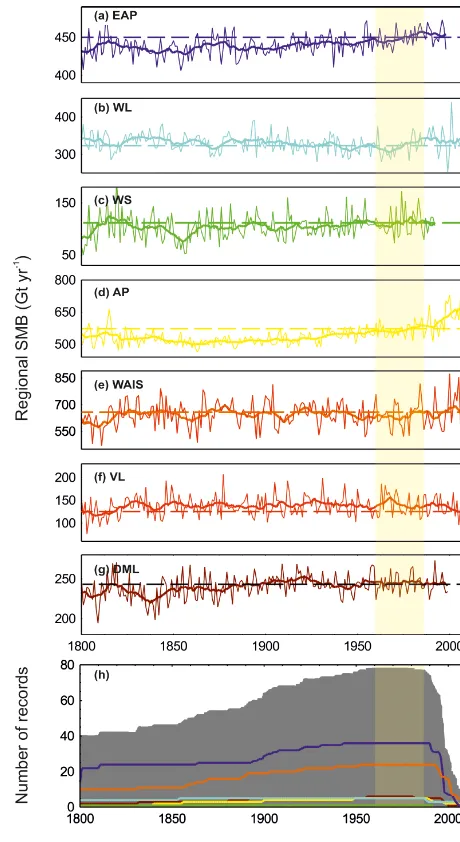
Figure 6.Regional SMB composites (1800–2010 AD) shown as annual averages (thin lines) and 5-year means (thick lines) for(a– g)the East Antarctic Plateau (EAP, dark blue); Wilkes Land coast (WL, cyan), Weddell Sea coast (WS, green), Antarctic Peninsula (AP, yellow), West Antarctic Ice Sheet (WAIS, orange), Victoria Land (VL, red), and Dronning Maud Land (DML, brown). Panel(h)
represents the total number of records (solid grey) and the number of records by region.
(Kas-pari et al., 2004; Nicolas and Bromwich, 2011; Thomas et al., 2015).
3.2.6 Victoria Land (VL)
For the purpose of this paper, we cluster records derived from the Ross Ice Shelf and the coastal regions (below 2000 m of elevation) of the Transantarctic Mountains (TAM) into VL (Fig. 1). Despite its geographical diversity ranging from a low-lying, flat ice shelf to the east (towards West Antarc-tica) to a steep relief in the west (towards East AntarcAntarc-tica), this region is dominated by cyclonically driven snow accu-mulation sensitive to tropical and local climate drivers that significantly impact the wider region (Bertler et al., 2017; Emanuelsson et al., 2017).
Accumulation in northern Victoria Land, where the coast faces north, comes primarily from storms in the Indian Ocean (Scarchilli et al., 2011), with the origin of air masses similar to that of adjacent Wilkes Land. However, the Transantarc-tic Mountains block flow to southern Victoria Land so that this region is influenced by storms that cross the Ross Sea (Sodeman and Stohl, 2009). As a consequence, the snow ac-cumulation rates are higher in northern and southern Victoria Land, while the middle region (including the McMurdo Dry Valleys) lies in the precipitation shadows of cyclones from the north and the south, experiencing overall lower snow ac-cumulation rates (Sinclair et al., 2010).
Accumulation across the Ross Ice Shelf and southern VL is linked to that of the AP and WAIS through the position and intensity of the ASL, which affects the frequency and trajectory of storms in the Ross Sea (Raphael et al., 2016; Turner et al., 2013; Fogt et al., 2012; Bertler et al., 2004). Markle et al. (2012) also found that the phase of ENSO, but not SAM, affected the frequency of Ross Sea storms reach-ing southern VL. In particular, blockreach-ing (ridgreach-ing) events with a position and frequency determined by the intensity and po-sition of the ASL (Renwick, 2005) have been identified as a major driver of snow precipitation in the eastern Ross Sea re-gion, enhancing meridional flow across the eastern Ross Sea (Emanuelsson et al., 2017). The principal tropical telecon-nection associated with the Rossby wave propagation from the western tropical Pacific exerts its influence on the entire Ross Sea region, with opposing influence between the east and west (Raphael et al., 2016; Bertler et al., 2017), which explains some of the differences observed in these two re-gions.
The availability of local moisture from open water in the Ross Sea is also associated with high-accumulation events (Sinclair et al., 2013). Furthermore, riming (deposi-tion) might contribute as much as 28 % of all precipitation events, in particular during winter at sites in the vicinity of polynyas, such as RICE (Tuohy et al., 2015). As rime is poorly captured in reanalysis data, the potentially significant contribution of rime at particular sites might be an important
consideration in understanding regional precipitation differ-ences.
The VL composite has the greatest correlation with precip-itation in the northward-facing section of VL and the western portion of the Ross Sea (Fig. 3f). The correlation in the TAM is low, likely due to topographic complexity. The VL com-posite is positively correlated with geopotential heights in the eastern Ross Sea (Fig. 4f), illustrating the connection to the ASL, which is more pronounced for Roosevelt Island than for Talos Dome and Hercules Névé. The pattern resembles that of AP, although weaker and opposite in sign. When the ASL is shifted to the west, weaker storms more frequently penetrate into VL rather than being focused in central WAIS and AP.
3.2.7 Dronning Maud Land (DML)
Precipitation in coastal DML is closely connected to synop-tic activity in the circumpolar trough and related frontal sys-tems. Interannual variability in both temperature and precip-itation is influenced by SAM, which partly determines the amount of the meridional exchange of heat and moisture. Generally, precipitation decreases from the coast towards the interior and local maxima can occur at the windward side of topographic features, such as ice rises on ice shelves or steep slopes of the escarpment (Rotschky et al., 2007; Schlosser et al., 2008; Vega et al., 2016). Katabatic winds also influence SMB, especially at the grounding line, at the transition of ice shelf and grounded ice, leading to negative SMB values due to wind erosion and increased evaporation (Sinisalo et al., 2013; Schlosser et al., 2014).
The correlation plot of SMB and 850 hPa geopotential height (Fig. 4g) exhibits three distinct maxima above the Southern Ocean; however, compared to EAP they are situ-ated closer to the coast and shifted in longitude by approx-imately 30◦. This also hints at a ZW3 pattern. There is also a fairly strong positive correlation with sea ice extent in the north-western Weddell Sea and a rather weak negative corre-lation with the area between 0 and 30◦E (Fig. 5g). A plausi-ble explanation for this could be that positive sea ice anoma-lies in the northern part of the Weddell Sea are often related to a comparably strong south-westerly flow that, taking into account Ekman transport, pushes the ice away from the coast; at the same time, new ice is formed close to the coast due to cold air advection and reopened polynyas (e.g. Schlosser et al., 2011). The compensating north-westerly flow further east could enhance precipitation in DML.
the last 100 years (e.g. Kaczmarska et al., 2004). This sug-gests that the SMB and precipitation in DML are influenced by atmospheric flow conditions, i.e. dynamically rather than thermodynamically as at EAP (Altnau et al., 2015).
3.3 Regional precipitation variability over the past 200 years
The standardized regional composites have been con-verted into records of SMB based on SMB extracted from RACMO2.3p2. We use a geometric mean regression tech-nique, which allows for error in both the modelled SMB and the ice core snow accumulation (Smith, 2009), to convert the unitless standardized regional composites into regional SMB (Gt yr−1). This method allows for error in both the regional composites and the RACMO2.3p2 data and has been widely used for other ice core proxies, for example regressing sea ice proxies onto satellite-derived records of winter sea ice extent (Abram et al., 2010; Thomas and Abram, 2016).
The regional SMB records reveal significant variability since 1800 AD (Fig. 6). With the exception of WL (Fig. 6b), all regions exhibit an increasing trend in SMB, with statis-tically significant trends in the EAP, WS, and DML (+0.83, +0.83 and+0.96 Gt decade−1). The largest increase is ob-served in the AP where SMB has increased at a rate of 4.3 Gt decade−1, representing a total increase in SMB of 123±44 Gt yr−1 between the average in the first decade (1801–1810) and the average in the last decade (2001–2010). The 20th century increase observed in AP (Fig. 6d) is unusual in the context of the past 200 years. In this re-gion, the annual average SMB during the most recent period is 88±49 Gt yr−1 higher than the reference period (1961– 1990) and the running decadal mean during the early 2000s exceeds 2 standard deviations above the record average for the entire 300-year period. SMB in the AP has been increas-ing at a rate of 12 Gt decade−1since 1900 (p< 0.01), equiv-alent to a 138±58 Gt yr−1 (∼20 %) increase between the decadal average at the start of the 20th century (1901–1910) and the decadal average at the start of the 21st century (2001– 2010). As observed in previous studies the increase in SMB in the AP began in∼1930 and accelerated during the 1990s (Thomas et al., 2008, 2015; Goodwin et al., 2016).
Histograms of running 50-year and 100-year trends are shown in Fig. 8. For AP, the positive trends observed in the most recent 50-year and 100-year period (1960–2010 and 1910–2010) are the highest since 1800 AD and both signif-icant at p< 0.01. Conversely in VL, the negative trends ob-served during the same period are the lowest since 1800 AD, significant for the 50-year trend (p< 0.01) but not the 100-year trend. The rate of increase in snowfall in AP and the opposing decrease in VL during the late 20th and early 21st century are exceptional in the context of the past 200 years and reflect the influence of the ASL, especially since the 1990s when SAM and ENSO are in-phase and the tropical teleconnection was strongest.
In DML, two of the three records which cover the entire 20th century reveal a decreasing trend. However, the Der-wael Ice Rise record reveals a statistically significant in-crease in snow accumulation during the 20th century, result-ing in the most recent 50-year trend in DML (p< 0.05) sit-ting outside of the expected range for the previous 200 years (Fig. 8g). Snow accumulation at this low-elevation coastal site has been related to sea ice and atmospheric circulation patterns (Philippe et al., 2016), with SMB during the most recent decade (2000–2010) 5 % higher than the reference pe-riod.
The most recent 50-year and 100-year trends for the other regions (EAP, WS, and WAIS) fall within the range of ex-pected variability. In WL, the most recent 100-year trend is outside of the expected range, but it is not significant at p< 0.10.
3.4 Regional precipitation variability over the past 1000 years
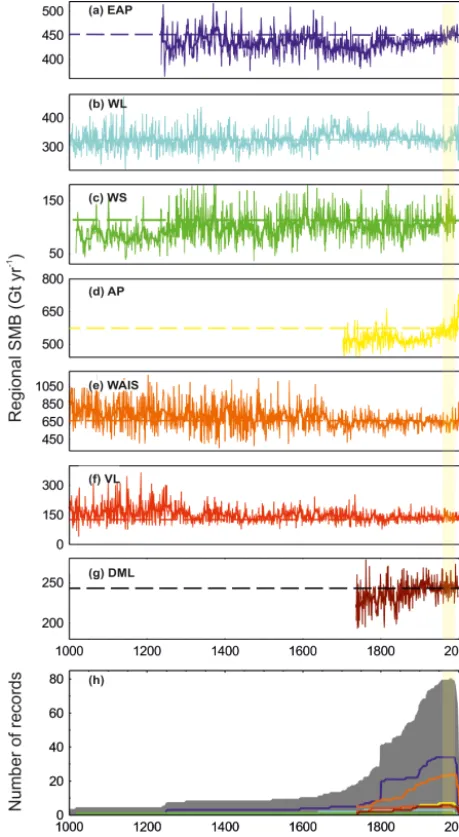
To assess the significance of the recent trends we extend the records back 1000 years (Fig. 7). Only the Law Dome, RICE, WAIS, and Berkner ice cores cover the full period and the increased variability in these regions beyond∼1400 AD is an artefact of the shift from multiple to single sites.
There is considerable interannual and multi-decadal vari-ability in all records; however, there is little consistency or commonality between regions. Previous studies have related Antarctic SMB changes to solar irradiance (Frezzotti et al., 2013), with three periods of low accumulation variability identified at 1250–1300, 1420–1550, and 1660–1790 AD that correspond to periods of low solar activity. A decrease in snow accumulation for the entire Little Ice Age (defined as∼1300–1800 AD) was also observed in the western Ross Sea by a lower-resolution record (Bertler et al., 2011). Exam-ination of our regional composites over the past 1000 years indicates that this may be restricted to the EAP and per-haps small regions not captured in this array, with little evi-dence for a large-scale reduction in variability related to solar variability in other regions. The relatively low accumulation over EAP, combined with the major (> 50 %) contribution of non-synoptic precipitation, may explain the stronger influ-ence of solar variability over EAP, while local wind regimes in the TAM have been shown to be sensitive to solar radi-ation (Bertler et al., 2005). However, the updated network presented here suggests that the strong synoptic influence on coastal regions is likely to outweigh any direct solar influ-ence.
4 Total Antarctic SMB change
Figure 7.Regional SMB composites (1000–2010 AD) shown as annual averages (thin lines) and 10-year running means (thick lines) for(a–g)the East Antarctic Plateau (EAP, dark blue); Wilkes Land coast (WL, cyan), Weddell Sea coast (WS, green), Antarctic Penin-sula (AP, yellow), West Antarctic Ice Sheet (WAIS, orange), Vic-toria Land (VL, red), and Dronning Maud Land (DML, brown). Panel(h) represents the total number of records (solid grey) and the number of records by region.
RACMO2.3p2 have been used to extend the reconstructions in EAP and WS to 2010 in line with the other regions.
[image:16.612.323.532.76.643.2]The total Antarctic SMB increased at a rate of 7±1.3 Gt decade−1 between 1800 and 2010 AD and 14±1.8 Gt decade−1 since 1900 AD (Fig. 9). The annual average SMB for the AIS was 272±29 Gt yr−1higher dur-ing the first decade of the 21st century compared to the first decade of the 19th century. This equates to a relative reduc-tion in sea level of 0.02 mm decade−1 since 1800 AD and
Figure 9. (a)Total AIS SMB derived from 80 ice core records (blue) and RACMO2.3p2 (red) as annual averages (dashed lines) and 10-year averages (solid line). The solid horizontal line represents the record average and the dashed horizontal lines are 1 and 2 standard deviations above and below this.(b) Histogram of 50-year (light shading) and 100-year (darker shading) trends in AIS SMB. The solid vertical line represents the most recent 50-year trend and the dashed vertical line the most recent 100-year trend (2010–1961 and 2010–1911, respectively).
0.04 mm decade−1since 1900 AD, with the increased SMB acting to mitigate sea level rise as predicted under future warming scenarios (Palerme et al., 2017). The estimated sea level reduction resulting from the increased snowfall since 1800 AD is comparable with the estimated mass loss and subsequent sea level contribution from the southern Patago-nian ice fields (Glasser et al., 2011).
The largest (area-weighted) increase in SMB is observed in the AP, accounting for∼75 % of the total Antarctic SMB increase since 1900. Despite the relatively low annual snow-fall, the EAP is the second-highest contributor (10 %) due to its extremely large area.
Only four records cover the full 1000 years (Fig. 7). The combined SMB in these regions (WAIS, WL, WS, and VL) suggests a decline of ∼1.4 Gt decade−1 since 1000 AD. However, it is important to note that these four regions rep-resent just∼30 % of the total area of Antarctica and in the case of WS, doubt exists as to how regionally representative the record is. Evidence from the 20th century suggests that even small changes in SMB, in either the low-accumulation EAP region or the high-accumulation AP region, can have significant impacts on the total Antarctic SMB budget.
5 Conclusions
As part of the Antarctica 2k community effort, we present regional snow accumulation composites to investigate snow accumulation variability over the past 1000 years. Eighty ice core snow accumulation records were quality checked and separated into seven geographical regions to reduce the
bias towards over-represented regions and separate the accumulation coastal zones from the low-accumulation high-elevation sites.
The snow accumulation records from each region were evaluated against SMB from RACMO2.3p2 and precipitation from ERA-Interim. With the exception of the EAP and WS region, the regional composites capture a large proportion of the regional SMB and precipitation variability. The lack of correlation in the EAP is likely due to the greater influ-ence of wind (erosion or deposition), sublimation, and post-depositional processes (surface glazing and dune formation) in the interior than in coastal regions. Another explanation is that the models cannot capture processes such as the deposi-tion of diamond dust that likely have a relatively large influ-ence on precipitation variability in these extremely cold areas (van de Berg et al., 2005; Mahesh et al., 2001). Either way, the lack of coherency in trends from ice core records across the central Antarctic Plateau suggests that ice core snow ac-cumulation records from this region are less well suited to studies investigating temporal changes in Antarctic SMB.
(Mon-aghan et al., 2006a) and that the current SMB is not excep-tionally high compared to the past 800 years (Frezzotti et al., 2013). Later studies did acknowledge high SMB in coastal regions since the 1960s; however, these studies were hin-dered by a lack of recent records (especially from the coastal zones) and were heavily weighted by the EAP region. Recent drilling campaigns and the collation of records as part of the Antarctica 2k programme have allowed us to better represent several important regions and derive a more accurate repre-sentation of SMB changes over the past 200 years.
The inclusion of new snow accumulation records that cover the past 1000 years has provided valuable information about SMB changes in certain regions; however, estimating Antarctic SMB using these sites alone would be misleading. For example, based on the four available records which cover the past 1000 years there is evidence for a decreasing trend in SMB since 1000 AD. However, the combined regional representation of these records is less than 30 % of the to-tal Antarctic continent and includes single ice core sites with only limited regional representation in SMB. Our findings suggest that small changes in the high-accumulation AP, or the low-accumulation but geographically much larger EAP region, could change the sign and significance of the total Antarctic SMB trend dramatically.
Greater spatial representation (especially WS and EAP) and the inclusion of sufficiently deep ice cores from high-accumulation coastal zones (especially AP and DML) are vi-tal to our understanding of the true nature of Antarctic SMB in the past and to providing an accurate benchmark for how SMB may change in the future.
Data availability. The original snow accumulation data and the composite records produced in this study are available from the UK Polar Data Centre (Thomas, 2017) or by contacting Eliza-beth R. Thomas ([email protected]). The complete data citation from all data used in this study is presented in Table S1 and stored along-side the original data and the composite data at the UK Polar Data Centre. The ECMWF ERA-Interim data and the RACMO data used in the spatial correlations are available at http://apps.ecmwf.int/ datasets/ and https://www.projects.science.uu.nl/iceclimate/models/ antarctica.php.
The Supplement related to this article is available online at https://doi.org/10.5194/cp-13-1491-2017-supplement.
Competing interests. The authors declare that they have no con-flict of interest.
Special issue statement. This article is part of the special issue “Climate of the past 2000 years: regional and trans-regional synthe-ses”. It is not associated with a conference.
Acknowledgements. This is a contribution to the PAGES 2k Network (through the Antarctica 2k project). Past Global Changes (PAGES) is supported by the US National Science Foundation and the Swiss Academy of Sciences. The project was also supported by the British Antarctic Survey (Natural Environment Research Council). We would like to thank the Antarctic ice core community for making their snow accumulation data available for this study and thank the data managers and PAGES team for their support. We thank two anonymous reviewers and the data review team for their comments and suggestions.
Edited by: Christian Turney
Reviewed by: two anonymous referees
References
Abram, N. J., Thomas, E. R., McConnell, J. R., Mulvaney, R., Bracegirdle, T. J., Sime, L. C., and Aristarain, A. J.: Ice core evidence for a 20th century decline of sea ice in the Bellingshausen Sea, Antarctica, J. Geophys. Res., 115, D23101, https://doi.org/10.1029/2010JD014644, 2010.
Abram, N. J., Mulvaney, R., Vimeux, F., Phipps, S. J., Turner, J., and England, M. H.: Evolution of the Southern Annular Mode during the past millennium, Nat. Clim. Change, 4, 564–569, 2014. Agosta, C., Favier, V., Genthon, C., Gallée, H., Krinner, G.,
Lenaerts, J. T. M., and van den Broeke, M. R.: A 40-year accumulation dataset for Adelie Land, Antarctica and its ap-plication for model validation, Clim. Dynam., 38, 75–86, https://doi.org/10.1007/s00382-011-1103-4, 2012.
Allison, I., Alley, R., Fricker, H., Thomas, R., and Warner, R.: Ice sheet mass balance and sea level, Antarct. Sci., 21, 413–426, https://doi.org/10.1017/S0954102009990137, 2009.
Altnau, S., Schlosser, E., Isaksson, E., and Divine, D.: Cli-matic signals from 76 shallow firn cores in Dronning Maud Land, East Antarctica, The Cryosphere, 9, 925–944, https://doi.org/10.5194/tc-9-925-2015, 2015.
Anschütz, H., Eisen, O., Oerter, H., Steinhage, D., and Scheinert, M.: Investigating Small-Scale Variations of the Recent Accumu-lation Rate in Coastal Dronning Maud Land, East Antarctica, Ann. Glaciol., 46, 1–9, 2006.
Anschütz, H., Mueller, K., Isaksson, E., McConnell, J. R., Fischer, H., Miller, H., Albert, M., and Winther, J.-G.: Revisiting sites of the South Pole Queen Maud Land Traverses in East Antarctica: Accumulation data from shallow firn cores, J. Geophys. Res., 114, D24106, https://doi.org/10.1029/2009JD012204, 2009. Anschütz, H., Sinisalo, A., Isaksson, E., McConnell, J. R.,
Ham-ran, S.-E., Bisiaux, M. M., Pasteris, D., Neumann, T. A., and Winther, J.-G.: Variation of accumulation rates over the last eight centuries on the East Antarctic Plateau derived from vol-canic signals in ice cores, J. Geophys. Res., 116, D20103, https://doi.org/10.1029/2011JD015753, 2011.
Aristarain, A. J., Delmas, R. J., and Stievenard, M.: Ice-core study of the link between sea-salt aerosol, sea-ice cover and climate in the Antarctic Peninsula area, Clim. Change, 67, 63–86, 2004. Arthern, R. J., Winebrenner, D. P., and Vaughan, D. G.: Antarctic
Baines, P. G. and Fraedrich, K.: Topographic effects on the mean tropospheric flow patterns around Antarctica, J. Atmos. Sci., 46, 3401–3415, 1989.
Banta, J. R., McConnell, J. R., Frey, M. M., Bales, R. C., and Taylor, K.: Spatial and temporal variability in snow accumulation at the West Antarctic Ice Sheet Di-vide over recent centuries, J. Geophys. Res., 113, D23102, https://doi.org/10.1029/2008JD010235, 2008.
Bertler, N. A. N., Barrett, P. J., Mayewski, P. A., Fogt, R. L., Kreutz, K. J., and Shulmeister, J.: El Niño sup-presses Antarctic warming, Geophys. Res. Lett., 31, L15207, https://doi.org/10.1029/2004GL020749, 2004.
Bertler, N. A. N., Barrett, P. J., Mayewski, P. A., Sneed, S. B., Naish, T. R., and Morgenstern, U.: Solar forcing recorded by aerosol concentrations in coastal Antarctic glacier ice, McMurdo Dry Valleys, Ann. Glaciol., 41, 52–56, 2005.
Bertler, N. A. N., Mayewski, P. A., and Carter, L.: Cold Con-ditions during the Little Ice Age – Implications for abrupt climate mechanisms, Earth Planet. Sc. Lett., 308, 41–51, https://doi.org/10.1016/j.epsl.2011.05.021, 2011.
Bertler, N. A. N., Conway, H., Dahl-Jensen, D., et al.: The Ross Sea Dipole – Temperature, Snow Accumulation and Sea Ice Variabil-ity in the Ross Sea Region, Antarctica, over the Past 2700 Years, Clim. Past Discuss., https://doi.org/10.5194/cp-2017-95, in re-view, 2017.
Bracegirdle, T. J. and Marshall, G. J.: The Reliability of Antarctic Tropospheric Pressure and Temperature in the Latest Global Reanalyses, J. Climate, 25, 7138–7146, https://doi.org/10.1175/JCLI-D-11-00685.1, 2012.
Bromwich, D. H.: Snowfall in high southern latitudes, Rev. Geo-phys., 26, 149–168, https://doi.org/10.1029/RG026i001p00149, 1988.
Bromwich, D. H., Nicolas, J. P., and Monaghan, A. J.: An assess-ment of precipitation changes over Antarctica and the Southern Ocean since 1989 in contemporary global reanalyses, J. Climate, 24, 4189–4209, https://doi.org/10.1175/2011JCLI4074.1, 2011. Chen, J. L., Wilson, C. R., Blankenship, D., and Tapley, B. D.:
Ac-celerated Antarctic ice loss from satellite gravity measurements, Nat. Geosci., 2, 859–862, https://doi.org/10.1038/ngeo694, 2009.
Clem, K. R. and Fogt, R. L.: Varying roles of ENSO and SAM on the Antarctic Peninsula climate in austral spring, J. Geophys. Res.-Atmos, 118, 11481–11492, 2013.
Curran, M., Van Ommen, T., Morgan, V., Phillips, K., and Palmer, A.: Ice core evidence for Antarctic sea ice decline since the 1950s, Science, 302, 1203–1206, 2003.
Dansgaard, W. and Johnsen, S.: A flow model and time scale for the ice core from Camp Century, Greenland, J. Glaciol., 8, 215–223, 1969.
Dee, D. P., Uppala, S. M., Simmons, A. J., Berrisford, P., Poli, P., Kobayashi, S., Andrae, U., Balmaseda, M. A., Balsamo, G., Bauer, P., Bechtold, P., Beljaars, A. C. M., van de Berg, L., Bid-lot, J., Bormann, N., Delsol, C., Dragani, R., Fuentes, M., Geer, A. J., Haimberger, L., Healy, S. B., Hersbach, H., Hólm, E. V., Isaksen, L., Kållberg, P., Köhler, M., Matricardi, M., McNally, A. P., Monge-Sanz, B. M., Morcrette, J.-J., Park, B.-K., Peubey, C., de Rosnay, P., Tavolato, C., Thépaut, J.-N. and Vitart, F.: The ERA-Interim reanalysis: Configuration and performance of the
data assimilation system, Q. J. Roy. Meteor. Soc., 137, 553–597, https://doi.org/10.1002/qj.828, 2011.
Ding, M., Xiao, C., Li, Y., Ren, J., Hou, S., Jin, B., and Sun, B.: Spatial variability of surface mass balance along a traverse route from Zhongshan station to Dome A, Antarctica, J. Glaciol., 57, 658–666, https://doi.org/10.3189/002214311797409820, 2011. Dixon, D. A., Mayewski, P. A., Korotkikh, E., Sneed, S. B.,
Handley, M. J., Introne, D. S., and Scambos, T. A.: Varia-tions in snow and firn chemistry along US ITASE traverses and the effect of surface glazing, The Cryosphere, 7, 515–535, https://doi.org/10.5194/tc-7-515-2013, 2013.
Eisen, O., Frezzotti, M., Genthon, C., Isaksson, E., Magand, O., van den Broeke, M. R., Dixon, D. A., Ekaykin, A., Holm-lund, P., Kameda, T., Karlöf, L., Kaspari, S., Lipenkov, V. Y., Oerter, H., Takahashi, S., and Vaughan, D. G.: Ground-based measurements of spatial and temporal variability of snow ac-cumulation in East Antarctica, Rev. Geophys., 46, RG2001, https://doi.org/10.1029/2006RG000218, 2008.
Ekaykin, A. A., Kozachek, A. V., Lipenkov, V. Y., and Shibaev, Y. A.: Multiple climate shifts in the Southern Hemisphere over the past three centuries based on central Antarctic snow pits and core studies, Ann. Glaciol., 55, 259–266, https://doi.org/10.3189/201AoG66A189, 2014.
Ekaykin, A. A., Vladimirova, D. O., Lipenkov, V. Y., and Masson-Delmotte, V.: Climatic variability in Princess Elizabeth Land (East Antarctica) over the last 350 years, Clim. Past, 13, 61–71, https://doi.org/10.5194/cp-13-61-2017, 2017.
Emanuelsson, B. D., Bertler, N. A. N., Renwick, J. A., Markle, B. R., Baisden, W. T., Keller, E. D., and Neff, P., D.: The role of the Amundsen-Bellingshausen Sea anticyclonic circulation for marine air mass intrusions into West Antarctica, Clim. Dynam., submitted, 2017.
Ettema, J., van den Broeke, M. R., van Meijgaard, E., van de Berg, W. J., Box, J. E., and Steffen, K.: Climate of the Greenland ice sheet using a high-resolution climate model – Part 1: Evalua-tion, The Cryosphere, 4, 511–527, https://doi.org/10.5194/tc-4-511-2010, 2010.
Fahnestock, M. A., Scambos, T. A., Shuman, C. A., Arthern, R. J., Winebrenner, D. P., and Kwok, R.: Snow megadune fields on the East Antarctic Plateau: extreme atmosphere-ice interaction, Geophys. Res. Lett., 27, 3719–3722, 2000.
Favier, V., Agosta, C., Parouty, S., Durand, G., Delaygue, G., Gallée, H., Drouet, A.-S., Trouvilliez, A., and Krinner, G.: An updated and quality controlled surface mass bal-ance dataset for Antarctica, The Cryosphere, 7, 583–597, https://doi.org/10.5194/tc-7-583-2013, 2013.
Fogt, R. L., Wovrosh, A. J., Langen, R. A., and Sim-monds, I.: The characteristic variability and connection to the underlying synoptic activity of the Amindsen-Bellinghausen Seas Low, J. Geophys. Res., 117, D07111, https://doi.org/10.1029/2011JD017337, 2012.
Frezzotti, M., Pourchet, M., Flora, O., Gandolfi, S., Gay, M., Urbini, S., Vincent, C., Becagli, S., Gragnani, R., Proposito, M., Severi, M., Traversi, R., Udisti, R., and Fily, M.: Spatial and temporal variability of snow accumulation in East Antarctica from traverse data, J. Glaciol., 51, 113–124, 2005.
bal-ance near Talos Dome, East Antarctica, J. Geophys. Res., 112, F02032, https://doi.org/10.1029/2006JF000638, 2007.
Frezzotti, M., Scarchilli, C., Becagli, S., Proposito, M., and Urbini, S.: A synthesis of the Antarctic surface mass bal-ance during the last 800 yr, The Cryosphere, 7, 303–319, https://doi.org/10.5194/tc-7-303-2013, 2013.
Frieler, K., Clark, P. U., He, F., Buizert, C., Reese, R., Ligten-berg, S. R. M., van den Broeke, M. R., Winkelmann, R., and Levermann, A.: Consistent evidence of increasing Antarctic accumulation with warming, Nat. Clim. Change, 5, 348–352, https://doi.org/10.1038/nclimate2574, 2015.
Fudge, T. J., Markle, B. R., Cuffey, K. M., Buizert, C., Taylor, K. C., Steig, E. J., Waddington, E. D., Conway, H., and Koutnik, M.: Variable relationship between accumulation and temperature in West Antarctica for the past 31 000 years, Geophys. Res. Lett., 43, 3795–3803, https://doi.org/10.1002/2016GL068356, 2016. Fujita, S., Holmlund, P., Andersson, I., Brown, I., Enomoto, H.,
Fujii, Y., Fujita, K., Fukui, K., Furukawa, T., Hansson, M., Hara, K., Hoshina, Y., Igarashi, M., Iizuka, Y., Imura, S., In-gvander, S., Karlin, T., Motoyama, H., Nakazawa, F., Oerter, H., Sjöberg, L. E., Sugiyama, S., Surdyk, S., Ström, J., Ue-mura, R., and Wilhelms, F.: Spatial and temporal variability of snow accumulation rate on the East Antarctic ice divide between Dome Fuji and EPICA DML, The Cryosphere, 5, 1057–1081, https://doi.org/10.5194/tc-5-1057-2011, 2011.
Glasser, N. F., Harrison, S., Jansson, K. N., Anderson, K., and Cow-ley, A.: Global sea level contribution from the Patagonian Ice-fields since the Little Ice Age maximum, Nat. Geosci., 4, 303– 307, 2011.
Goodwin, B. P., Mosley-Thompson, E., Wilson, A. B., Porter, S. E., and Sierra-Hernandez, M. R.: Accumulation Variability in the Antarctic Peninsula: The Role of Large-Scale Atmospheric Oscillations and Their Interactions, J. Climate, 29, 2579–2596, 2016.
Hosking, J. S., Orr, A., Marshall, G. J., Turner, J., and Phillips, T.: The influence of the Amundsen-Bellingshausen Seas Low on the climate of West Antarctica and its representation in coupled cli-mate model simulations, J. Clicli-mate, 26, 6633–6648, 2013. Hou, S. G., Li, Y. S., Xiao, C. D., Pang, H. X., and Xu, J. Z.:
Pre-liminary results of the close-off depth and the stable isotopic records along a 109.91 m ice core from Dome A, Antarctica, Sci. China Ser. D, 52, 1502–1509, https://doi.org/10.1007/s11430-009-0039-6, 2009.
IPCC: Climate Change 2013: The Physical Science Basis, edited by: Stocker, T. F., Qin, D., Plattner, G.-K., Tignor, M., Allen, S. K., Boschung, J., Nauels, A., Xia, Y., Bex, V., and Midgley, P. M., Cambridge University Press, Cambridge, UK, 1535 pp., 2013. Isaksson, E. and Melvold, K.: Trends and patterns in the recent
ac-cumulation and proxy-temperature in coastal Dronnning Maud Land, Antarctica – interpretations from shallow ice cores, Ann. Glaciol., 35, 175–180, 2002.
Isaksson, E., van den Broeke, M., Winther, J., Karlöf, L., Pinglot, J., and Gundestrup, N.: Accumulation and proxy-temperature variability in Dronning Maud Land, Antarctica, de-termined from shallow firn cores, Ann. Glaciol., 29, 17–22, https://doi.org/10.3189/172756499781821445, 1999.
Kaczmarska, M., Isaksson, E., Karlöf, K., Winther, J.-G., Kohler, J., Godtliebsen, F., Ringstad Olsen, L., Hofstede, C. M., van den Broeke, M. R., Van De Wal, R. S. W., and Gundestrup, N.:
Accu-mulation variability derived from an ice core from coastal Dron-ning Maud Land, Antarctica, Ann. Glaciol., 39, 339–345, 2004. Kaspari, S., Mayewski, P. D., Dixon, D. A., Spikes, V. B., Sneed,
S. B., Handley, M. J., and Hamilton, G. S.: Climate variabil-ity in West Antarctica derived from annual accumulation-rate records from ITASE firn/ice cores, Ann. Glaciol., 39, 585–594, https://doi.org/10.3189/172756404781814447, 2004.
Kobayashi, S., Ota, Y., Harada, Y., Ebita, A., Moriya, M., Onoda, H., and Takahashi, K.: The JRA-55 Reanalysis: General Specifi-cations and Basic Characteristics, J. Meteorol. Soc. Jpn. Ser. II, 93, 5–48, https://doi.org/10.2151/jmsj.2015-001, 2015. Krinner, G., Magand, O., Simmonds, I., Genthon, C., and Dufresne,
J.-L.: Simulated Antarctic precipitation and surface mass balance at the end of twentieth and twenty-first centuries, Clim. Dynam., 28, 215–230, https://doi.org/10.1007/s00382-006-0177-x, 2007. Lenaerts, J. T. M. and van den Broeke, M. R.: Mod-eling drifting snow in Antarctica with a regional cli-mate model: 2. Results, J. Geophys. Res., 117, D05109, https://doi.org/10.1029/2010JD015419, 2012.
Lenaerts, J. T. M., van den Broeke, M. R., van de Berg, W. J., van Meijgaard, E., and Kuipers Munneke, P.: A new, high-resolution surface mass balance map of Antarctica (1979–2010) based on regional atmospheric climate modeling, Geophys. Res. Lett., 39, L04501, https://doi.org/10.1029/2011GL050713, 2012. Lenaerts, J. T. M., van Meijgaard, E., van den Broeke, M. R.,
Ligtenberg, S. R. M., Horwath, M., and Isaksson, E.: Recent snowfall anomalies in Dronning Maud Land, East Antarctica, in a historical and future climate perspective, Geophys. Res. Lett., 40, 2684–2688, https://doi.org/10.1002/grl.50559, 2013. Ligtenberg, S. R. M., van de Berg, W. J., van den Broeke, M. R.,
Rae, J. G. L., and van Meijgaard, E.: Future surface mass balance of the Antarctic ice sheet and its influence on sea level change, simulated by a regional atmospheric climate model, Clim. Dy-nam., 41, 867–884, https://doi.org/10.1007/s00382-013-1749-1, 2013.
Lliboutry, L.: A critical review of analytical approximate solutions for steady state velocities and temperatures in cold ice sheets, Z. Gletsch.kd. Glazialgeol., 15, 135–148, 1979.
Mahesh, A., Walden, V. P., and Warren, S. G.: Ground-Based In-frared Remote Sensing of Cloud Properties over the Antarc-tic Plateau. Part II: Cloud OpAntarc-tical Depths and ParAntarc-ticle Sizes, J. Appl. Meteorol., 40, 1279–1294, https://doi.org/10.1175/1520-0450(2001)040<1279:GBIRSO>2.0.CO;2, 2001.
Markle, B. R., Berler, N. A. N., Sinclair, K. E., and Sneed, S. B.: Synoptic variability in the Ross Sea re-gion, Antarctica, as seen from back-trajectory modelling and ice core analysis, J. Geophys. Res.-Atmos., 117, D02113, https://doi.org/10.1029/2011JD016437, 2012.
Marshall, G.: Trend in the Southern Annular Mode from observa-tions and reanalysis, J. Climate, 16, 4134–4143, 2003.
Massom, R. A., Pook, M. J., Comiso, J. C., Adams, N., Turner, J., Lachlan-Cope, T., and Gibson, T.: Precipitation over the interior East Antarctic ice sheet related to mid-latitude blocking-high ac-tivity, J. Climate, 17, 1914–1928, 2004.