A comparative
case study
of
Programming language Expansion Ratios
A thesis presented in partial fulfilment of
the requirements for the
degree of Master of Technology in Computing Technology
at
Massey University
Abstract
An effective size estimation tool must allow an estimate to be obtained early enough to
be useful. Some difficulties have been observed in using the traditional lines of code
(LOC) measure in software sizing, much of which is due to the need for more detailed
design information to be available before an accurate estimate can be achieved. This
does not allow the result to be obtained early in the software development process.
Moreover, the inherent language-dependency of LOC tends to restrict its use. An
alternative measure using Function Point Analysis, developed by Albrecht, has been
found to be an effective tool for sizing purposes and allows early sizing. However, the
function point measure does not have a sufficient historical base of information for it to
be used successfully in all cases with existing models of the software development
process. Because lines of code already have a sense of "universality" as the de facto
basic measure of software size, it can serve as a useful extension to function points.
Language Expansion Ratios are seen as the key in providing such an extension by
bridging the gap between function point and lines of code. Several sizing models have
made use of expansion ratios in an effort to provide an equivalent size in lines of code in
anticipation of its use in productivity studies and related cost models. However, its use
has been associated with ranges of variability. The purpose of this thesis is to study
Language Expansion Ratios, and the factors affecting them, for several languages based on a standard case study.
This thesis surv~ys the prevailing issues of software size measurement and describes
,i .
I
the role and importance of language expansion ratios. It presents the standard case
study used and the methodology for the empirical study. The experimental results of
measurements of the actual system are analysed and these form the basis for
appropriate conclusions on the validity and applicability of the expansion ratios
This research si,ows that the use of Language Expansion Ratios is valid but it is
i
considered inadequate when applied in its present form. This was found to be due to the
weighting factors associated with the appropriate function value obtained for the
Acknowledgments
I wish to extend my gratitude to Professor Graham Tate for consenting to be my
supervisor for this thesis. His direction has been very important to this work. I am
also grateful for his careful review and comments of the entire content of this thesis.
His guidance and encouragement are very much appreciated.
I
A special thanks to Miss June Verner for her constant help and support during the
course of this research. In particular, I wish to express my deep appreciation for her
help in making the documentation facilities available to me.
Finally, I would like to express my gratitude to Miss Lili Ton for her help during the
preparation of this thesis. Her efforts and patience in some of the typescripts and
TABLE OF CONTENTS
Page List of Figures ... v iii
List of Tables ... xi
CHAPTER 1 INTRODUCTION ... i
CHAPTER 2 SURVEY OF BACKGROUND INFORMATION ... 5
2. i Review of Software Metrics ... 6
2. i. i Size Metrics ... 7
2. i . i . i Line Count ... 8
2.i.i.2 TokenCount. ... i i 2.i.i.3 Function Count ... i 5 a. Function Point Analysis (FPA) ... i 5 b. MARK II Function Points ... 1 7 2. i . 2 Structure Metric ... 2 O 2. i .2. i Logic Structure ... 2 i 2.i.2.2 Data Structure ... 23
2. i .3 Composite Metrics ... 2 4 2. 2 Review of Software Sizing Models ... 2 5 2. 3 Need for Improved Sizing Mechanism ... 2 9 2. 4 Role of Language Expansion Ratios ... 3 i CHAPTER 3 OVERVIEW OF CASE STUDY
···35
3. i Research Objective ... 3 5 3.2 Case Study Specification - OveNiew ... 3 7 3. 3 Language Implementation ... 4 O
3 .3. i Advanced Revelation ... 4 i
a. Tools That Build Tools ... 4 i b. Paint ... 4 2
c. Popup ... 4 2
d. Menus ... 4 2
Page f. Editor ... 4 3
g. Macros ... 4 3
h. The Command Level (TCL) ... 4 3
i. Operating System ... 4 3
3.3.2 lnformix 4GL ... 4 4
a. A Database Language ... 4 4
b. A Programming Language ... 4 4
c. Screen-Building Utility ... 4 5
d. Menu-Building Utility ... .4 5 e. Report Writer ... 4 5
3.3.3 Micro Focus Level II Cobol. ... .4 6 a. Level II Cobol Compiler ... 4 6
b. Animator ... 4 7
c. Forms-2 ... 4 7
d. Fileshare ... 4 7
CHAPTER 4
METHODOLOGY FOR EMPIR!C/l-.LSTUDY ··· ... m . . n
4. 1 Detailed Design and Implementation ... .4 8 4. 2 Size and CosVEffort Estimation ... 5 6
4. 3 Data Collection ... 5 9
4. 4 Software Measurement. ... 5 9
4. 5 Analysis of Data ... 6 1
CHAPTER 5
EXPERIMENTAL RES UL TS AND OBSERVATION ... 6 3
5.1 Regression Analysis of Empirical Data ... 6 4
5. 1 . 1 System ... 6 6
5.1.2 ModuleTypes ... 76
5.1.3 lnpuVUpdate Transactions ... 7 6
5.1.4 Reports ... 79
5.1 .5 Forms ... 8 O
5.1.6 External lnquiries ... 8 2
5. 1 . 7 Comparative Expansion Ratios ... 8 3
5. 2 System size and Effort - estimates vs actuals ... 8 8
Page
CHAPTER 6
SUMMARY AND CONCLUSIONS ... 9 5
List of References ... 1 0 1
Appendices
Appendix
Appendix
Appendix
Appendix A
B
C
D
Figure
1
2.2 3.1 .1 4.1 .1 4.1 .2
4.1 .3
4.1 .4 4.1 .5
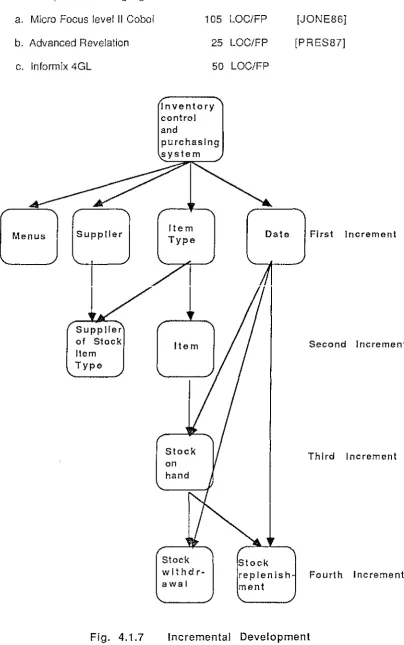
4.1 .6
4.1 .7
4.4.1
5.1 .1
5.1 .2
5.1
.35.1
.45.1 .5
5.1
.6
5.1 .7
5.1 .8
6 .1 6.2 8.1 8.1.1 8.1.2 8.1.3 8.1.4 8.1.5 8.1.6 81 .7 8.2 8.2.1 8.2.2 8.2.3List of Figures
Page
Control flow graph, G, with complexity, V(G)
=
5 ... 2 2 Multi-language sizing mechanism ... 3 3 Overview of Research ... 3 6 Inventory Control and Purchasing System (DFD0) ... 4 9 Modified State Transition Diagram - User-interfacefor Inventory Control and Purchasing System ... 5
o
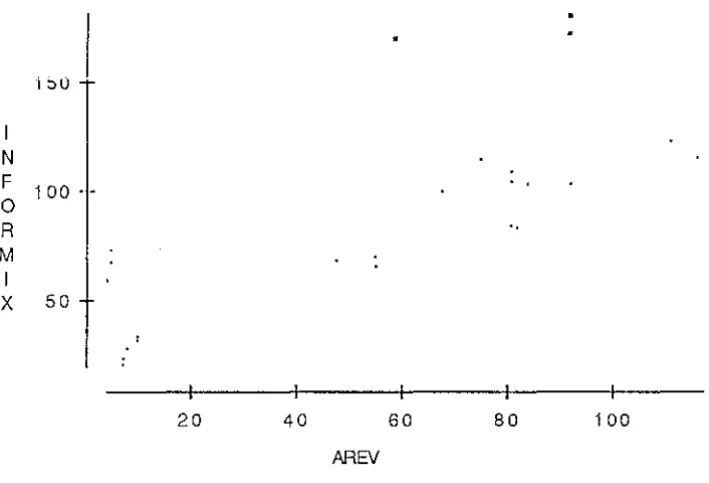
User-interface for System Start-up Menu ... 5 1 User-interface for Handling New Types of Stock Menu ... 5 1 User-interface for Monitoring Stock level Menu ... 5 3 User-interface for Purchase Order Processing and follow-up Menu ... 5 3 Incremental Development ... 5 8Steps in the statistical analysis of data ... 6 2 Plot of lnformix (LOC) vs AREV (LOC) - System 1 ... 6 8
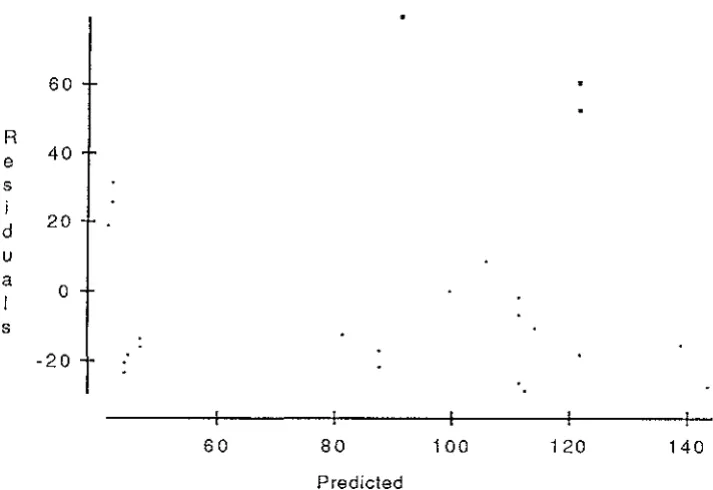
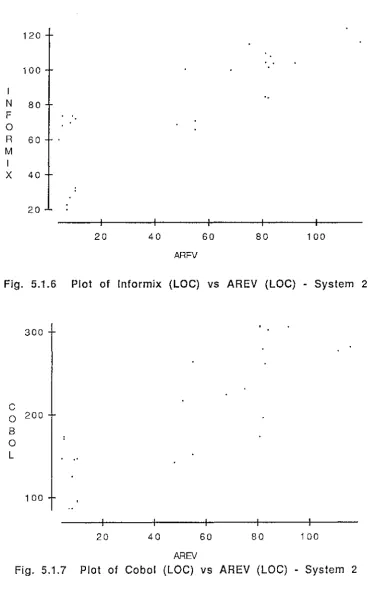
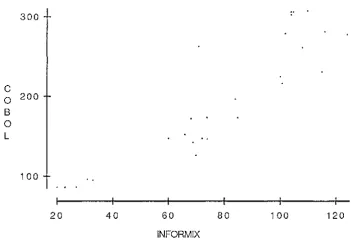
Plot of Cobol (LOC) vs AREV (LOC) - System 2 ... 6 9 Plot of Cobol (LOC) vs I nformix (LOC) - System 1 ... 6 9 Residuals plot for Inform ix vs AREV - System 1 ... 7
o
Residuals plot for Cobol vs AREV - System 1 ... 7 0 Plot of Intermix (LOC) vs AREV (LOC) - System 2 ... 7 3 Plot of Cobol (LOC) vs AREV (LOC) - System 2 ... 7 3 Plot of Cobol (LOC) vs Inform ix (LOC) - System 2 ... 7 4 Results of software size estimates ... 9 7 Results of Language Expansion Ratios forMicro Focus Level II Cobol. ... 9 9 System Start-up (DFD1) ... 1 41 Process P1 ... 1 4 2 Process P2 ... 1 4 3 Process P3 ... 1 4 4 Process P4 ... 1 4 5 Process PS ... 1 4 6
Figure B.2.4 B.3 B.3.1 B.4 B.4.1 B.4.2 B.5 B.5.1 B.5.2 B.6 B.6.1 B.6.2 B.7 B.7.1 B.8 B.9 D.1 D.2 D.3 D.4 D.5 D.6 D.7 D.8 D.9 D.1 0 D.11 D.12 D.13
Page
Process P11 ... 1 5 3
Monitoring Stock Levels (SOH) (DFD1) ... 1 5 4 Process P1 2 ... 1 5 5 Monitoring Stock Levels (DFD1) ... 1 5 6
Process P13 ... 1 5 7
Process P14 ... 1 5 8
Monitoring Stock Levels (DFD1) ... 1 5 9
Process Pi 5 ... ···.··· ... 1 6
o
Process P1 6 ... 1 6 1
Monitoring Stock Levels (DFD1) ... 1 6 2 Process P17 ... 1 6 3 Process Pi 8 ... 1 6 4 Purchase Order Processing and Follow-up ... 1 6 5
Process P20 ... 1 6 6 Purchase Order Processing and Follow-up (DFD1) ... 1 6 7 Purchase Order Processing and Follow-up (DFD1) ... 1 6 8 Plot of lnformix (LOC) vs AREV (LOC) - System 1 ... 1 81 Plot of Cobol (LOC) vs AREV (LOC) - System 1 ... 1 8 2 Plot of Cobol (LOC) vs Inform ix (LOC) - System 1 ... 1 8 3
Plot of lnformix (LOC) vs AREV (LOC) - System 2 ... 1 8 4 Plot of Cobol (LOC) vs AREV (LOC) - System 2 ... 1 8 5
Plot of Cobol (LOC) vs Inform ix (LOC) - System 2 ... 1 8 6 Plot of lnformix (LOC) vs AREV (LOC)
Input/update modules - System 1 ... 1 8 7
Plot of Cobol (LOC) vs AREV (LOC)
Input/update Modules - System 1 ... 1 8 8 Plot of Cobol (LOC) vs lnformix (LOC)
Input/update Modules - System 1 ... 1 8 9 Plot of lnformix (LOC) vs AREV (LOC)
Input/update Modules - System 2 ... 1 9 O
Plot of Cobol (LOC) vs AREV (LOC)
Input/update Modules - System 2 ... 1 91
Plot of Cobol (LOC) vs lnformix (LOC)
Input/update Modules - System 2 ... 1 9 2
Plot of lnformix (LOC) vs AREV (LOC)
Figure Page D.14 Plot of Cobol (LOG) vs AREV (LOG)
Module Types - System 2 ... 1 9 4
D.15 Plot of Cobol (LOG) vs lnformix (LOG)
Module Types - System 2 ... 1 9 5
D.16 Plot of lnformix (LOG) vs AREV (LOG)
Reports Modules - System 2 ... 1 9 6
D.17 Plot of Cobol (LOG) vs AREV (LOG)
Reports Modules - System 2 ... 1 9 7
D.18 Plot of Cobol (LOG) vs lnformix (LOG)
Reports Modules - System 2 ... 1 9 8
D.19 Plot of lnformix (LOG) vs AREV (LOG)
Forms Modules - System 2 ... 1 9 9
D.20 Plot of Cobol (LOG} vs AREV (LOG)
Forms Modules - System 2 ... 2
o o
D.21 Plot of Cobol (LOG) vs lnformix (LOG)Forms Modules - System 2 ... 2 O 1
D.22 Plot of lnformix (LOG) vs AREV (LOG)
Menus - System 2 ... 2
o
2D.23 Plot of Cobol (LOG) vs AREV (LOG)
Menus - System 2 ... 2 O 3
D.24 Plot of Cobol (LOG) vs lnformix (LOG)
List of Tables
Table Page
5. 1 .1 Results of Statistical Analysis for System 2 ... 6 7
5. 1 . 2 Results of Statistical Analysis for System 1 ... 6 8
5. 1 .3 Input/Update Programs with File-to-File Operations ... 7 8
5. 1 .4 Summary of Language Expansion Ratios
based on Albrecht's Function Points ... 8 6
5.1 .5 Summary of Language Expansion Ratio
based on Symond's Mark II Approach ... 8 7
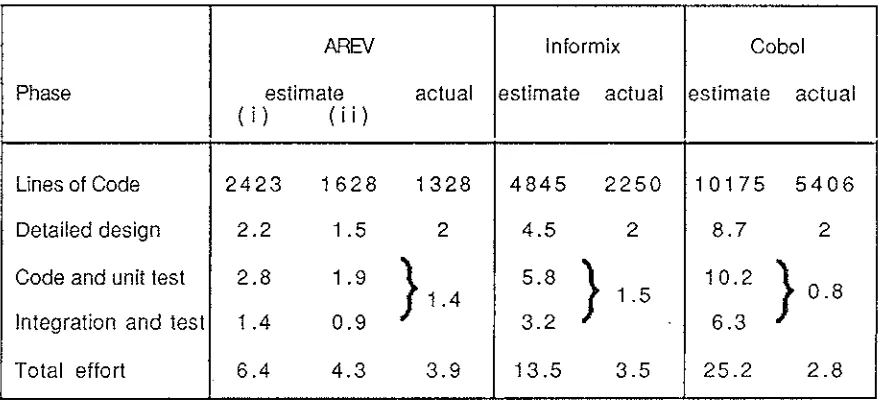
5. 2. 1 Estimated and Actual Effort in person-months ... 8 9
5 .3. 1 Summary of Development Efforts in person-hours ... 9 1
5 .3 .2 Milestone Time-log in person-hours ... 9 3
C.1 List of Programs ... , 70
C.2 Results of Function Point Analysis ... 1 7 1
C.3 Line count for System 1 ... 1 7 3
C.4 Line count for System 2 ... 1 7 4
C.5 Line count for Input/update module - System 1 ... i 7 5 C.6 Line count for Input/update - System 2 ... 1 7 6
C.7 Line count by Module Type Categories ... 1 7 7
C.8 Line count for Reports Module ... i 7 7
C.9 Line count for Menus Module ... 1 7 8
C.1 O Line count for Inquiry Module ... 1 7 8
C.11 Line count for Forms Module ... 1 7 9
D .1 Regression Analysis of plot in Fig. D.1 ... 1 8 1
D.2 Regression Analysis of plot in Fig. D.2 ... 1 8 2
D.3 Regression Analysis of plot in Fig. D.3 ... 1 8 3
D.4 Regression Analysis of plot in Fig. D.4 ... 1 8 4
D.5 Regression Analysis of plot in Fig. D.5 ... 1 8 5
D.6 Regression Analysis of plot in Fig. D.6 ... 1 8 6
D.7 Regression Analysis of plot in Fig. D.7 ... 187
D.8 Regression Analysis of plot in Fig. D.8 ... 1 8 8
D.9 Regression Analysis of plot in Fig. D.9 ... 1 8 9
D .1 O Regression Analysis of plot in Fig. D.10 ... 1 9 O D.11 Regression Analysis of plot in Fig. D.11 ... 1 91
D.12 Regression Analysis of plot in Fig. D.12 ... 192
Table D.14
D.15
D.16
D.17
D.18
D.19
D.20
D.21
D.22
D.23
D.24
Page Regression Analysis of plot in Fig. D.14 ... 1 9 4
Regression Analysis of plot in Fig. D.15 ... 195
Regression Analysis of plot in Fig. D.16 ... 1 9 6
Regression Analysis of plot in Fig. D.17 ... 1 9 7
Regression Analysis of plot in Fig. D.18 ... 1 9 8
Regression Analysis of plot in Fig. D.19 ... 1 9 9
Regression Analysis of plot in Fig. D.20 ... 2 O O
Regression Analysis of plot in Fig. D.21 ... 2 O 1
Regression Analysis of plot in Fig. D.22 ... 2
o
2Regression Analysis of plot in Fig. D.23 ... 2 O 3
CHAPTER 1
INTRODUCTION
The impact of the Software Crisis emanates from the realization of the importance
which computerization has on society and industries. An overwhelming demand for
software escalated to such an extent that traditional software development techniques
could not cope. The problem related to the difficulty of establishing techniques for
handling the growing size and level of complexity of software systems whose
development schedules could not be accurately predicted.
The cost of software grows disproportionately with the other associated costs of
computer systems and this upward trend is an issue of concern [DACS87,JONE86j. in
the search for a solution to the software crisis, the field of Software Engineering was
created in a deliberate attempt to use a combination of techniques, methods, and tools
for producing economical software that is reliable and works efficiently.
An important aspect of Software Engineering has been the focus on software size
estimation as a prerequisite for resource planning and scheduling in the software
development process. The unpredictable nature of the software development process
has prompted intense research in finding a way of making programs measurable and,
hence, more predictable. Source lines of code (LOG) have been widely used for
research studies involving size estimation. The count of the number of lines of code is
said to be related to the size of the effort required in the development process. Several
The study by Walston and Felix [WALS77] discusses research into a method of
estimating programming productivity by measuring the rate of production of lines of
code by project and relating them to factors which might influence its behaviour.
Measurement data were collected from 60 projects in one organization and were
maintained in a measurement database. Based on these data, productivity analysis of
effort and product size shows a nearly first-power (or linear) relationship. In
another study carried out in the Software Engineering Laboratory at the University of
Maryland, Basili et al [BASl8i] examined the relationships among the various basic
software development variables, such as size, effort, project duration etc. The
analysis reveals a high probability of a relationship between total effort and delivered
lines of source code. The relationship is nearly linear with a coefficient of
determination of 0.93 at the 0.001 level of significance. This high correlation
indicates a possibility of using source lines of code to predict the total effort required
in a development project. This result was found to be consistent with the study by
Walston and Felix [WALS77].
The validity of using source lines of code as a predictor of programming effort is also
based on the assumption that it includes a measure of functional complexity. Although
studies by [WALS77] and [BASl8i] indicate a linear relationship between source lines
of code and effort, Basili et al [BAS18i] also stated that the assumption which relates
the functional complexity to program size is subjective. The argument is that size may
increase at an even greater rate as complexity increases. This follows the notion
suggested by Brooks [BR0075] that man and month are not necessarily interchangeable
as the result of increasing one may not directly cause the other to decrease. However,
it can be acknowledged that the link between lines of code and effort prediction is a valid
one, though more factors relating to complexity will have to be considered. Already,
several cost models have used lines of code as the input parameter for cost and schedule
estimates. Of the better known costs models are the COCOMO and SLIM models
The biggest difficulty in using today's Software Cost models has been the problem of
providing sound sizing estimates. Several methods of size measurement have been
developed to depart from the usual lines of code measure for size estimation in an
attempt to search for a better way to estimate software size early enough for it to
remain useful. One such method that remains popular is the measure for function
value developed by Albrecht called Function Point Analysis. Function Point Analysis
has been quite successful and is adopted in several commercial software sizing models.
However, most of these models also provide an equivalent size in lines of code in
anticipation of its use in productivity studies as well as with existing cost models. The
use of an expansion ratio to convert from function points to lines of code has been
recognized to contain ranges of variability due to the fact that it is obtained from
different sources or based on different datasets. However, the expansion ratio remains
useful in standardizing the basic unit of measure for quantifying software. The purpose
of this thesis is to study Language Expansion Ratios, and the factors affecting
them, for several languages based on a standard case study.
Chapter 2 provides a summary of the background information relating to the issues of
software sizing. A review of software metrics and the problems associated with them
are presented followed by a discussion of the subjectivity of sizing in existing size
estimation models. It emphasizes the need for an improved size estimation method
which can be applied to the wider range of programming languages and examines the
role of language expansion ratios in providing such an extension to existing sizing
methods.
Chapter 3 presents the research objective for this thesis and a brief outline of the
system analysis and design specification of the case study used. The languages used in
Chapter 4 provides an outline of the methodology adopted for this empirical study. It
describes the system development tasks involved in the implementation phase as well
as the software development strategy used. The implementation phase includes detailed
design and code implementation. Other implementation-related activities such as size
and cost/effort estimation, data collection, software measurement and statistical
analysis methods are also included as an overall base appropriate for the empirical
study.
Chapter 5 presents the experimental results of the case study. It describes the detailed
analysis of experimental data and discusses related observations associated with the
results of the analysis.
Chapter 6 provides a summary and appropriate conclusions based on the empirical
CHAPTER 2
SURVEY OF BACKGROUND INFORMATION
To date, Software Sizing Methods still have a certain degree of subjectivity in their
estimation of software size. Independent attempts in measuring and estimating
software tend to concentrate more on certain aspects of the program characteristics and
less on others. Efforts to incorporate some combination of the fundamental concepts of
software metrics have been progressive although the subjectivity factor remains a
persistent problem. The growing number of programming languages will no doubt
influence the prevailing concerns for sizing. The link between sizing and effort
estimation has been indicated as a continuum in the software development process
[BOEH84,VERN87]. Notwithstanding the prevailing problems with estimating the size
of software, efforts in cosVeffort prediction models have shown significant progress
although there is still an explicit dependence on size measures [BOEH84, PRESS?,
•
VERN87]. A more accurate size estimate is deemed a necessity if more accurate cost
and effort prediction is to be possible. Hence, the continuing need for research in
sizing becomes apparent.
This Chapter reviews the subjectivity of software size estimation by looking at the
attempts at solving the software sizing and estimation problems and the estimation
techniques adopted by various software sizing models. A review of software metrics is
presented highlighting their use and their deficiencies . Metrics applied to existing
software sizing models showed variability in the predictions. Their significance is
discussed. The need for a sizing mechanism which extends across language boundaries
becomes increasingly important amidst the growing number of available languages.
The relevant potential for such a mechanism is investigated and the role and importance
2.1
Review of Software Metrics
The effort expended in software development is invariably influenced by some dominant
factors. Categorically, they involved the type of application, the language used and the
development environment. Several attempts have been made to identify characteristics
of programs deemed to be influential factors affecting program behaviour. Some
relevant factors identified are the structure, function and size of programs.
Investigative studies have explored these factors, and others, in certain application
domains in an attempt to clarify ideas for improving programming productivity and to
effectively measure relevant data so that the estimation process of software projects
can be better controlled.
In a comprehensive review of research into measurement alternatives, Capers Jones
identified five major categories which attempts to study program behaviour but depart
from the usual unit of measure of Source Lines Of Code (SLOC) [JONE86]. The use of
SLOC is considered to be subjective and language dependent. Among the different
alternatives identified, three specific categories of research have captured much
"
attention among researchers as their basic concepts are quite unique. These relate to
the study of:
a. functional and data aspects of code
b. program structural complexity
c. technology-independent function count.
Each of these categories will be discussed in detail in the following sections. The
explanatory power of each forms a unique theoretical base; however, there are some
In determining appropriate software metrics, Conte et al suggest that for a metric to be
used effectively it must be objective and consistent under any prevailing circumstances
[CONT86]. The objective measurement should be one which can be computed precisely
with an algorithm and should be consistent irrespective of changes in time, place or
observer. This is important for productivity studies as well as the convenience of
providing an automated tool for it.
The continuing refinement of languages have reached a point where several problems
are, consequently, introduced. These affects the process of software measurements;
where subjectivity has seized-up on the objective goals. This will be discussed in
greater detail in the following sections.
This section highlights some of the more common software metrics used by software
researchers and its application have been extended for use in software size estimation
in some commercial software sizing models [DACS87].
2.1.1 Size Metrics
"
Size metrics are direct measures of software and the process by which it is developed
[PRES87]. It is considered a natural quantification of software and serves as an
indicator to the effort required to produce the software. The size of programs is
important because it provides the following advantages [CONT86]:
a. the computation of size from source code can be done quite easily
b. it serves as an important link to other models of the software process
c. it is useful for productivity studies.
Measuring software size dates back to the early days when computers were first
found to be reasonable where machine language, or the later assembler language, was
concerned. Its use was propounded as being a useful size metric as it was easily
determined from the source code listings. The changing form and style of programming
languages begin to have a profound impact on size metrics as the number of variations
made it very difficult to maintain objectivity. Size metrics, subsequently, have had to
shift their fundamental emphasis. The use of token and function point counts are part
of that fundamental change.
The difficulty in analysing program size is that "almost never does size change by
itself" [JONE86 pp. 95]. Several other related factors tend to become more
complicated as size increases. As indicated by Brooks in "The Mythical Man-Month"
[BR0075], when the size of software is large, it is less likely that putting more men on
the job would have any effect on shortening the schedule. In fact, the opposite result
might prevail.
However, size metrics pro~de a quantifiable measure for software a·nd have become a
dominant factor in effort-related studies. Some concern about inconsistencies has led
to the development of new techniques of measuring software. However, this difficult
area has not been satisfactorily resolved. The following discusses the three main
counting techniques used by software researchers that have been applied in various
cost models and productivity studies [BOEH84] .
2.1.1.1 Line Count
Line count is considered the most natural way to quantify a piece of software. The
counting of Lines Of Code (LOC) represents the count of the basic unit of measure
associated with programming languages. In the early pioneering years of computer
systems, the use of machine languages or assembler languages were more rigid and did
had to be coded and every line of code relates to performing a particular task. Perhaps,
it was a useful measure then as LOC had quite literally a 1 :1 relationship with the
effort required to write a line of code. However, the inefficiencies in coding with early
programming languages soon caused a transformation of the basic code representation
and, together with it, a change of form and style of programming.
Although LOC is a simple metric to use, there is "no general agreement as to what
constitutes a line of code" [CONT86]. As higher level languages have free-form
representation and a variety of other types of statements besides executable
statements, it becomes unclear as to what should be included in the line count. Most
researchers agree that lines of code which directly affect the function of the program
need to be included [CONT86]. However, it is considered that it takes less effort to put
in comments or blank lines into a program than it does to write an executable
statement. Furthermore, free-form representation allows more than one executable
statement to appear on a physical line. The problem now is whether to count physical
lines or executable statements.
There are several definitions in counting LOC by various researchers [BOEH84,
JONE86]. One such definition considered to be used by most researchers is as follows
[CONT86] :
" A line of code is any line of program text that is not a comment or blank line,
regardless of the number of statements or fragments of statements on the line. This
specifically includes all lines containing program headers, declarations, and
executable and non-executable statements."
Capers Jones listed eleven major variations in line counting rules both at the program
and project level [JONE86, pp. 15]. At the program level, the range of variation could
compact. At the project level, productivity studies can become confused when there is
· no distinction between the actual developed code and the code that already exists and is
being used for convenience. Re-used code, temporary or scaffold code, tool and support
programs are code which does not require the same effort as the actual developed code.
Their inclusion in the line count becomes somewhat debatable. Such variation in
counting rules does not allow effective comparison of results among researchers as
such comparative studies would inevitably be clouded with uncertainties. LOC initially
achieved objectivity but its use has slowly deteriorated in the direction of subjectivity.
Unless standard counting rules are established, this situation is unlikely to change.
Besides the inconsistencies related to line counting, there are paradoxes associated with
LOC in productivity studies [JONE86]. Capers Jones highlighted several of these
paradoxes which tend to penalize high-level languages as well as higher quality
programs. For example, in using LOC as a productivity indicator, high level languages
are penalized for producing less code. As the rate of decrease in cost is not directly
proportional to the rate of decrease in the LOC produced, the cost per source line can be
shown to go up rather than down [JONE86, pp. 8]. This similarly applies when using
LOC as a quality indicator. Other paradoxes relate to cost per defect and percentage
representation. Hence, in order for lines of code to remain a successful size metric,
Capers Jones indicated that two fundamental rules must be observed [JONE86, pp. 61 ]:
" 1. High-level languages will have characteristic rates of code production that are
inversely proportional to the level of the language.
2. The tasks and activities not directly affected by source language
(ie. documentation) are increasingly significant as language levels go up."
As the level of the language goes up, so does the difficulty of counting the lines of code.
"line of code". Fourth generation languages fall into this category and require yet
another counting convention.
LOC is considered to be language dependent, as one LOC in COBOL need not be equal to one
LOC in FORTRAN for example. If comparative studies are required, a conversion factor
must be calibrated to show the ratio of LOC between the two languages or to a reference
language. This method provides the basis for comparison, but the method should be
validated with empirical data [JONE86, pp. 59]. Most Cost Estimation Models continue
to use LOC as an input parameter in spite of the problems of LOC [BOEH84]. The reason
is to make use of the existing base of knowledge with LOC rather than developing a new
unit of measure at the expense of time. Further, Capers Jones believed that the LOC
concept is so "deeply embedded" in the programming industry that it cannot be quickly
replaced.
The use of LOC in size estimation remains a controversial one as its use in estimation
requires a level of detail• that may be difficult to achieve in practice. It is still
subjective when used in the estimation process as the result is based heavily on the
experience of the person making those estimates.
2.1.1.2 Token Count
The use of Token Counts is a departure from LOC due to the prevailing problems
associated with counting LOC. This counting technique is a more detailed examination of
a line of code by breaking it down into the elementary parts. As will be indicated later,
this concept does pose some restrictions to the wider range of languages.
Studies based on token count or data aspect of code are the ideas of the late Dr. Maurice
Halstead who proposed a theory known as Software Science [HALS??]. Software science
operator and operand [JON E86]. Operators are functional statements which direct an
action, such as read or move data, add or subtract etc .. Operands, on the other hand, are
variables and constants used to contain data which is being manipulated within the
program. Hence, by counting the number of tokens in a program, ie. operators and
operands, several related program characteristics can be studied.
Four basic software science measures are determined as the base for the counting rules
[HALS??]:
n1 = number of distinct operators appearing in a program
n2 = number of distinct operands appearing in a program
N1 = total number of occurrences of operators in a program
N2 = total number of occurrences of operands in a program.
Using the four basic measures, the length of a program is defined as :
N=N1 +-N2
and the vocabulary size is defined as:
n = n1 + n2
As noted in [SHEN83], N is closely related to the LOG measure of a program length.
When counting operators and operands for machine language, if there is one operator
and one operand in a line the relationship between program length and LOC is given by :
N = 2 x LOG.
In counting the four basic measures of operators and operands, some variations in
counting rules are being used among researchers [GONT86]. For example, Halstead did
not include declaration statements and 1/0 statements. Statement labels were not
counted either. However, current researchers maintain that it is reasonable to include
operand counts. As indicated in [SHEN83], there seems to be no apparent standard
counting rules in use with software science and SHEN et al propose some consistency
measures instead.
From the definitions of length and vocabulary, Halstead derived a set of measures for
determining the volume of a program, program level, language level, effort and
programming style for a program. As size metrics are discussed here, the length and
volume metrics will be elaborated in this section. The other metrics will be discussed
in a later section as they are more appropriately categorized under composite metric.
The volume of a program is defined as:
Volume (V)
=
N logz nAlthough token counts in software science provide interesting findings in relating data
definition and functional statements to programming language measurement, it fails to
include structural linguistie concepts of the language [JONE86]. The limitation of
using operators and operands does not allow it to be effective when applied to higher
level languages, such as the fourth generation languages, where functions and
structures takes precedence. Several recent critiques of software science have been
published to reveal these inadequacies as well as the anomalies in the theory [SHEN83,
CARD87a, CARD87b, JONE86,Ll87].
In the paper presented by Card et al [CARD87al, a study was conducted to re-examine
the fundamental relationships of measures derived in software science. The study
analyses the measures based on Halstead's own data and another larger dataset. In the
investigation of the length equation, it was noted that there seems to be a mathematical
dependence between the estimated and actual length. Card et al indicated that the
correlation between them would naturally be good. The estimated program length
equation is:
where
"N is the estimated program length
n1 is the number of unique operators
and n2 is the number of unique operands.
The issue is that in order to maintain the validity of the equation, it will have to be
established that the log2 terms actually have some additional effect on the length of the
program, "N. Subsequent results of the study show that there is no significant
additional information obtained with the presence of the log 2 terms. Hence, this
observation, and others, in the paper indicated that the basic relations of software
science lacks theoretical support.
SHEN et al [SHEN83] give a comprehensive summary of criticisms of software science
and point out the questionable derivation of some software science formulas. Their
criticism of the length equation is that it may be valid in a statistical sense but in
reality does not actually represent the length of a program. They suggest that poor
programming practices may sometimes introduce impurities into software science
metrics and cause high variability in the result
LI et al [Ll87] in an empirical study of software metrics, particularly concerned with
the analysis and experimental validation of the relationships among static metrics,
revealed some inadequacies with the length equation. In the study, the length equation
was observed to be program-size dependent, the estimated length, 11N , overestimates
The basic counting rules of software science are not consistent across programming
languages. That is, the counting of tokens is subjective when applied to different
languages. The usefulness of software science have been hindered by the restrictive
counting of operators and operands only. Jones [JONE86] believes that by including
richer structural linguistic concepts, perhaps a wider applicability can be pursued and
its usefulness expanded. With their present definitions, software science metrics are
not as effective for higher level languages. These include fourth generation languages,
graphics languages and other powerful emerging symbologies for software.
However, the use of software science has some significance as a size metric. In a study
of over one thousand commercial assembly language and PUS modules, a linear
relationship was found between LOC, the length equation (N), and the volume equation
(V) [CONT86].
2.1.1.3 Function Count
Function counts were pioneered by Albrecht in i 979 when he proposed a methodology
known as Function Point Analysis. 'The method was initially introduced for productivity studies but was later extended to be used for size estimation. A function
may be defined as a collection of executable statements that performs a certain task,
including declarations used for data manipulation [CONT86]. The idea of using function
count is to allow one to think of functions to be performed rat11er than the number of
lines of code required to perform that function.
a Function Point Analysis (FPA)
Function Point Analysis (FPA) was employed as a technology-independent method for
sizing software. The method performs counts on the different types of functions
include inputs, outputs, master files and inquiries provided to, or generated by, the
software. Points are then allocated to the counts of the functions where a weighting is
applied based on the function value to the user. In Albrecht's method, the average
weights are as follows [JONE86, pp. 75]:
a. Inputs multiplied by 4
b. Outputs multiplied by 5
c. Inquiries multiplied by 4
d. Master files multiplied by i O
e. Interfaces multiplied by 7
By adding up the weighted function counts, the total is the "raw" function points.
Further adjustments are then applied to account for the degree of complexity of the
software. According to Albrecht, the raw function point total can be modified
subjectively for other factors, such as high complexity, for a range of plus or minus
25% [JONE86]. The adjusted total function points arrived at is then representative of
the overall functions contained in the software under consideration.
"
A function point is a dimensionless number which provides a useful comparative index,
especially in productivity studies. The use of FPA has been extended and applied to
predicting the size of software as it is considered to be a quick and easy method to use
and can be applied at an early stage of the software development process [ALBR83].
Albrecht validated his Function Point approach using software science metrics and
showed some fundamental agreement between function points and LOC [ALBR83]. In the
study, he found a high degree of correlation between function points and the eventual
LOC of the program. Subsequent validation also showed a correlation between function
points and work-effort. These observations prompted Albrecht to suggest a two-step
and LOG can be established. This would allow function points to be used with a wider
supporting base of knowledge, which are mainly in lines of code, of size data. However,
some of Albrecht's studies into productivities revealed some ambiguous results which
were later blamed on the paradox of lines of code [JONE86, pp.76]. These applies
mainly to high level languages.
The use of Albrecht's Function Point Analysis seems to create some inconsistencies
when it comes to counting the number of functions. This uncertainty in counting
functions, such as inputs and outputs etc., proves to be quite difficult to resolve.
Symons provides a modified version of the FPA approach which he called the "MARK II"
approach in the hope of solving some of the difficulties of FPA [SYM088]. The MARK II
approach tends to make the initial counting of functions more objective.
An important contribution of FPA is its ability to be used as a size predictor with
subsequent conversion to the equivalent LOC. Although the margin of error is quite
high in such conversion [JONE86, pp. 76], its potential as an early size predictor
tends to overshadow those flaws. However, FPA is not widely used for software where
there is high algorithmic complexity and low data complexity. The main weakness of
FPA seems to be in dealing with program complexity. Capers Jones mentioned that FPA
is incomplete as a size predictor as "it lacks any effective quantification for the
structural aspects of software, such as branching, loops, recursive calls and the like"
[JONE86].
b MARK II Function Points
Symons, in his paper [SYM088], evaluates the FPA method, reveals some areas of
difficulty and suggests an alternative to the FPA method called the "MARK II" approach.
His critical review of FPA mentions of the oversimplification of classifying the degree
subjective and requires careful calibration for them to be more meaningful. Further,
technical complexity factors are inadequate in revealing the internal complexities of
the system and the function point counting rules tend to underestimate larger
integrated systems as compared to the sum of the same system "dis-integrated" into
several smaller discrete systems. He maintains that the larger integrated systems
require greater effort to develop and should be weighted accordingly.
The "MARK II" approach looks, instead, at entities rather than files as Symons contends
that it is more appropriate in today's database technology. His notion of entity-type
relates to modern database practice and relates to data which the system provides as the
main body of information. Input, output, inquiry etc. components are all regarded as
consisting of logical input/process/output combinations and are referred to as
"transaction-types". A collection of these transaction-types then constitutes the
application system. Symons models his approach based on these entities and
transaction-types to provide the basis for counting the unadjusted function points.
"MARK II" formula for lnfor-mation Processing Size expressed in Unadjusted Function
Points (UFP) becomes [SYM088]:
where
UFP
=
NiWi + NeWe + NoWoNi
=
number of input data element types, W; = weight of an input data element type,Ne
=
number of entity-type references,We
=
weight of an entity-type reference, N0=
number of output data element types,W0 = weight of an output data element type,
and Ni, Ne, and N0 are each summed over all transaction-types.
The above formula is based on the hypothesis that processing complexity is associated
calibration of weights is based on the average of work-effort in man-hours on each of
the input, output and processing activities.
This data was collected from i 2 systems developed independently of each other. In order for the results from the MARK II approach to be compared with Albrecht's FPA,
the weights are scaled so that the average system size in UFP, for 8 of the systems
which have under 500 UFP, will come out to be identical on both scales. The MARK II
formula, based on the data collected, becomes:
UFP
=
0.44Ni + i .67N9 + 0.38N0Based on this equation, Symons contends that it will be suitable for applications
similar to those of the i 2 systems considered in calibration process. Should there be a
substantial difference in the type of application, or technology, then new weightings
can be calibrated based on new data. Symons contends that calibration is an on-going
process and its credibility• will improve with more relevant data collected through
time.
The comparison between Albrecht's FPA and the MARK II method indicates a general
tendency for the information processing size for MARK II to be larger as system size
increases. Also, the MARK II method shows greater sensitivity for systems with
relatively high or low average numbers of data elements per input or output
component.
The MARK II method is a more objective approach because it is based on a data model.
Explicit counts can be carried out as opposed to Albrecht's method where function
counts tend to be more subjective. However, the usefulness of the MARK II method
tends to be restricted by its technology dependency. The calibration of the weights is
constrained to only those applications within the some domain. Therefore, it cannot be
applied across languages as well as technological boundaries in productivity studies.
The separation of technology dependency and language dependency is important if the
measure is to be "universally" applied.
The use of FPA has proved to be fruitful though it has its own sources of ambiguity
[JONE86]. It is claimed to be useful as a language-independent size predictor but lacks
any effective quantification for the structural aspects of the software. However, this
new concept provides a fresh approach and its potential as a sizing tool is worth
exploring. Symons' MARK II model seems to be a positive step in that direction. A
measure applicable across language is useful and, hence, the separation of language and
technological dependency for the basic unit of measure is seen to be a positive step to
providing a more "universal" measure across-the-board. However, this has not been
successfully achieved in either of the FPA or MARK II methodologies.
2.1.2 Structure Metric
It has been noted that experienced programmers tend to look at the overall patterns of
programs rather than the detailed coding, which the novice is likely to do [JONE86].
The association of familiar patterns to improved productivity provides an initial
interest in studying the complexity of code.
Structure metrics assist the study of the various patterns associated with data or
functions of a program. The metric provides measurements for the functions or data to
be programmed and the programmed code itself. The former relates to data structure
metrics and looks at how data is handled by the functions in a program. The latter is an
Jackson, Warnier and Orr assert that data is the essence of a system and changes to its
structure will affect the overall development effort [JONE86,pp. 69]. However, this
is more applicable to business systems than it is to scientific systems, such as
real-time or process systems. In scientific systems there are apparently greater
processing involved and its influence on the development effort can be considerable.
Hence, data structure metrics seem to be. more applicable to systems where the data
complexity is high and processing complexity is low.
Although some insight has been obtained into measuring complexity using structure
metrics, e.g. logic structure metrics; the real relevance of complexity to program size
is not yet known [JONE86].
The following sections discuss the two structure metrics used by researchers.
2.1.2.1 Logic Structure
The approach used to study the logic structure of a program and determine its
complexity is mainly attributed to the works of Thomas McCabe. He uses a directed
"
graph of program control flow structures as a basis for the measurement. For
example, a graph of nodes (or decision points) linked to each other is shown in Fig.i
below, which is taken from [JONE86], and illustrates the control flow of a program.
By counting the number of regions in the resultant graph, the cyclomatic complexity is
determined . The regions counted on Fig.i are marked by Rk where k ranges from 1 to
5.
McCabe noted a certain correlation between the complexity measure and the
error-proneness of a program. A program with a higher measure of cyclomatic complexity or
McCabe's study suggests a successful bug indicator. That is, it can be used to predict
errors and, hence, at least one aspect of development effort.
R1
R2
/
Fig.1: Control flow graph, G, with complexity, V(G)
=
5.McCabe's Cyclomatic Complexity measure is criticized for its lack of empirical
support. A critique by Shepperd [SHEP88] provides a detailed evaluation and
examination of the deficiencies of this complexity metric. One controversy suggested is
the limitation of the code-branching situations considered in the method and, as a
resulti anomalies arises in the application of counting rules for the wider range of
programming languages. The results of various empirical validation studies do not give
a great deal of support to the cyclomatic complexity measure, whether it be the
predictive value for software characteristics or the testing and maintenance of
software. Further, McCabe's measure does not relate the effects of data complexity
[JONE86]. This is important in many data-centered based applications as well as high
The use of the cyclomatic complexity measure has proved to be a successful predictor
for errors but remains inadequate in other aspects, such as data complexity. However,
this technique provides a good start to the study of this difficult area.
Other logic structure metrics are the Schneidewind and Hoffmann metrics for the
minimum number of paths in a program and the reachability of any node. The
minimum number of paths is determined by a unique sequence of arcs from the start
node to the terminal node. The determination of reachability is to find the number of
unique ways of reaching a node [CONT86]. Other logic structures involve nesting
levels and transfer usage for direct transfers.
2.1.2.2 Data Structure
Data structure metrics involve measuring the behaviour of data within a module as
well as across different modules. It counts the amount of data input to , processed in,
and output from a program or software [CONT86]. Most metrics looks at activities
related to process data, this metric measurement attempts to capture measurement
related to the way data is structured and to determine how they would affect
development. Hence, data structure metrics attempts to measure data complexity.
Halstead's count on unique operands, n2 and total occurrences of operands, N2 is an
example of a data structure metric [HALS77]. However, this metric does not capture
the amount of usage which relates the operands [CONT86]. Other data structure
measures include counting the number of variables in the cross-reference listings of
programs and their relative usage.
As noted in [JONE86], the study of data structure complexity remains difficult as the
number of interactions between data elements could be enormous for large-scale file
of the need to have better understanding of data complexity. Although insufficient
research has been carried out in this particular area, there is a growing interest in the
light of the emergence of high-volume data storage devices.
2.1.3 Composite Metrics
A single metric is used to measure a particular feature of a program. A composite
metric uses a combination of more than one of the basic metrics in order to provide a
measurement which would better describe the overall behaviour of software.
Several existing metrics used by researchers are, in fact, composite metrics because
they attempt to measure aspects of programs based on more than one metric. Software
Science uses the basic counts of operators and operands to formulate the many different
equations used to describe various aspects of program characteristics. Metrics such as
the program length, program volume or potential volume and program difficulty are
composite metrics which serve different purposes and extend its influence to some
estimation models.
Function Point Analysis (FPA) uses the function point as a basic measure and applies
an adjustment factor which deals with the complexity of the software to be developed.
This attempt to incorporate complexity measures to function points is designed to
provide a more accurate measure. Hence, it is also a composite metric. Capers Jones
indicated the usefulness of such combinations and further suggest complementing
Albrecht's FPA, which lacks structural complexity considerations, with McCabe's
Complexity Metric, which is strong in dealing with structural complexity [JON E86,
pp. 78]. There is a good indication that composite metrics will resolve many of the
Baker and Zweben also proposed a composite metric of software science, E, and
McCabe's metric V(G). Although composite metrics may resolve certain problems, it
also has the possibility of introducing confusion to the results if additional metrics are
added indiscriminately. Therefore, caution will have to be taken in metric addition for
any composite metric to yield useful results.
Another candidate composite metric is the MARK II function point analysis method.
2.2
Review of Software Sizing Models
The attempts in measuring and estimating software characteristics paved the way for
subsequent model developments. A combination of the fundamental concepts has been
applied in the construction of some of the models.
In a comprehensive suNey of software sizing models [DACS87], the Data and Analysis
Centre for Software (DACB) presents a detailed review of fourteen different sizing
models. The study categorized the sizing models on the basis of their underlying
principles and techniques. Six automated models are then applied in an experiment to
evaluate the accuracy of the size estimates. Lines of Code (LOC) is used as the output
for all the six models for standardization purposes. The result of the experiment shows
a wide range of estimates ( in LOC) with the highest estimate being 37,600 LOC and the
lowest estimate being 6,622 LOC. The actual size of the software developed is 9,177
LOC. This variation shows that the basis of the measurements for each approach does
contribute to the size prediction of the actuals. Moreover, the departure of each
estimate for each model from the actual suggests that there is still a great degree of
uncertainty. A comparison of the basic differences for the four general categories of
The first category is Size by Analogy. This method requires a database containing information from previous software projects. The approach then relates the proposed
project with modules and systems of similar functions and environment requirements
contained within the information repository. On this basis, a selection of appropriate
sizes for the modules are made and a size estimate of the system is obtained. This
category of sizing models are language-dependent as well as technology-dependent and
the predictions are based on historical data. The use of LOC as size data in the
information repository implies a language constraint. If it is to be applied across
languages, more historical size data will have to be accumulated which makes it quite
inefficient. Sizing models which come under this category are ESD Sizer, SSA
(Software Sizing Analyser) and QSM Fuzzy logic size planner. ESD Sizer gives an
estimated size of 37,600 LOC in the test case study. This has the highest departure
from the actual size.
The second category is a statistical approach known as Size-in-Size-out. This
approach uses approximate size estimates and transforms them into a more exact
estimate using statistical methods. Some of the methods require the use of size ranges, .I
relative ranking of data, estimates for a portion of the system and/or independent
expert estimates. The application of this method requires a thorough understanding of
the modularity and functionality of the system; including, perhaps, an expert
consensus mechanism. Methods in this category use LOC as an input parameter and
statistical techniques are applied to operate on the estimated LOC to produce a more
accurate predicted size estimate. As the initial basis of the size estimate (in LOC) is
intuitive, they are dependent on the experience of the estimator. This can be
subjective. Models in this category are the Wideband Delphi Technique, the PERT
(Program Estimating and Reporting Tool) model, SSM (Software Sizing Model) and the
Curve-Fitting Model. SSM produces a size estimate of 11,700 LOC in the experiment.
The third category is identified as the Linguistic Approach. Based on Halstead's theory
on the fundamental relationship between operators and operands, this approach uses
the length equation [HALS??] to determine the length of a program. The counting rule
is based on counting lexical symbols used in the expressions of algorithms found in
engineering equations or pseudo code of detailed design. This method may be useful in
scientific applications but not business applications. As engineering equations may be
obtained early in the development process, it does serve as an early predictor.
However, business applications require pseudo code to be developed before any
prediction on the size can be done. This does not allow early size estimates. Models
which adopt this approach are the State-Machines Model and ASSET-R (Analytical
Software Size Estimation Tool - Real-time) Model. ASSET-R also incorporates
function point counts as part of its equation used in the estimation process. In the test
case study, ASSET-R produces a size estimate which is one of the closest to the actual.
This method is dependent on accurate engineering equations and, hence, is more suitable
for scientific application.
The fourth category is Function Point Analysis. This method adopts the fundamental
concept of Albrecht's Function Point Analysis method as described in an earlier section.
Models for this approach include BYL (Before You Leap), SPQR Sizer/FP, QSM Size
Planner and Feature Points. This method applied the composite metric concept.
Although this category of sizing tools can be applied across languages, the resultant size
estimates have to be converted to LOC for comparative as well as productivity studies.
As noted in [DACS87], expansion factors used in converting function point to LOC in the
implementation language(s) will have to be "corrected" to the current technology if the
output in LOC is required for that particular organization.
In evaluating the above categories of sizing models, almost all require some form of
historical data to be accumulated if a standardized unit of measure (LOC for example) is
within a model. As size information gathered from previous projects are dependent on
the application domain, its use is somewhat limited. This will be further elaborated in
a later section. The use of expansion factors for function point conversions are
technology-dependent. They are not suitable for wider applications. Also, relevant
application domain knowledge may be a pre-requisite to the appropriate choice of
models to be used as not all models are developed under the same environmental
conditions. An obvious distinction is between scientific and business applications.
ASSET-Rand SSM models have shown the most accurate estimates in the above test case
study. The SSM model uses statistical tecliniques. ASSET-R uses both function points
and token counts, ie. operators and operands. However, ASSET-R seems to be more
appropriate for scientific and real-time systems. The case study conducted for the
experiment is, apparently, a scientific application.
[DACS87] also identified the need for more experience amongst users of sizing models
in order for more accurate estimates to be predicted. They attributed the cause of
inaccuracy to the lack of ,definitive information early in the development life-cycle.
This necessarily implies a need for greater experience amongst users if improved
results are to be attained. Otherwise some form of intuition is necessary. When
~
"guess-timates" are done, variability in the outcome can be expected.
Language expansion factors are found to vary, for the same language, from vendor to
vendor. The main reasons mentioned are [DACS87):
a. Values based on different dataset
b. Variations in programming skills and language
c. Model inputs tend to be subjective and different analysts may produce different
function points for the system. Hence, the lines of code per function point ratio