This is a repository copy of Pedestrians and Pedal Cyclists in a British, Dutch and
Swedish Modelling Area.
White Rose Research Online URL for this paper:
http://eprints.whiterose.ac.uk/2259/
Monograph:
van Shagen, I.N.L.G. (1990) Pedestrians and Pedal Cyclists in a British, Dutch and
Swedish Modelling Area. Working Paper. Institute of Transport Studies, University of Leeds
, Leeds, UK.
Working Paper 301
Reuse
Unless indicated otherwise, fulltext items are protected by copyright with all rights reserved. The copyright exception in section 29 of the Copyright, Designs and Patents Act 1988 allows the making of a single copy solely for the purpose of non-commercial research or private study within the limits of fair dealing. The publisher or other rights-holder may allow further reproduction and re-use of this version - refer to the White Rose Research Online record for this item. Where records identify the publisher as the copyright holder, users can verify any specific terms of use on the publisher’s website.
Takedown
If you consider content in White Rose Research Online to be in breach of UK law, please notify us by
White Rose Research Online
http://eprints.whiterose.ac.uk/
Institute of Transport Studies
University of Leeds
This is an ITS Working Paper produced and published by the University of
Leeds. ITS Working Papers are intended to provide information and encourage
discussion on a topic in advance of formal publication. They represent only the
views of the authors, and do not necessarily reflect the views or approval of the
sponsors.
White Rose Repository URL for this paper:
http://eprints.whiterose.ac.uk/
2259/
Published paper
Drive Project V1031: An Intelligent Traffic System for Vulnerable Road Users Workpackage 5: Route Choice Criteria Studies
DRIVE Project V1031
An Intelligent Traffic System for Vulnerable Road Users
TRAVEL CHARACTERISTICS OF PEDESTRIANS AND PEDAL CYCLISTS IN A BRITISH, DUTCH AND SWEDISH MODELLING AREA
I.N.L.G. van Schagen
Deliverable No. 8A
Workpackage 5: Route Choice Criteria Studies
Workpackage Leader: I.N.L.G. van Schagen, TRC, University of Groningen
ITS Working Paper 301
The research reported herein was conducted under the European Community DRIVE Programme. The project is being carried out by a consortium comprising: Institute for Transport Studies, The University of Leeds; West Yorkshire Highways Engineering and Technical Services; Traffic Research Centre, University of Groningen; Department of Traffic Planning and Engineering, Lund Institute of Technology, Lund University; and H.B. Modules Limited. The opinions, findings and conclusions expressed in this report are those of the author alone and do not necessarily reflect those of the EC or of any organization involved in the project.
Traffic Research Centre University of Groningen P.O. Box 69
9750 AB Haren The Netherlands
Tel.: +31 50 636780, Fax: +31 50 636784
ISSN number: 0142-8942
© 1990 Traffic Research Centre, University of Groningen, The Netherlands
PUBLIC REPORTS OF DRIVE PROJECT V1031
Workpackage 1
Ekman, L., Draskòczy, M. (1989) Problems for vulnerable road users in Sweden. Final report for workpackage 1 of DRIVE project V1031: An intelligent traffic system for vulnerable road users. WP 299, Institute for Transport Studies, University of Leeds.
Schagen, I.N.L.G. van, Rothengatter, J.A. (1989) Problems for vulnerable road users in the Netherlands. Final report for workpackage 1 of DRIVE project V1031: An intelligent traffic system for vulnerable road users. WP 300, Institute for Transport Studies, University of Leeds.
Tight, M.R., Carsten, O.M.J., Sherborne, D.J. (1989) Problems for vulnerable road users in Great Britain. Final report for workpackage 1 of DRIVE project V1031: An intelligent traffic system for vulnerable road users. WP 292, Institute for Transport Studies, University of Leeds.
Workpackage 2
Tight, M.R., Carsten, O.M.J. (1989) Problems for vulnerable road users in Great Britain, The Netherlands and Sweden. Final report for workpackage 2 of DRIVE project V1031: An intelligent traffic system for vulnerable road users. WP 291, Institute for Transport Studies, University of Leeds.
Workpackage 3
SUMMARY
This study looks at a number of travel characteristics of pedestrians and pedal cyclists in specific situations in Bradford (Great Britain), Groningen (The Netherlands) and Växjö (Sweden). A random sample of pedestrians in each of the three countries in a preselected traffic situation and a random sample of pedal cyclists in the same traffic situation, but only in the Netherlands and Sweden, were interviewed and questioned about, among other things, trip purpose, origin-destination, route choice motive and actual route choice. The study is meant to produce the necessary input data of a pedestrian and cyclist traffic micro model, one of the objectives of the project. This report only describes those data, that has potentially wider application than input for the model alone.
TABLE OF CONTENTS
1 INTRODUCTION ... 1
2 METHOD... 3
2.1 SUBJECTS... 3
2.2 SAMPLING METHOD... 3
2.3 THE PEDESTRIAN AND PEDAL CYCLIST INTERVIEW... 3
2.4 PEDESTRIAN OBSERVATIONS ... 4
2.5 DESCRIPTION OF THE EXPERIMENTAL SITES ... 4
3 RESULTS ... 9
3.1 PEDESTRIANS ... 9
3.2 PEDAL CYCLISTS ... 17
4 VALIDITY OF INTERVIEWS ... 25
5 CONCLUDING REMARKS... 27
6 ACKNOWLEDGEMENTS ... 29
7 REFERENCES... 30
1
INTRODUCTION
In built-up areas, walking and cycling are in principle fast and efficient transport modes, that do not contribute to air and noise pollution and take no parking space. In many European cities, these travel modes are encouraged. However, the infrastructure and the facilities are often not adapted to the specific needs of pedestrians and pedal cyclists, but, on the contrary, facilitate motorized traffic. As a consequence, pedestrians and pedal cyclists experience unnecessary delays and may feel neglected by planning engineers. At the same time, both pedestrians and pedal cyclists must be considered as particularly vulnerable road users. The risk per kilometre of getting involved in an accident is much higher than for motorized traffic. An overview of the safety and mobility problems in Great Britain, the Netherlands and Sweden was given in the first stage of the project (Tight, Carsten and Sherborne, 1989; Van Schagen and Rothengatter, 1989; Ekman and Draskòczy, 1989).
One of the aims of the project is to increase the mobility and safety of the vulnerable road users. A number of RTI measures will be taken and evaluated in terms of these characteristics (see Sherborne, 1990, in preparation). In order to enable town planning engineers to predict the consequences of certain measures favouring cyclists and/or pedestrians in terms of delays and safety, a traffic model is under development, that, contrary to existing traffic models, gives the vulnerable road user a central place.
As a first step, the project envisages a model on a micro level rather than a city wide macro model. One of the reasons is that in a micro model the interactions between different transport modes can be simulated in more detail and therefore better conclusions can be drawn about the effects of infrastructural and technical changes upon delays and safety. In each of the three participating countries an experimental site was selected. For Britain this site is located at an outer ring road in Bradford, a city with a population of 460,000 in a metropolitan area with a population of over two million; in the Netherlands at one of the major roads entering and leaving the city of Groningen (160,000 inhabitants) and in Sweden in the middle of Växjö, a middle sized town with 68,000 inhabitants. At these sites the RTI-measures will be evaluated and the model will be validated. The three sites have in common that each is a three-junction area, with at least one of these junctions being traffic light controlled. The three situations have relatively high vulnerable road user flows, which almost exclusively consist of pedestrians in Bradford; in Groningen the majority of vulnerable road users are cyclists; and in Växjö the two groups are more or less equally represented. The sites are not representative for either town, but were selected on the basis of vulnerable road user flow and the possibility to improve the situation for vulnerable road users with the aid of specific RTI applications.
of the model. Location-specific data form only part of the empirical data required by the model. In order to predict throughput, delays and safety, general behaviourial characteristics of pedestrians and pedal cyclists (e.g. rule compliance, gap acceptance) must be known. These "knowledge" data are described by Van Schagen (1990).
This report gives an overview of the general travel characteristics of pedestrians in all three situations and of pedal cyclists in the selected Swedish and Dutch situation. The results with respect to composition of the walking and cycling population, type of origin and destination, trip purpose, route choice motive as well as some behaviourial information (red light violation, delay at crossings) are discussed. Questions that were to be answered concern the comparability of the three sites in terms of the composition of population and travel characteristics of pedestrians and pedal cyclists (trip purpose, type of origin and destination), the influence of age and gender upon trip purpose, the influence of traffic intensities upon route choice motive and the influence of trip purpose upon route choice motive. Data, that are only of interest as input for the model and are unsuitable for wider use (e.g. flow data per junction per manoeuvre, actual routes) are not reported.
3
METHOD
4.1 SUBJECTS
A random sample of pedestrians and pedal cyclists, leaving the experimental site, were stopped and asked to participate in a study about pedestrian (cyclist's) travel characteristics by answering a few questions. In each country approximately 1000 pedestrians were interviewed and in the Netherlands and Sweden also approximately 1000 pedal cyclists. As pedal cyclists are rare in the Bradford situation, cyclist's behaviour will only be modelled for the Groningen and Växjö situation. This means that there was no need to question cyclists in Bradford. The interviews took place on working days between 8 o'clock in the morning and 6 o'clock in the afternoon.
4.3 SAMPLING METHOD
4.4.1 Pedestrians
The interviewers were posted on the pavement. They were instructed to address the first pedestrian who came along after a pause of one minute after finishing the last interview. If pedestrians walked in a group, they addressed the one who walked closest to the interview place. Children with an estimated age of below 12 were not interviewed. If a child was accompanied by an adult, the adult was addressed irrespective of the place in the group. Interviews were held at each point where the experimental site could be left (exit points).
4.4.3 Pedal cyclists
The same procedure was followed in case of pedal cyclists, except that the interviewers stood at the kerb to stop the cyclists.
4.5 THE PEDESTRIAN AND PEDAL CYCLIST INTERVIEW
The interview was a structured interview on the basis of a questionnaire. Four parallel versions of the questionnaires were developed, one in English, one in Urdu, one in Dutch and one in Swedish. The Urdu version was developed in order to tackle the large number of people in the Bradford experimental site who speak that South Asian language. The English version of the pedestrian questionnaire can be found in the appendix of this report. The pedal cyclist's questionnaire had the same structure and content.
In the interview the pedestrians and cyclists were asked to indicate verbally or on a map where they started their pedestrian (bicycle) trip and what type of place this was (e.g home, work, station etc.). Then they were asked where the trip would end and what type of place this was. The next couple of questions concerned the trip purpose: the main purpose, their last destination before the interview and the next destination after the interview. After that some questions were posed about the exact route that was walked or cycled within the borders of the experimental area. The respondents were asked to draw the route on a detailed map of the experimental site. If they passed one or more traffic light controlled junctions on their route, they were asked whether the pedestrian light was green when they arrived (or, if there were no pedestrians lights whether the light was red for traffic on the road crossed). In case of a negative answer, they were asked whether they waited until the pedestrian light turned green (or the traffic lights on the road crossed turned red). A question about route choice criteria was introduced by a question whether they perceived the chosen route (within the borders of the experimental site) as the optimum. If not, they could draw the better alternative on the map of the site. The next question concerned the reason for choosing the route they actually walked or rode. When the answer "shortest" was given, the interviewer explicitly asked whether they meant short in distance or in time. The last questions were about familiarity of the experimental site and the age of the respondent. Gender and walking/cycling alone or in a group was recorded by the interviewer.
4.7 PEDESTRIAN OBSERVATIONS
In order to get an indication about the reliability of the interview and in particular about the drawn routes and the behaviour at traffic lights, a number of pedestrians were followed from the moment they entered the experimental site until they left it. The observer recorded the route, and the behaviour at traffic lights, if the followed pedestrian came across one or more. At the moment the pedestrian left the area, he or she was stopped either by one of the interviewers or by the observer, and asked to participate in the interview. The pedestrian was not told that he or she had been followed and observed. The sampling procedure of the observation subjects was similar to the sampling procedure for the interview. The observer went back to one of the entrance points and started a new observation when the first pedestrian passed. If a pedestrian disappeared into a house or in a shop and did not return within 10 minutes, the observer went back and started to follow the next pedestrian. Observations started at each of the places where pedestrians could enter the experimental site (entry points).
4.9 DESCRIPTION OF THE EXPERIMENTAL SITES
4.10.1 Bradford
Travelling from East to West (with a gradient uphill) one encounters a signalized junction with high traffic flows on all four legs. There are no obvious pedestrian generators at the junction itself, although there are a number of well used bus stops in the direct neighbourhood.
Moving westwards up the hill one passes between terraced houses. There is one 'junction' on the Southern side, but this is blocked off to vehicles and forms a pedestrian access only. There are no pedestrian generators, apart from houses and some doctors' offices up to the next signalized junction.
Near this signalized junction there are bus stops. At two corners are shops, at the third corner is a social services office and at the fourth corner a play school.
Moving further west there are shops on both sides. There are two pedestrian accesses to houses to the rear of the main road. After a stretch of road without pedestrian generators, there is another part with mainly food shops serving the Asian community. Past the food shop there is a public library, a public house and a bank. Next to the library is an uncontrolled junction. On the next stretch of road is a pelican crossing. Further west from the pelican crossing are a number of schools and sheltered housing. There is an uncontrolled junction on the southern side of the road. On the western side of this junction is a swimming baths and a sports centre, both locations being used extensively by school children.
The experimental site is terminated at the western end by a signalized junction. As with other junctions on this length, no pedestrian facilities have been provided.
4.10.3 Groningen
Coming from the north and going south towards the city centre, the first junction is the one that has no traffic lights. The side roads are minor roads and one- directional for motorized traffic (East-West). Pedal cyclists and mopeds are allowed to travel in both directions. There are pavements and zebra crossings (unsignalized) at all legs.
Between the first and the second junction (120 m) there are many small, specialized shops. Busses, taxis, pedal cyclists and mopeds are allowed to travel in both directions; cars only in the north-south direction. There are pavements on both sides of the road.
4.10.5 Växjö
The experimental site in Växjö (Figure 3) is situated in the middle of the city centre and is part of a road connecting the railway station with a pedestrian shopping zone. Its length is approximately 300 m. There are three traffic light controlled junctions, all of which have separate pedestrian crossing lights, activated by a push button. No pedal cyclist facilities are present. Travelling from west to east, the midblock between the first and second junction borders a parking place on the right hand side and a market place on the left (Wednesday and Saturday are market days). Both are important pedestrian generators. The midblock between the second and third junction has some shops.
5
RESULTS
The result section is split into two parts. The first part deals with pedestrians in the Bradford situation in Great Britain, the Groningen situation in the Netherlands and the Växjö situation in Sweden. The second part deals with pedal cyclists in Groningen and Växjö. The percentages do not always add up to 100, due to rounding errors. The total number of cases (n) differs from table to table because of missing values for some variables.
6.1 PEDESTRIANS
6.2.1 The sample
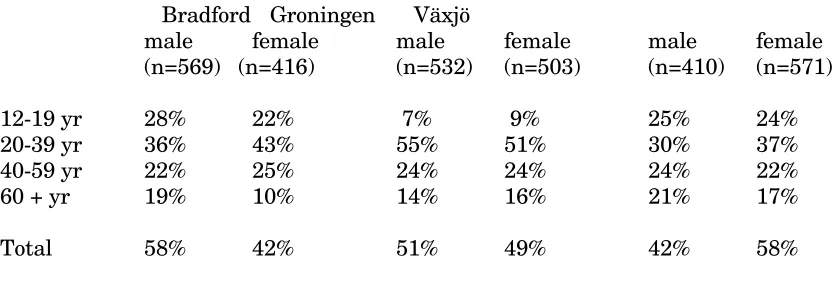
The interviewed sample can be considered as a representative sample of the walking population in each of the experimental sites at the times at which the samples were drawn. Tables 1 and 2 show the age and gender of the sampled population. Age is unknown for a number of respondents (missing cases). The overrepresentation of the age category 20 to 39 in Groningen as compared to Växjö and Bradford might be explained by the university lecture halls in the direct neighbourhood of the experimental site. The pedestrian population in Bradford consists of more men than women, whereas the opposite is true for Växjö. In Groningen both genders are equally represented.
Table 1:Number of pedestrian respondents by age (column percentages in brackets).
Bradford Groningen Växjö
12-19 yr 220 (22%) 80 ( 8%) 240 (24%) 20-39 yr 385 (39%) 554 (53%) 336 (34%) 40-59 yr 233 (24%) 252 (24%) 224 (23%) 60+ yr 147 (15%) 159 (15%) 181 (19%) missing cases 74 0 19
Total 1059 1045 1000
mean age 36.6 yr 37.9 yr 38.2 yr minimum 12.0 yr 14.0 yr 12.0 yr
Table 2: Percentage of pedestrian respondents by age and gender
Bradford Groningen Växjö
male female male female male female (n=569) (n=416) (n=532) (n=503) (n=410) (n=571)
12-19 yr 28% 22% 7% 9% 25% 24%
20-39 yr 36% 43% 55% 51% 30% 37% 40-59 yr 22% 25% 24% 24% 24% 22% 60 + yr 19% 10% 14% 16% 21% 17%
Total 58% 42% 51% 49% 42% 58%
Most people walked alone and not in a group (Table 3). A group was defined as two or more.
Table 3: Percentage of pedestrian trips made alone and in a group
Bradford Groningen Växjö
(n=949) (n=1033) (n=885)
alone 80% 78% 79%
in group 20% 22% 21%
The interviews took place between 8:00 and 18:00 hour. Table 4 shows the proportion of the interviews in five time categories: morning, midday and afternoon peak period (8:00-9:00, 11:30-13:30, 16:30-18:00 respectively) and morning and afternoon off-peak period (9:00-11:30 and 13:30-16:30). Approximately two third of the interviews were carried out in off-peak periods.
Table 4: Percentages of pedestrian interviews in peak and off-peak periods
Bradford Groningen Växjö (n=1057) (n=1045) (n=908)
8:00- 9:00 5% 0% 5%
9:00-11:30 41% 25% 34%
11:30-13:30 0% 25% 27%
13:30-16:30 25% 36% 33%
16:30-18:00 29% 14% 1%
they make more trips in off-peak periods. The presence of secondary schools in the Bradford site might be an explanation.
Table 5:Percentage of pedestrian interviews by age and time (peak/off-peak) period
Bradford Groningen Växjö
peak off peak off peak off
(n=360) (n=697) (n=409) (n=636) (n=303) (n=605)
12-19 yr 30% 18% 8% 7% 18% 28%
20-39 yr 38% 39% 56% 51% 39% 31%
40-59 yr 22% 25% 23% 25% 26% 21%
60 + yr 9% 18% 13% 17% 16% 19%
6.2.3 Origin and destination
Tables 6 and 7 give the type of origin and destination of pedestrian trips. It can be seen, that many pedestrian trips start at home, in particular in Bradford. Also work or school are places where many pedestrian trips start. In Groningen and Växjö, almost a quarter of the pedestrians park their car in the neighbourhood and walk further. Public transport appears to be an important pedestrian generator in Groningen and Växjö. In Bradford only a few pedestrians use the car or a mode of public transport for pretransport. The distribution of destination type is more or less similar to that of origin type. In Växjö, an exception is the car park, which is far less often mentioned as destination than as origin. The fact that the main car park is located in the centre of the experimental site and pedestrians were questioned at the moment they left the experimental site probably forms the explanation.
Table 6: Percentage of pedestrian trips per origin category
Bradford Groningen Växjö
(n=1035) (n=1030) (n=995)
home 64% 35% 17%
work/school 14% 18% 24%
car parking 3% 27% 27%
public transport 4% 14% 21%
other 14% 6% 11%
Table 7: Percentage of pedestrian trips per destination category
Bradford Groningen Växjö
home 44% 38% 23%
work/school 15% 15% 21%
car parking 1% 26% 6%
public transport 6% 13% 13%
other 34% 8% 37%
6.2.5 Trip purpose
[image:21.595.74.436.396.557.2]The main purpose of a pedestrian trip is shown in Table 8. A distinction was made between going home (from e.g. work or school), going to work or school, shopping (including banks and post offices), social visits (such as visiting a friend), official (e.g. dentist, general practitioner, police office, social services etc.) and restaurant/bar. In Groningen and Växjö, shopping is the most important reason for a trip, while pedestrians in Bradford are more often on their way home or to work or school. Social visits are another important reason for a trip in Bradford and less so in Groningen and Växjö. This might be explained by the mainly commercial function of the experimental site in Groningen and also Växjö as compared to the residential function of the site in Bradford. Also the fact that in Bradford relatively many interviews took place in the afternoon peak period (16:30-18:00 h) might explain the differences in trip purpose. The high percentage in the "other" category in Bradford indicates that the trip purposes are more diverse here.
Table 8: Pedestrian trips by main purpose
Bradford Groningen Växjö
(n=1053) (n=1022) (n=989)
going home 25% 6% 9%
going to work/school 15% 9% 13%
shopping 23% 60% 42%
social visit 11% 4% 5%
official visit 3% 7% 9%
restaurant/bar 0% 1% 6%
recreational 3% 5% 4%
other 16% 2% 9%
no specific purpose 3% 6% 3%
Table 9: Pedestrian trips by trip purpose and gender
Bradford Groningen Växjö
male female male female male female (n=581) (n=426) (n=521) (n=492) (n=409) (n=572)
home 22% 26% 7% 6% 10% 9%
official 18% 21% 17% 14% 18% 21%
shopping 24% 24% 55% 66% 36% 46%
social 16% 12% 11% 9% 14% 15%
other 16% 16% 2% 1% 13% 7%
no purpose 4% 1% 8% 4% 3% 2%
Table 10a: Pedestrian trips by trip purpose and age in Bradford
12-19 yr 20-39 yr 40-59 yr 60+ yr
(n=225) (n=391) (n=243) (n=151)
home 36% 23% 19% 16%
official 18% 22% 18% 13%
shopping 10% 22% 31% 35%
social 11% 16% 16% 13%
other 23% 14% 13% 20%
no purpose 3% 3% 2% 3%
Table 10b: Pedestrian trips by trip purpose and age in Groningen
12-19 yr 20-39 yr 40-59 yr 60+ yr
(n=78) (n=541) (n=249) (n=154)
home 17% 7% 4% 2%
official 17% 17% 16% 12%
shopping 50% 60% 62% 62%
social 5% 8% 11% 16%
other 1% 2% 1% 4%
no purpose 10% 5% 6% 4%
Table 10c: Pedestrian trips by trip purpose and age in Växjö
12-19 yr 20-39 yr 40-59 yr 60+ yr
(n=241) (n=308) (n=171) (n=156)
home 19% 7% 5% 6%
official 22% 22% 23% 20%
shopping 27% 42% 45% 58%
no purpose 4% 3% 3% 1%
Apart from the main purpose, trips often have sub-purposes, for example doing some shopping on the way home from work. The pedestrians were asked to where they went to before they were interviewed and where they planned to go to immediately after. One third to one half of the pedestrians did do something between the origin of their trip and the ultimate destination. In most cases they visited a shop. Approximately 40 to 70 percent of the pedestrians planned to go directly home or to school and work after the interview. The majority of the others will visit a(nother) shop before.
6.2.7 Route choice
In each of the three countries, the respondents were familiar with the experimental site, as can be seen in Table 11. In Bradford 70 percent of the pedestrians walk at least once every day through the area. The percentages in Växjö and Groningen are slightly lower, probably because both Groningen and Växjö have an important shopping function for people living in the surrounding small villages. However, the majority visited the place more than once a week.
Table 11:Familiarity with the experimental site (cumulative percentages) in terms of number of visits
Bradford Groningen Växjö
(n=1017) (n=1042) (n=998)
at least every day 71% 33% 46%
at least every week 92% 68% 83%
at least every month 98% 85% 100%
On the question whether they knew another reasonable route from the point they entered the experimental site to the point they left it or reached their destination (apart from the route they actually chose), the majority (75-95%) answered negatively. The pedestrians in Groningen tended more often to know another route. In most cases this was a route at the opposite side of the road.
(Tight and Carsten, 1989). For more information about route choice criteria the reader is referred to the literature review by Hopkinson et al. (1989) mentioned before and to a controlled experiment amongst pedestrians and pedal cyclists reported by Westerdijk (1990).
Table 12: Pedestrian route choice motive
Bradford Groningen Växjö
(n=120) (n=989) (n=1000)
time 42% 12% 10%
distance 23% 31% 58%
pleasantness 3% 20% 7%
attractions 3% 16% 3%
crowdedness 0% 2% 0%
weather protection 0% 0% 0%
safety 18% 2% 4%
other 8% 10% 5%
don't know 3% 8% 12%
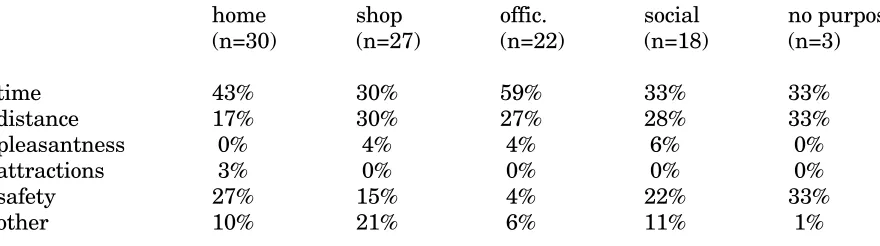
[image:24.595.75.494.499.650.2]Time of the interview and trip purpose might influence the route choice motive. Table 13 gives the percentages of the five most important criteria (time, distance, pleasantness, attractions and safety) in peak and off-peak periods. In Table 14 these criteria are compared for different trip purposes for the Bradford situation (14a), the Groningen situation (14b) and the Växjö situation (14c). The Bradford results have to be interpreted with care because of the small number of interviews per cell.
Table 13: Pedestrian route choice motive by peak/off-peak period
Bradford Groningen Växjö
peak off peak off peak off
(n=34) (n=86) (n=394) (n=595) (n=302) (n=600)
time 47% 41% 14% 10% 9% 10%
distance 21% 24% 32% 30% 60% 57%
pleasantness 0% 4% 17% 22% 9% 6%
attractions 3% 2% 16% 16% 2% 4%
safety 27% 14% 1% 2% 4% 4%
other 3% 15% 20% 20% 16% 19%
Table 14a: Pedestrian route choice motive by trip purpose in Bradford
home shop offic. social no purpose
(n=30) (n=27) (n=22) (n=18) (n=3)
time 43% 30% 59% 33% 33%
distance 17% 30% 27% 28% 33%
pleasantness 0% 4% 4% 6% 0%
attractions 3% 0% 0% 0% 0%
safety 27% 15% 4% 22% 33%
other 10% 21% 6% 11% 1%
[image:26.595.64.526.344.457.2]The Bradford data indicate that time is a more important criterion for trips with an official purpose and trips homewards than for other trips. Safety is less often a motive for route choice on official trips as compared to other types of trips.
Table 14b: Pedestrian route choice motive by trip purpose in Groningen
home shop offic. social no purpose
(n=59) (n=579) (n=154) (n=101) (n=58)
time 12% 11% 12% 8% 19%
distance 34% 33% 32% 19% 15%
pleasantness 7% 18% 17% 36% 28%
attractions 19% 19% 9% 19% 2%
other 28% 19% 30% 18% 36%
[image:26.595.166.523.605.727.2]In Groningen, route choice on social trips and trips without a specific purpose is less based on distance and more on pleasantness than other trips. Pleasantness is not important on trips homewards, which might be explained by the familiarity of the routes leading home. Attractions influence route choice only minimally on official trips. The fact that attractions are almost never mentioned as motive for route choice on trips without a purpose can be explained by the definitions of both concepts. The Växjö results show similar tendencies as the Groningen results, though the differences are less pronounced.
Table 14c: Pedestrian route choice criteria by trip purpose in Växjö
home shop offic. social no purpose
(n=94) (n=410) (n=217) (n=144) (n=26)
time 11% 8% 11% 12% 8%
distance 60% 59% 63% 54% 50%
pleasantness 5% 8% 6% 7% 12%
attractions 4% 4% 1% 3% 0%
safety 4% 4% 4% 4% 4%
6.2.9 Delay at traffic lights and red light violation
Pedestrian traffic lights and traffic lights for road traffic form an important cause for delays in pedestrian trips. Pedestrian traffic lights are available in the Bradford situation and in the Växjö situation. In Bradford there is one pelican crossing, about half way through the experimental site. In Växjö each of the three junctions of the experimental site has been provided with pedestrian lights. In Växjö 670 (67%) pedestrians crossed at least at one pedestrian traffic light. A total of 995 crossings were made at a traffic light. This is an average of 1.5 crossings per pedestrian. In Bradford only 79 (8%) pedestrians in the experimental area used the pelican crossing. The experimental junctions in Bradford and Groningen do not have pedestrian crossing lights. The three main junctions in Bradford and two of the three junctions in Groningen do have road traffic lights, which means a constant flow when road traffic has green and therefore only narrow gaps to cross. In Bradford 462 (45%) pedestrians crossed at least one of these traffic light controlled junctions and in Groningen 829 (79%) pedestrians. The total number of crossings at traffic light controlled junctions was 486 in Bradford and 1631 in Groningen. The average number of crossings at traffic light controlled junctions per pedestrian is thus slightly more than one in Bradford and almost two in Groningen.
[image:27.595.134.445.474.585.2]The pedestrians were asked whether they had to wait before they could cross or whether they could just walk on. In Groningen only those pedestrians who said that traffic at the crossroad had green had to answer this question. Table 15 shows that in Bradford approximately two third of the pedestrians had to wait before they could cross and in Groningen and Växjö approximately one third.
Table 15: Delay at traffic light controlled crossings
Bradford Groningen Växjö
pelic. cr. junct. junct. ped. light (n=79) (n=467) (n=586) (n=995)
don't know 24% 21% 8% 8%
waited 62% 72% 39% 35%
walked on 38% 28% 61% 65%
6.3 PEDAL CYCLISTS
6.4.1 The sample
[image:28.595.74.420.334.494.2]In Groningen and Växjö cyclists leaving the area were questioned in addition to pedestrians. Four different age categories were distinguished. The number of interviews per age category is presented in Table 16; the number of respondents by age and gender in Table 17. As for pedestrians, in Groningen the age category 20-39 is far more important than in Växjö, while Växjö has more elderly cyclists than Groningen. These differences can be largely attributed to differences in the composition of the population of both towns. Since Groningen is a University town, the age group 20-39 is highly represented. In addition, the lecture halls are situated near the Groningen site and the bicycle is an important mode of transport for the students. In both towns there are approximately an equal number of male and female cyclists in each age category.
Table 16:Number of cyclist respondents per age category (column percentages in brackets)
Groningen Växjö
12-19 yr 181 (18%) 216 (22%)
20-39 yr 631 (62%) 316 (32%)
40-59 yr 123 (12%) 250 (26%)
60+ yr 76 ( 8%) 195 (20%)
missing cases 1 26
Total 1012 1003
Mean age 30.1 38.5
minimum 12.0 13.0
maximum 83.0 82.0
Table 17: Respondents by age and gender (column percentages)
Groningen Växjö
(n=1000) (n=977)
male female male female
12-19 yr 17% 20% 21% 23%
20-39 yr 65% 59% 33% 31%
40-59 yr 11% 13% 23% 28%
60+ yr 7% 8% 22% 18%
Total 55% 45% 48% 52%
Table 18: Interviews by time period
Groningen Växjö
(n=1012) (n=787)
8:00- 9:00 1% 15%
9:00-11:30 24% 36%
11:30-13:30 29% 15%
13:30-16:30 33% 31%
16:30-18:00 13% 3%
The age distribution in both peak and off-peak periods is shown in Table 19. In both locations, the 40–59 age group is more common in peak periods.
Table 19: Interviews in peak and off-peak periods by age
Groningen Växjö
peak off-peak peak off-peak
(n=430) (n=581) (n=253) (n=528)
12-19 yr 18% 18% 18% 24%
20-39 yr 63% 62% 28% 34%
40-59 yr 14% 11% 33% 22%
60+ yr 5% 9% 21% 20%
6.4.3 Origin and destination
Tables 20 and 21 show the type of origin and destination of pedal cyclists. Many cyclists come from or go to their home. In Växjö public transport, in particular the train, is often used as a form of pre-transport for a bicycle trip. In Sweden one is not allowed to take a bicycle onto the train. The possibility of taking the bicycle on interurban busses is seldom used. The high number of bicycle trips starting or ending with public transport is probably to be explained by people parking their bicycles near the railway station.
Table 20: Pedal cycle trips by origin category
Groningen Växjö
(n=1004) (n=996)
home 60% 48%
work/school 34% 38%
public transport 1% 13%
Table 21: Pedal cycle trips by destination category
Groningen Växjö
(n=1010) (n=980)
home 73% 43%
work/school 18% 26%
public transport 1% 30%
other 5% 2%
6.4.5 Trip purpose
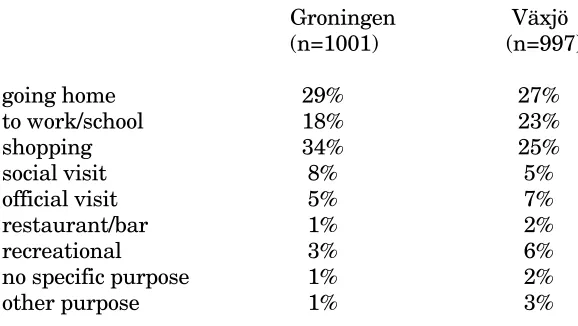
[image:32.595.71.360.343.506.2]Table 22 gives the main purpose of the pedal cycle trips. As can be seen in this table, going home, going to work or school and shopping explain approximately three quarters of the bicycle trips. In Groningen, shopping is slightly more important than in Sweden.
Table 22: Main purpose of the pedal cycle trip
Groningen Växjö
(n=1001) (n=997)
going home 29% 27%
to work/school 18% 23%
shopping 34% 25%
social visit 8% 5%
official visit 5% 7%
restaurant/bar 1% 2%
recreational 3% 6%
no specific purpose 1% 2%
other purpose 1% 3%
Table 23: Pedal cycle trip purpose by gender
Groningen Växjö
male female male female
(n=544) (n=446) (n=464) (n=512)
home 31% 27% 26% 28%
shopping 29% 41% 22% 26%
social 14% 9% 17% 10%
official 24% 22% 29% 31%
no purpose 1% 0% 2% 2%
other 2% 1% 3% 3%
Table 24a: Pedal cycle trip purpose by age in Groningen
12-19 yr 20-39 yr 40-59 yr 60+ yr (n=179) (n=623) (n=123) (n=75)
home 40% 30% 26% 3%
shopping 26% 32% 43% 64%
social 11% 11% 10% 15%
official 22% 25% 19% 15%
no purpose 1% 1% 0% 1%
other 1% 1% 2% 3%
Table 24b: Pedal cycle trip purpose by age in Växjö
12-19 yr 20-39 yr 40-59 yr 60+ yr
(n=216) (n=324) (n=252) (n=194)
home 25% 30% 31% 18%
shopping 17% 18% 23% 44%
social 15% 13% 12% 15%
official 34% 34% 31% 18%
no purpose 7% 1% 0% 0%
6.4.7 Route choice
In general the pedal cyclists knew the experimental site rather well. Table 25 shows the average frequency of visiting or passing through the site. Almost all cyclists visited the site more than once a week.
Table 25:Familiarity with the experimental site in terms of number of visits (cumulative percentages)
Groningen Växjö
(n=1007) (n=997)
at least once every day 64% 45% at least once every week 93% 90% at least once every month 98% 100%
The route choice alternatives within the experimental area are very limited for cyclists. The question on route choice motive was asked without referring to alternatives inside the experimental area.
The main reason that cyclists chose the route they did is presented in Table 26. Distance is the most important criterion for route choice in both Groningen and Växjö. In Växjö, however, it is far more important and almost the only explaining factor. In Groningen, time, pleasantness and specific attractions in the area determine route choice almost as much as distance. Safety aspects do not have a major influence on route choice.
Table 26: Pedal cyclist route choice motive
Groningen Växjö
(n=966) (n=978)
time 18% 9%
distance 24% 62%
pleasantness 15% 6%
attractions 19% 3%
slope — 1%
crowdedness 2% 3%
safety 1% 4%
other 11% 6%
don't know 9% 8%
Table 27: Pedal cyclist route choice motive in peak and off-peak periods
Groningen Växjö
peak off-peak peak off-peak
(n=409) (n=557) (n=252) (n=531)
time 18% 19% 9% 10%
distance 26% 22% 57% 61%
pleasantness 15% 15% 5% 6%
attractions 17% 20% 4% 2%
other 17% 14% 17% 12%
don't know 8% 10% 8% 9%
The effects of trip purpose on route choice motive are different in Groningen and Växjö (Table 28a and 28b). In Groningen, time is most important for official and social trips, while distance is more important for shopping trips and, to a lesser extent, for trips homewards. On shopping trips, apart from distance, attractions are also an important motive for route choice. In Växjö, for all bicycle trips distance is the most important motive for the chosen route. For official trips time becomes relatively more important and for social trips general pleasantness of a route determines the choice for a greater extent. For more information on route choice criteria of pedestrians and the influence of gender and age upon criteria the reader is referred to the literature review by Hopkinson et al. (1989) and the results of a route choice experiment (Westerdijk, 1990).
Table 28a: Pedal cyclist route choice motive by trip purpose in Groningen
home shop offic. social
(n=278) (n=327) (n=225) (n=109)
time 14% 16% 24% 24%
distance 27% 33% 21% 24%
pleasantness 16% 12% 15% 20%
attractions 14% 26% 16% 11%
other 16% 14% 16% 15%
don't know 13% 8% 8% 6%
Table 28b: Pedal cyclist route choice motive by trip purpose in Växjö
home shop offic. social
(n=257) (n=241) (n=303) (n=132)
time 8% 7% 14% 8%
distance 63% 63% 61% 62%
pleasantness 4% 6% 5% 15%
other 7% 11% 8% 5%
don't know 13% 11% 10% 12%
6.4.9 Red light violation
Both at the Groningen location and the Växjö location, there are no separate pedal cyclist's traffic lights. Two of the three junctions in Groningen and all three junction in Växjö have been provided with traffic lights. In Groningen, 883 (87.1%) cyclists passed by at least one of the lights, 735 (72.4%) cyclists passed by both. In Växjö, 859 (86%) passed by at least one of the traffic lights and a total of 1196 crossings were made. The cyclists who arrived at red or yellow were asked whether they waited or not. Table 29 contains the results. It appears that red light violation by pedal cyclists is markedly higher in Groningen than in Växjö. This finding is confirmed by observation studies at the same locations (Van Schagen, 1990), though in Växjö the actual observed percentage red light violation is higher than the percentage self-reported.
Table 29: Pedal cyclists' self reported red light violation
Groningen Växjö
(n=758) (n=560)
no violation 57% 91%
7 VALIDITY OF INTERVIEWS
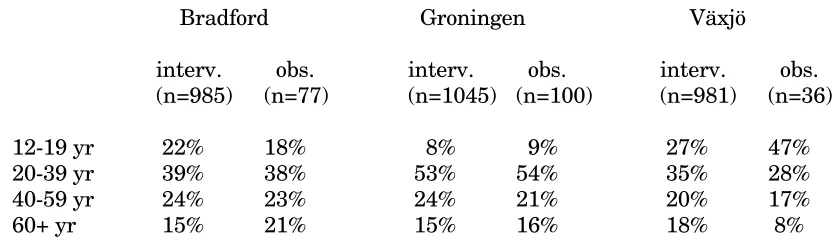
In order to get an impression of the validity of interviews for collecting behaviourial data, a subsample of 100 pedestrians in Bradford and Groningen and 41 in Växjö was observed before they were asked to participate in the interview. The observation started at one of the entrance points to the area and ended at the moment the pedestrian left the area. The observer recorded the exact taken route and the situation at the traffic light controlled junction(s), i.e. state of the traffic light and behaviour of the pedestrian. Tables 30 and 31 show the representativeness of the subsample in comparison with the total sample with respect to age and gender.
Table 30: Pedestrian respondents (interviews and observations) by age
Bradford Groningen Växjö
interv. obs. interv. obs. interv. obs. (n=985) (n=77) (n=1045) (n=100) (n=981) (n=36)
12-19 yr 22% 18% 8% 9% 27% 47%
20-39 yr 39% 38% 53% 54% 35% 28%
40-59 yr 24% 23% 24% 21% 20% 17%
[image:37.595.66.483.319.444.2]60+ yr 15% 21% 15% 16% 18% 8%
Table 31: Pedestrian respondents (interviews and observations) by gender
Bradford Groningen Växjö
interv. obs. interv. obs. interv. obs. (n=985) (n=77) (n=1035) (n=100) (n=981) (n=36)
male 58% 53% 51% 52% 42% 47%
female 42% 47% 49% 48% 58% 53%
In general it can be said that on age and gender characteristics the observed pedestrians are similar to the pedestrians who were only interviewed. In Växjö relatively more young pedestrians and relatively few elderly were followed.
found that 13 percent of the reported routes deviated from the observed routes. The British results, however, show a less positive result. One third of the reported routes did not coincide with the observed routes. Of these differences, 77 percent were major ones, for example walking at the opposite side of the road, reporting crossings that did not take place or not reporting crossings that did take place. A concrete example might illustrate this: in total 67 crossings were observed, while only 52 were reported to the interviewer. The difference between Bradford on the one hand and Groningen and Växjö on the other might be explained by the fact that the size of the experimental area is much larger in Bradford than in Groningen and Växjö, so that forgetting over time might have played a more important role in Bradford.
Table 32: Comparison of reported and observed pedestrian routes
Bradford Groningen Växjö
(n=76) (n=100) (n=41)
identical 66% 86% 90%
different 34% 14% 10%
The similarity between observed and reported behaviour with respect to behaviour at traffic lights is only computed for the Groningen and Växjö situation (Table 33). The Bradford observation data at the pelican crossing is too limited to analyze (only three pedestrians could be observed). The Groningen situation and the Växjö situation is difficult to compare, because in Groningen interviewees were asked about the stage of the traffic light for traffic at the road crossed and in Växjö about the pedestrian traffic light. A tentative conclusion can be drawn that an interview is a relatively reliable method for collecting data on concrete pedestrian behaviour in interaction with other traffic, if the interview takes place immediately after the behaviour is performed. Even if a person is questioned about socially undesirable behaviour, such as red light violation, the answers are reliable.
Table 33:Comparison of reported and observed pedestrian behaviour at traffic lights
Groningen Växjö
(n=139) (n=116)
identical 86% 97%
9 CONCLUDING REMARKS
The data collected in the interviews contain much information that is valuable as input for the pedal cyclist and pedestrian model of the three experimental areas in Bradford (Great Britain), Groningen (The Netherlands) and Växjö (Sweden). These data together with behaviourial observation and literature data (Van Schagen, 1990) will feed the pedestrian and pedal cyclist model, so that valid predictions can be made on the flows, delays and safety of vulnerable road users in the modelled areas.
The data as such give some indications about travel characteristics of pedestrians and pedal cyclists in the three experimental situations. In general it can be concluded that the composition of the pedestrian and pedal cyclist population and their travel characteristics such as trip purpose, type of origin and destination and route choice motive largely depend on the main function of the site. The function of the Groningen and Växjö sites is mainly a shopping one, while the function of the Bradford site is far more diverse: shopping, cultural (library), official (social services, police office) and residential. This might explain why in many cases the results of Groningen and Växjö are rather similar and the Bradford results diverge.
However, a number of similarities in pedestrian travel patterns can be found, irrespective of the main function of the area. The majority of pedestrians walk alone, not in company. In general they are familiar with the route they walk. Therefore it might be expected that changes in the road lay-out or in traffic signal changes will be noticed and that behaviour might be adapted to the new created situation. Pedestrians often use public or private pre-transport to cover the distance between the residential areas and the commercial city centre. Pedestrian routes are chosen mainly to minimize time and/or distance. In Växjö and Groningen distance is more important than time. In Bradford the results indicate the opposite. There is some indication that the difference is to be explained by differences in trip purpose: in Växjö and Groningen shopping is the main purpose for the trip and distance is the most important route choice motive, maybe to minimize carrying goods; in Bradford official trips and trips homewards are more frequent and here time is minimized. On the other hand, in most pedestrian trips, time and distance are highly interrelated. Therefore it might have been difficult for the interviewees to differentiate between the two concepts, despite the explicit question posed by the interviewers to do so (see also Hopkinson et al., 1989). One of the aims of the project is to decrease delay time for pedestrians in order to redirect flows from midblock crossings towards safer (signalized) crossing places and to decrease red light violation rates. In one of the next studies within the project, this idea will be tested experimentally, so that a more conclusive answer to the time/distance debate might be found.
route choice motive for pedal cyclists. In Växjö, however, it is almost the only important factor, whereas in Groningen time, general pleasantness of a route and specific attractions along the route are also important factors in route choice. Safety hardly influences the route choice of pedal cyclists. Both in the Groningen and Växjö experimental situation, the majority of the pedal cyclists are confronted with traffic lights and therefore experience delays. The self-reported red light violation rates show that the Groningen cyclists markedly more often violate the light than the Växjö cyclists. This local or cultural difference is confirmed by observational data at the same sites (Van Schagen, 1990), though the absolute difference appeared to be smaller, because the observed red light violation rates in Växjö are larger than the reported rates.
In the introduction, a number of questions were posed about the mutual relationships of age and gender of pedestrians and pedal cyclists, traffic intensities, trip purpose and route choice motive. Many of the relationships are inconclusive, because the direction of the differences varies by site (i.e. by function of the location). The influence of gender upon trip purpose and on route choice motive is marginal. Elderly pedestrians and cyclists make slightly fewer trips under time pressure (i.e. official trips); the other age groups are rather similar in this regard. Age is not an important factor in route choice motive. Traffic intensities, defined as peak and off-peak periods, hardly influence route choice motive. An exception is the safety motive in the Bradford situation that is rated almost twice as important at times with high traffic intensities. This can be explained by the finding that Bradford has the worst safety problem for pedestrians as compared with the two other sites (Tight and Carsten, 1989). The influence of age, gender, and trip purpose on route choice criteria has been tested experimentally (Westerdijk, 1990) and the results from this study confirm the absence of a relationship. Even though age, gender and traffic intensities hardly influence travel characteristics, these variables do influence traffic behaviour, such as red light violation and gap acceptance. This is reported in Van Schagen (1990).
11
ACKNOWLEDGEMENTS
13
REFERENCES
EKMAN, L. AND DRASKÒCZY, M. (1989) Problems for vulnerable road users in Sweden. Final report for workpackage 1 of DRIVE project V1031: An intelligent traffic system for vulnerable road users. WP 299, Institute for Transport Studies, University of Leeds.
HILL, M.R. (1984) Stalking the urban pedestrian: a comparison of questionnaire and tracking methodologies for behavioral mapping in large scale environments. Environment and Behavior, 16, 539-550.
HOPKINSON, P.G., CARSTEN, O.M.J. AND TIGHT, M.R. (1989) Review of literature on pedestrian and cyclist route choice criteria. Final report for workpackage 3 of DRIVE project V1031: An intelligent traffic system for vulnerable road users. WP 290, Institute for Transport Studies, University of Leeds.
SCHAGEN, I.N.L.G. VAN AND ROTHENGATTER, J.A. (1989) Problems for vulnerable road users in the Netherlands. Final report for workpackage 1 of DRIVE project V1031: An intelligent traffic system for vulnerable road users. WP 300, Institute for Transport Studies, University of Leeds.
SCHAGEN, I.N.L.G. VAN (ed.) (1990) A database for a pedestrian and pedal cyclist model: theoretical considerations and empirical data. Final report for workpackage 6 of DRIVE project V1031: An intelligent traffic system for vulnerable road users. WP 303, Institute for Transport Studies, University of Leeds.
SHERBORNE, D.J. (ed.) (1990, in preparation)
TIGHT, M.R. AND CARSTEN, O.M.J. (1989) Problems for vulnerable road users in Great Britain, The Netherlands and Sweden. Final report for workpackage 2 of DRIVE project V1031: An intelligent traffic system for vulnerable road users. WP 291, Institute for Transport Studies, University of Leeds.
TIGHT, M.R., CARSTEN, O.M.J. AND SHERBORNE, D.J. (1989) Problems for vulnerable road users in Great Britain. Final report for workpackage 1 of DRIVE project V1031: An intelligent traffic system for vulnerable road users. WP 292, Institute for Transport Studies, University of Leeds.
APPENDIX
ID No.: B__ __ __ __
1.“Show me on the map where you started your journey.” Zone [ ]
2.“Did you walk all the way?” Yes [ ] 1 → Q3
No [ ] 2 → Q2a
2a. “Show me on the map where you started your pedestrian journey.” Zone [ ]
3. “Did your pedestrian journey begin at . . . ?” Home [ ] 1
Work [ ] 2
School [ ] 3
(End of) car trip [ ] 4
Bus stop [ ] 5
Railway station [ ] 6
Other [ ] 7
4. “Show me on the map where you are walking to.” Zone [ ]
5. “Is this?” Home [ ] 1
Work [ ] 2
School [ ] 3
(End of) car trip [ ] 4
Bus stop [ ] 5
Railway station [ ] 6
Other [ ] 7
6. “What is the main reason for this walk journey?” Go home [ ] 01
Go to work [ ] 02
Go to school [ ] 03
Go shopping/ to bank [ ] 04
Social visit [ ] 05
Visit an office [ ] 06
Visit restaurant/pub [ ] 07
Recreational visit [ ] 08
Nothing special [ ] 09
Other... [ ] 10
7. “What was the last thing you did? Was it . . . ?”
Go shopping/ to bank [ ] 1
Social visit [ ] 2
Visit an office [ ] 3
Visit restaurant/pub [ ] 4
Recreational visit [ ] 5
Nothing special [ ] 6 → Q8
Other... [ ] 7
8. “What is the next thing you are planning to do? Is it . . . ?”
Go home [ ] 01
Go to work [ ] 02
Go to school [ ] 03
Go shopping/ to bank [ ] 04
Social visit [ ] 05
Visit an office [ ] 06
Visit restaurant/pub [ ] 07
Recreational visit [ ] 08
Nothing special [ ] 09
Other... [ ] 10
8a. “Where is this?” Zone [ ]
9. “How often do you walk in this part of the city?”
“Is it every day?” Yes [ ] 1
No [ ] 2
“Is it more than once a week?” Yes [ ] 1
No [ ] 2
“Is it more than once a month?” Yes [ ] 1
No [ ] 2
MAP PART
10.“We would now like you to draw the route you walked on this map. You are now here (SHOW). Show me where entered the area. What route did you follow from then on? Try to be as specific as possible. It is important that we know exactly where you walked and where you crossed.”
Codes of the entry point, nodes and exit point in sequence (GO ACROSS THE PAGE):
_ _ _ _ _ _ _ _ _ _ _ _ _ _ _ _ _ _ _ _ _ _ _ _ _ _ _ _ _ _ _ _
_ _ _ _ _ _ _ _ _ _ _ _ _ _ _ _ _ _ _ _ _ _ _ _ _ _ _ _ _ _ _ _
_ _ _ _ _ _ _ _ _ _ _ _ _ _ _ _ _ _ _ _ _ _ _ _ _ _ _ _ _ _ _ _
_ _ _ _
11.“Did you cross the road at any traffic light or pelican crossing on this map?”
12. PEDESTRIAN CROSSING TRAFFIC LIGHT
Link Flashing (F) Wait for Wait until Traffic Wait until Code Red (R) green? traffic have a traffic
Green (G) (Y/N/U) stopped? red light? stopped?
Unknown (U) (Y/N/U) (Y/N/U) (Y/N/U)
1
2
3
4
5
6
7
8
9
10
13.“Did you think about another route to walk through this area (SHOW AREA)?”
Yes [ ] 1 → Q14
No [ ] 2 → Q16
14. “Could you please draw this route.”
Codes of the entry point, nodes and exit point in sequence (GO ACROSS THE PAGE):
_ _ _ _ _ _ _ _ _ _ _ _ _ _ _ _ _ _ _ _ _ _ _ _ _ _ _ _ _ _ _ _
_ _ _ _ _ _ _ _ _ _ _ _ _ _ _ _ _ _ _ _ _ _ _ _ _ _ _ _ _ _ _ _
_ _ _ _ _ _ _ _ _ _ _ _ _ _ _ _ _ _ _ _ _ _ _ _ _ _ _ _ _ _ _ _
15.“What was the most important reason for your choosing the route you walked instead of the other one?”
Time [ ] 01
Distance [ ] 02
Pleasantness [ ] 03
Slope [ ] 04
Attraction(s), e.g. shop [ ] 05
Quality of the surface [ ] 06
Crowdedness [ ] 07
Protection from the weather [ ] 08
Safety [ ] 09
Other... [ ] 10
Don't know [ ] 99
16.“May I ask your age?” _ _ years
If no, “Can you tell me which age group you belong to?”
12–19 [ ] 01
20–39 [ ] 02
40–59 [ ] 03
60–74 [ ] 04
75 and over [ ] 05
17. Gender (FROM OBSERVATION) Male [ ] 1
Female [ ] 2
18. Walked in company? (FROM OBSERVATION) Yes [ ] 1 No [ ] 2
DATE: _ _ (year) _ _ (month) _ _ (day)
TIME: _ _ (hour) _ _ (minutes)