promoting access to White Rose research papers
Universities of Leeds, Sheffield and York
http://eprints.whiterose.ac.uk/
This is an author produced version of a paper published in Journal of Computer-Aided Molecular Design.
White Rose Research Online URL for this paper: http://eprints.whiterose.ac.uk/3569/
Published paper
Raymond, J.W. and Willett, P. (2002) Maximum common subgraph isomorphism algorithms for the matching of chemical structures, Journal of Computer-Aided Molecular Design, Volume 16 (7), 521 - 533.
Maximum Common Subgraph Isomorphism
Algorithms For The Matching Of Chemical Structures
*
John W. Raymond ([email protected])
Pfizer Global Research and Development, Ann Arbor Laboratories, 2800 Plymouth Road, Ann Arbor, Michigan 48105, USA
Peter Willett ([email protected])
Krebs Institute for Biomolecular Research and Department of Information Studies, University of Sheffield, Western Bank, Sheffield S10 2TN, UK
KEYWORDS: Algorithm, graph matching, graph similarity, isomorphism algorithm, maximum common subgraph, maximum common substructure
ABSTRACT: The maximum common subgraph (MCS) problem has become increasingly important in those aspects of chemoinformatics that involve the matching of 2D or 3D chemical structures. This paper provides a classification and a review of the many MCS algorithms, both exact and approximate, that have been described in the literature, and makes recommendations regarding their applicability to typical chemoinformatics tasks.
INTRODUCTION
It is necessary in many applications to compare objects represented as graphs and to determine the degree and composition of the similarity between the objects. This is often accomplished
using graph matching, or isomorphism techniques. Graph matching can be formulated as a problem involving the maximum common subgraph (MCS) between the collection of graphs being considered. In the chemical literature, this is often referred to as the maximum common
*
substructure problem and denotes the largest substructure common to the collection of graphs under consideration. The graph-based similarity between the graphs representing molecules plays an important role in many aspects of chemistry and, increasingly, biology: examples include protein-ligand docking [1], database searching [2,3], the prediction of biological activity
[4], reaction site modeling [5-8], and the interpretation of molecular spectra [9,10].
A recent review detailing many of the established chemical and biological applications of the MCS approach has been published [3]. This paper is intended to complement that work by focusing primarily on the algorithmic aspects of the MCS problem. The MCS problem is of significant importance in many research fields outside of chemical information management such as computer vision and image recognition [11-17], and the associated literature is extensive. In the interest of brevity, we concentrate chiefly on those studies that have been directly applied to chemical information handling, but we also consider MCS-related work performed in other fields of study (such as mathematics, computer science, and pattern recognition) when it is believed to have direct implications for applications in chemoinformatics.
DEFINITIONS AND TERMINOLOGY
All graphs referred to in the following text are assumed to be simple, undirected graphs. For an introduction to graph related concepts and notation, the reader is referred to an introductory text on graph theory (see, e.g., [18]). In a 2D chemical structure, the vertices of a graph represent the atoms and the edges of a graph denote the bonds connecting each pair of covalently bonded atoms. A 3D chemical graph differs from a 2D chemical graph in the manner in which edges are identified, as vertices are defined as the constituent atoms in both cases: specifically, in a 3D chemical graph, the edges indicate the geometric distance between a pair of atoms (vertices). Since 2D chemical graphs are very sparse (i.e., the constituent vertices are of low degree), the
Two graphs are said to be isomorphic if there is a one-to-one correspondence between their vertices and an edge only exists between two vertices in one graph if an edge exists between the two corresponding vertices in the other graph. An induced subgraph is a set S of vertices of a graph G and those edges of G with both endpoints in S. A graph G12 is a common induced
subgraph of graphs G1 and G2 if G12 is isomorphic to induced subgraphs of G1 and G2. A
maximum common induced subgraph (MCIS) consists of a graph G12 with the largest number of vertices meeting the aforementioned property. Related to the MCIS is the maximum common edge subgraph (MCES). An MCES is a subgraph consisting of the largest number of edges common to both G1 and G2. In this treatment, the term MCS will be used to denote both the MCIS and MCES problems.
Figure 1(a) illustrates an MCIS between two graphs (highlighted in bold), and Figure 1(b) demonstrates an MCES between the same two graphs. It is clear from Figure 1(b) that the MCES between the two graphs is simply the common subgraph with the largest number of edges. The MCIS in Figure 1(a) is less intuitive. The MCIS consists of the common subgraph with the largest number of vertices under the constraint that every edge present in graph G1(G2) that is incident on a vertex contained in the MCIS must also have a corresponding edge in the other graph G2(G1). For instance, in the MCES, vertex 4 in graph G1 maps to vertex 3’ in graph
G2 because edges (3,4), (4,5), and (4,7) in G1 correspond to edges (2’,3’), (3’,4’), and (3’,7’) in
G2, respectively. In the MCIS, however, vertex 4 in G1 does not match to vertex 3’ in G2, because there is an edge, (2,4), incident on vertex 4 in G1 that does not have a corresponding edge incident on vertex 3’ in G2.
The MCS between two graphs can be classified further by distinguishing between the connected and disconnected case. A connected MCS is an MCS whereby each vertex is connected to every other vertex by at least one path in the graph (i.e., the MCS consists of a single subgraph). A disconnected MCS is comprised of two or more subgraph components. Figure 2(a) depicts the
MAXIMUM COMMON INDUCED SUBGRAPGHS AND MAXIMUM COMMON EDGE SUBGRAPHS
It can be argued that the MCES more adequately exemplifies the notion of chemical similarity between two chemical graphs than does the MCIS since it is the bonded interactions between atoms in a molecule that are most responsible for its perceived activity. This distinction is
discussed in detail by McGregor and Willett [5,19]. Since much of the published literature considers the MCIS, an algorithmic transform for translating between the two formulations is desirable. One such technique is based upon the pioneering work of Whitney [20], who proved that an edge isomorphism between two graphs, G1 and G2, induces a vertex isomorphism provided that a exchange does not occur. This can be described in an approachable fashion with the aid of the example depicted in Figure 3. Figure 3(a) shows two graphs G
Y
Δ
=K
1 3 and
G2=K1,3, respectively. It is evident by visual inspection that the two graphs in Figure 3(a) are not isomorphic.
A line graphL(G1) is a graph whose vertex set consists of the edge set of G1; therefore, if (vi, vj) is an edge in G1 it is also a vertex in L(G1) [21,22]. A pair of vertices in L(G1) are adjacent if the two corresponding edges in G1 are incident on each other. Figure 3(b) presents the line graphs of
G1 and G2, respectively, and it is clear by inspection that the line graphs are isomorphic, despite their root graphs being non-isomorphic. This is called a ΔY exchange. Whitney proved that provided that a ΔY exchange does not occur, an isomorphism between two line graphs L(G1) and L(G2) induces an edge isomorphism between the root graphs (G1 and G2) of the two line graphs. This indicates that the MCES between two graphs G1 and G2 can be calculated using a MCIS algorithm on the two corresponding line graphs L(G1) and L(G2), provided that a ΔY
exchange does not occur. This is not a significant concern for 2D chemical graphs, but the ΔY
exchange is of importance when considering 3D chemical graphs where the probability of this occurring is higher; fortunately, it is not difficult to account for such an exchange in an MCES algorithm.
implementation of the resulting theorem for application to the MCES problem. This line-graph induced isomorphism concept has served as the basis for the development of the MCES program TopSim [25,26] as well as the work of Koch [27] and Raymond et. al. [28]. Independently of that work, Chen and Yun [29] have also developed an algorithm based on these principles, but they were apparently unaware of the work of Whitney [20], Nicholson et al. [23], and Kvasnicka and Pospichal [24], and proceeded to re-derive some of these well known concepts. Raymond et. al.
[28] describe how to perform the transformation efficiently in an algorithmic context.
ALGORITHMS
The problem of determining an MCS between two or more graphs is one of the combinatorially intractable NP-complete problems [30,31] for which no algorithm of polynomial-time complexity is known for the general case. For a simple comparison between a pair of chemical graphs consisting of m and n atoms, respectively, the maximum number of possible atom-by-atom comparisons necessary to determine all common subgraphs consisting of k atoms is [32]
! ! ( )!( )!
m n
m−k n−k k!,
an astronomical number for non-trivial values of k, m and n.
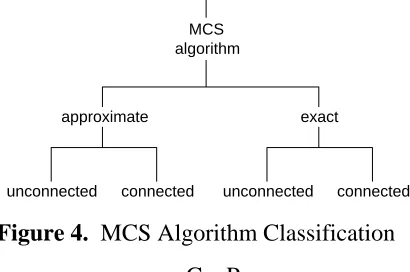
Due to this complexity problem and the inherent usefulness of the MCS problem, there have been many attempts to devise usable MCS algorithms. A natural classification criterion for these algorithms is whether the algorithm is intended as an approximation of the MCS or whether it results in the exact determination of the MCS for a specialized set of graphs or graphs of moderate size. As mentioned previously, these two classifications can be further divided into those algorithms which are restricted to the case of the connected MCS or are capable of calculating a potentially disconnected MCS (see Figure 4).
While this idealized framework provides a convenient organization with which to evaluate the literature, much of the published work does not fit easily into these well-defined categories, often due to a vague or ambiguous algorithmic description, and thus the classification presented here is
some algorithms have been proposed in a form that determines the set of maximal common subgraphs larger than some specified constant k. Since these algorithms can also be used to find the MCS without modification and since many algorithms designed to find the MCS can easily be adapted to find maximal common subgraphs larger than some constant k, all the algorithms will be treated as MCS algorithms. In addition, most of the algorithms can be tailored to detect an MCS in a collection of graphs, but for the sake of uniformity, we will treat each algorithm
from a pair-wise comparison perspective.
Since the vast majority of published algorithms that consider chemical applications have focused primarily on 2D chemical graphs, it will be assumed the graphs being compared are 2D graphs unless stated otherwise. However, many of the algorithms are sufficiently general to be used directly in the case of 3D graphs, and we discuss this further in the Recommendations section of the paper.
Exact Algorithms
The algorithms discussed here are all designed to enumerate an exact solution to the MCS problem. Since the MCS problem is NP-complete, all of these algorithms have a worse-case, exponential-time complexity or are restricted to a finite class of graphs. Despite these limitations, some of these algorithms have proven to be very efficient when applied to many of the graphs of chemical interest.
Maximum Clique-Based Algorithm The detection of the MCIS between two graphs, G1 and G2, can be reduced to one of determining the maximum clique in a compatibility graph. A clique in a graph G is a subset of vertices in the graph such that each pair of vertices in the subset is connected by an edge in the graph G. A maximum clique is the largest such subset present in the graph. The MCIS problem is reduced to the maximum clique problem, another NP-complete problem, by constructing a compatibility graph using the adjacency properties of the graphs being compared (i.e., the MCIS factor graphs). This compatibility graph has the property that an MCIS between the graphs being compared is equivalent to a maximum clique in the
Y
Δ
the publications to date and, using the previously described exchange test, it is a straightforward matter to transform the clique-based MCIS approach to an MCES method.
The modular product of two graphs G1 and G2 is defined on the vertex set with two vertices (u
1
( ) ( )
V G ×V G2
r ,v) and (u,v) being adjacent whenever
i i j j
1 2
1 2
( , ) ( ) and ( , ) ( ), o ( , ) ( ) and ( , ) ( ).
i j i j
i j i j
u u E G v v E G
u u E G v v E G
∈ ∈
∉ ∉
path graphs. In Figure 5, vertex (u
Figure 5 illustrates the modular product of two P3 1,v1) is adjacent to vertex (u2,v2) in the modular product graph since vertices u1 and u2 are adjacent in graph G1, and vertices v1 and v2 are adjacent in graph G2. Vertex (u1,v1) is also adjacent to vertex (u3,v3) since vertices u1 and u3 are not adjacent in graph G1, and vertices v1 and v3 are not adjacent in graph G2. However, vertex (u1,v1) is not adjacent to vertex (u3,v2) since vertices u1 and u3 are not adjacent in graph G1, whereas vertices v1 and v2 are adjacent in graph G2. It is also clear that vertex (u1,v1) is not adjacent to vertex (u1,v2) since a vertex cannot be incident on itself in a chemical graph.
The two maximum cliques with three vertices ((u1,v1), (u2,v2), (u3,v3) and (u1,v3), (u2,v2), (u3,v1)) in Figure 5 correspond to the two MCISs between graphs G1 and G2, which, in this case, also happen to be isomorphic mappings. In the case of labeled graphs like chemical graphs, the definition of the modular product is further restricted by requiring that the vertex and edge labels correspond according to some compatibility criteria (i.e., atom and bond typing).
Bessonov and Skorobogatov extended the notion of using clique detection for the MCIS problem
[33,45,46], providing what appears to be the first attempt at using information obtained from the MCIS factor graphs (i.e., the graphs being compared) to simplify clique detection. The previously published algorithms assume that the compatibility graph is an arbitrary graph and do not take advantage of the underlying nature of the problem construction. Bessonov and
Skorobogatov developed a set of algorithms capable of detecting the MCS in 2D graphical representations of molecules [33,45,47] based on the modular product concept. Bessonov later extended their modular product MCIS method to 3D graphical representations of molecules accounting for translation, rotation, and reflection [48]. The concept of using information from the factor graphs to significantly simplify clique detection in the modular product graph has recently been studied in detail by Raymond et al. [28], who have also described several techniques that can be used in the specific context of 2D chemical graphs [49].
The previously cited works regarding the maximum clique approach to the MCIS problem assume that the MCIS can be disconnected. It is also possible to employ techniques such that the maximum clique corresponds to a connected MCIS. Thus, Tonnelier et al. [6] introduced a technique for determining the connected MCIS, and Koch [27] has more recently presented a method for determining connected MCISs using a variant of the Bron-Kerbosch algorithm. Both these methods essentially just require that any vertex added to a common subgraph during clique detection must be connected to at least one other vertex in the currently detected common subgraph when projected onto each of the factor graphs being compared.
Backtracking Algorithms In addition to the clique-based methods, other exact algorithms have employed an iterative backtracking procedure. While these methods have been surpassed in subsequent years by the significant developments in the efficiency of clique detection, they did represent the state-of-the-art at the time of their development. The two notable methods in this category are the algorithms of McGregor [19] and of Wong [50], which are both capable of
effective subgraph isomorphism algorithm [51] that can be described as an improved version of the Ullmann algorithm [52], one of the most popular algorithms used in the graph-match stage of systems for chemical substructure searching [3,53].
Both the McGregor algorithm and the Wong algorithm attempt to reduce the number of backtrack instances necessary by inspecting the set of possible solutions remaining at some point in the
depth-first search and determining whether it is necessary to extend the current solution. The set of possible solutions is evaluated by enforcing a connectivity relation with the currently detected solution. These algorithms differ from more recent MCES algorithms [28,33] that perform a significantly more sophisticated inspection of the set of possible solutions, thus dramatically reducing the number of backtracking iterations that are required.
Dynamic Programming Another important, albeit more obscure, development for the MCES problem is the algorithm due to Akutsu [54], which is based on a mathematical programming technique called dynamic programming. This is a method for sequential, or multi-stage, decision problems which caches subproblem solutions rather than recomputing them. Akutsu’s algorithm is designed to calculate the connected MCES from a set of factor graphs. In addition to being relatively easy to code, an interesting aspect of the algorithm is that it is of polynomial time complexity for the class of graphs Akutsu defines as “almost trees of bounded degree”. Since almost all 2D chemical graphs can be classified as “almost trees of bounded degree”, this algorithm provides a potentially efficient method for determining the connected MCES from a set of 2D chemical graphs.
( ) ( )
E B ≤V B +K
An “almost tree of bounded degree” is a graph G such that holds for every
pairs of vertices in each of the biconnected components B2, B3, and B4, respectively, have a cycle in common, and B1 consists of a pair of vertices connected by an edge. After decomposing a graph into its constituent biconnected components, which can be done in linear time [55]
Akutsu’s algorithm then performs a series of efficient dynamic programming operations on the decomposed graph in order to detect the MCES.
Approximate Algorithms
This group of algorithms seeks to address the computational difficulties associated with the MCS problem by proposing approximate heuristics in order to estimate a solution within acceptable time complexity constraints. One limitation with these algorithms is that there is no performance guarantee that the approximated MCS will be close in size and composition to a true MCS. However, since most graphs of chemical interest are relatively simple, many of these methods have shown promise in their suggested applications.
Genetic Algorithm A genetic algorithm (GA) is one class of algorithms often used for maximizing (minimizing) a specified objective function. GAs are based on the notion of Darwinian survival of the fittest and operate by maintaining a population of candidate solutions while employing selection techniques (i.e., crossover and mutation) to generate a new population with a higher fitness value from the previous one. Wagener and Gasteiger [56] published a GA-based MCES algorithm for chemical graphs which used the following equation to establish the population fitness:
1 2
( 2
F = − −N V T +T − ),
where N is the total number of bonds in the two structures that participate in a bond matching, and V denotes how many bonds are involved in the situation where two adjacent bonds in one graph are assigned to two non-adjacent bonds in the other structure. T1 and T2 represent the
number of unconnected subgraphs in the two graphs, respectively. Thus, it is clear from the fitness function that the Wagener and Gasteiger algorithm calculates a disconnected, approximate MCES. Figure 7 demonstrates the calculation of the fitness function for cyclobutane and methylbutane with the bonds in a particular bond matching being highlighted in bold and listed in the accompanying table. The fitness for this situation is calculated as
. Since there are four bonds involved in the matching (two in each 4 4 (1 2 2) 1
graph), N=4, as does V since all four bonds violate the neighborhood relationship; T1=1 since the matching represents only one subgraph in graph G , and 1 T2=2 since there are two subgraphs in graph G2.
Wagener and Gasteiger then employ the two standard genetic operators, cross-over and mutation, as well as two additional custom operators, creep and crunch, to select bond matching
populations of increased fitness. Since a GA does not necessarily lead to a global optimum, the authors repeat the algorithm for each molecular graph comparison fifty separate times using different problem initializations. The simulations used approximately 400 generations with populations comprised of 100 individuals. To test the effectiveness of their algorithm in detecting the MCES between two molecular graphs, Wagener and Gasteiger compared morphine to methadone, strychnine to geissoschizine, and strychnine to 2-veratrylindole. The algorithm found the MCES in 48 out of 50 cases, 31 out of 50 cases, and 35 out of 50 cases, respectively.
Brown et al. [57] also published a detailed approach to the MCES problem for chemical graphs using a GA, as part of a program for generating chemical hyperstructures. The Brown et al. algorithm differed from the Wagener and Gasteiger approach in using a fitness function that considered only the number of edges preserved in the largest subgraph component in any given MCES matching, and did not consider the number of distinct connected subgraphs.
Wang and Zhou [58] used a similar objective function that considered the total number of edges preserved in a given MCES matching. This procedure used a GA for the global maximization of the fitness function and a simple depth-first search [59] for local searching of the fitness landscape. The local search heuristic is intended to reduce the search space that must be traversed by the GA; however, there is one apparent limitation with this approach. The local search procedure used in the overall algorithm, which is capable of finding a disconnected MCES, constructs each connected component in a disconnected MCES independently and maximally. This means that each connected component in the MCES is an independently
Frohlich et al. [60] have published a more recent application of a GA to the MCES problem. They investigated the use of the MCES in the optimization of configurations of field programmable gate array (FPGA) circuits in run-time reconfigurable systems. They used a parallel GA for determining the MCES in FPGA graphs and found time savings in certain instances using this technique.
Combinatorial Optimization In addition to the GA, other combinatorial optimization methods have been applied to the MCS-related problems. Funabiki and Kitamichi [61] have published an optimization procedure for the MCES that they call 2DOM (2-stage discrete optimization method) and that can be coded so as to identify the connected or possibly disconnected MCES. In this algorithm, the determination of the MCES is implemented in two stages: the initial problem construction stage consists of a simple greedy matching between the graphs being compared; and the subsequent refinement stage uses a randomized, discrete descent method to minimize an objective function consisting of the number of unmatched edges in the factor graph with the fewest edges. Funabiki compared the 2DOM algorithm head-to-head with simulated annealing [62] in 100-problem instances with the size of the factor graphs ranging from 100 to 1000 vertices. The 2DOM algorithm performed impressively, proving to be notably superior to simulated annealing in terms of both run-time and quality of solution.
In another combinatorial optimization method, Barakat and Dean [63] use simulated annealing to match 3D chemical graphs. The objective function here was
1
2 1 A
N i
AB ij
i j
E d
−
= =
=
∑∑
Δ ,AB A B
ij ij ij
d d d
Δ = −
where and and are elements of the distance matrix for graphs A and B, respectively. They tested their method on graphs of 25, 50, and 70 vertices, reporting the % correct assignments for various optimization parameter values for each graph size. In yet another approach, Schadler et. al [64] report using a neural-network optimization procedure for 2D chemical graphs.
A ij
d dijB
searching a database for compounds exhibiting similar MCES, given a specified query compound. The database to be searched is stored in the form of a multi-level tree where each bifurcation point in the tree corresponds to particular chemical substructure. Increasing a level in the tree to a lower bifurcation point, corresponds to adding a specific chemical substructure fragment to the substructure represented by the preceding bifurcation point.
Using this multi-leveled database structure, it is then possible to perform rapid similarity searching of pre-processed databases. Using the query compound as a template, the fragment tree is traversed until a bifurcation point is reached where it is not possible to continue. The substructure represented by this bifurcation point corresponds to an approximation of the MCES between the query compound and all of the database compounds located lower in the search tree. Since the number of possible substructure fragments increases exponentially with increasing database size and database systems possess only a limited amount of storage capabilities, it is clear that the effectiveness of this approach is highly dependent upon the structural characteristics and the size of the database being searched.
Ad Hoc Procedures This group of algorithms represents a diverse set of methods that have typically been designed specifically to fulfill an immediate need for a particular application without much regard to general or wide-scale usage requirements.
Varkony et al. [66] published an early graph walking procedure for determining connected MCESs. The procedure involves “growing” a currently detected subgraph by adding a vertex and all edges incident between the current subgraph and the newly selected vertex; a modified version of this algorithm was proposed subsequently by Takahashi et. al [67]. Hagadone [68]
describes a rapid MCES-based searching system used in conjunction with Upjohn’s COUSIN chemical structure database. This method is another simple graph walking procedure that is very rapid as it does not use backtracking to enumerate potential solutions; it identifies potentially disconnected sets of MCESs in a manner similar to that of the Wang algorithm [58].
and Johnson [44] add a post-processing step to the algorithm to allow some measure of disconnectedness in the MCES solution. This algorithm was experimentally studied by Brown
[70], who found that it frequently resulted in MCES approximations differing from the actual MCES; this led Brown to the implementation of the GA approach described in [57]. Chen [71]
proposes a novel set of polynomial-time approximation schemes for the MCIS problem in K3,3 -free and K5-free graphs. These schemes are primarily of theoretical interest, but may have some
potential for use in chemical structure applications as 2D chemical graphs can be considered K3,3-free and K5-free graphs. Chen and Robien [72] introduced an algorithm for use in NMR spectral studies that uses a straightforward backtracking scheme, with the efficiency being improved by incorporating a topological distance constraint between pairs of atoms in each of the graphs being compared.
As mentioned previously, the clique-based approach has been the most prevalent technique involving MCS-based chemical structure manipulation. Some authors have attempted to avoid much of the computational complexity involved in exact clique detection by using approximate heuristics to simplify the modular product and reduce the complexity of clique detection. Sheridan and Miller [73] simplify their MCIS formulation of the modular product by using a more restrictive definition of the modular product. In order for a pair of atoms in one query structure to be compatible with a pair of atoms in another query structure, the shortest path distance (i.e., fewest number of edges) between each pair of atoms must be the same. The shortest paths can be determined using an efficient polynomial time algorithm [74,75]. Having established an approximate modular product, they further simplify clique detection by using a non-enumerative clique detection procedure. While these heuristics greatly simplify the MCIS detection procedure, it is not difficult to envision chemical graphs for which this procedure results in arbitrarily poor estimates of the MCIS. This work is particularly interesting, though, because it is one of only a few published works [2,56] that have addressed the significance of MCS fragmentation on the notion of chemical similarity. Fragmentation is defined as the number of disconnected subgraph components present in an MCS. It is intuitive that an MCS
In related work, Jorgensen and Pedersen [76] use an MCES formulation of the modular product and, like the previous algorithm, use a shortest path definition for the connectivity requirement. They do, however, use an enumerative clique detection procedure [38], but it is still not difficult to find examples where this algorithm performs poorly with respect to the exact MCES due to the path length requirement.
3D-Specific Algorithms Most of the algorithms described in this paper have been presented from the perspective of arbitrary or 2D graphs, and much of the published literature on the 3D MCS problem simply adapts these algorithms to the 3D case [1,41-44,77]. The Barakat-Dean algorithm is an example of an algorithm that was originally proposed in a 3D formulation, and so is the algorithm described by Crandell and Smith [78], although even this owes much to the algorithm of Varkony et al. [66], in that it attempts to “grow” a 3D MCIS iteratively. The Crandell-Smith algorithm was studied in detail by Brint and Willett [42], who found that a clique-based method using the Bron-Kerbosch algorithm was generally to be preferred for the identification of the 3D MCIS.
An interesting algorithm is that of Masuda et. al. [79] This algorithm can determine the
connected MCES in a 3D graph in O l m l m( 1 12 2 2logn2) where m1= E G( 1) , n2=V G( 2),
2 ( )
m = E G2 , and l1(l2) is the maximum degree of a vertex in G1(G2), provided that no edge passes through any vertex other than its end points and no two edges intersect except at the shared endpoints. Although no experimental results are presented, this algorithm appears to offer a potentially useful approach when comparing 3D graphs based on geometrical coordinates.
PROBLEM REDUCTION
In the previous section, various algorithmic approaches to the MCS problem were discussed. Since the MCS problem is a computationally expensive procedure, some researchers have tried to address the problem by trying to simplify the graphs being compared rather than focusing on
application being considered. This has two potential advantages. First, if the modified graph contains fewer nodes and edges, it may significantly increase the efficiency of an MCS comparison using an established algorithm. The second potential benefit regards possible increases in the effectiveness of an MCS comparison. By modifying the graph so that each vertex and edge contains higher level information rather than simple atom and bond associations, a practitioner can introduce an established knowledge-base to the application, so that the
resulting MCS reflects a more desirable understanding of the similarity between the structures being compared.
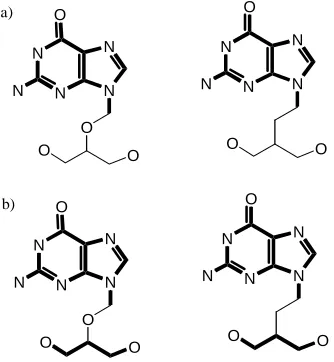
Takahashi et. al [80] present the example depicted in Figure 8 to illustrate this concept. Both compounds are antihistamines possessing the same biological activity. A straightforward implementation of the MCIS or MCES for the two compounds in Figure 8 will not adequately reflect the actual degree of chemical similarity between the two compounds. This is an important consideration as it reflects the sometimes subtle difference between graphical similarity and chemical similarity. It is clear from this example that a less rigid definition of vertex and edge weights may have important implications for the usefulness of a MCS algorithm in chemical applications.
Yuan and Zheng [81] introduced the concept of “superatoms” for MCS determination. In their definition a vertex in a graph corresponds to a superatom which can be one of a predefined number of ring systems, functional groups, or alkyl chains, and an edge exists in the graph if a pair of superatoms are adjacent in the molecular structure. In their experiments, the Levi [32]
MCIS algorithm as adapted by Cone et al. [10] was used. Takahashi et. al [80] introduced a similar system designated as a reduced-graph. The reduced graph concept differs from the superatom graph by a simple edge weighting procedure. In addition to introducing a higher level description of the graph vertices, the reduced graph weights each edge with the topological distance (i.e., the number of bonds) between superatoms in chemical graph, and these were compared using a Bron-Kerbosch algorithm. Similar ideas have been used to characterize the
Rarey and Dixon [83] have extended this idea and developed a more sophisticated concept that they call feature trees. In their method, a chemical graph, which may contain rings, is reduced to a tree graph (i.e., a graph without any rings or cycles). Having reduced a set of graphs to feature trees, similarity can then be established using a maximum common subtree algorithm. They propose two such algorithms, split-search and match-search. One of the most interesting aspects of the feature tree approach is their method for automatically determining superatoms (features)
based on biconnected components. This is a significant advance compared to earlier reduced graph methods that were based on an a priori knowledge of what constitutes an important feature.
The superatom concept is just as applicable to the 3D case as in the 2D case, with superatoms being used as pharmacophore patterns that can then be used in lieu of atom-defined graph vertices. This procedure not only simplifies MCS determination but also more intuitively describes the commonality associated with a collection of 3D chemical graphs, and has been studied in depth by several authors (see, e.g., [1,43,84]).
SCREENING PROCEDURES
It is obvious that the MCS problem is related to the problem of subgraph isomorphism (i.e., substructure searching) as subgraph isomorphism is a special case of the MCS and both belong to the class of NP-complete problems. It is well known that the efficiency of chemical substructure searching is improved drastically by screening procedures which are computationally less expensive than the rigorous graph matching procedures [53]. Screening methods for substructure searching are typically dependent upon the presence of pre-defined structural features in the structures being compared. However, these methods are not directly applicable to the MCS problem since it cannot be assumed a priori that a given substructural feature is present in the MCS even if it is present in all of the graphs being compared. Instead of developing different approaches to screening for the MCS problem, almost all published attempts at addressing the complexity problems associated with the MCS problem have focused
There have, nevertheless, been a few attempts to resolve the screening issue for the MCS problem. Since the standard substructural feature approach is not applicable, these techniques have instead taken a topological approach to screening. These methods all rely on the concept of a bound on the similarity of the compounds being compared. If a user specifies a lower-bound for a particular similarity comparison, then an effective upper-lower-bound estimate based on the MCS concept can provide a means of screening comparisons that cannot potentially result in
an MCS exceeding the specified lower-bound.
Hagadone [68] uses the asymmetric similarity coefficient given as Slb=Nc/Nq, where Nc is the
number of bond pairs in common between a query and database graph, and Nq is the number of edges in the query structure. If it is found prior to graph matching that after
specifying a minimum acceptable value of S
c lb
N <S ⋅Nq
lb, then it is not necessary to proceed to a rigorous
graph matching procedure. This upperbound calculation was an important component in the MCES-based searching component of the COUSIN system. A similar approach was described by Pepperrell et al. [85] in the context of comparing 3D graphs for a database searching application using their atom-mapping method (a heuristic 3D similarity measure). They described an upperbound calculation based on the molecular formulae of the molecules that are being compared and on the numbers of atom-atom interatomic distances common to the two molecules, with this proving an effective way of minimizing the numbers of full graph-based comparisons that needed to be carried out.
A more recent development for MCS-related screening has been proposed by Raymond et. al
[28]. Their screening procedure consists of two levels of screening, both of which are based on a similarity coefficient attributed to Johnson [86]
2 12
2
1
ub
G S
G G
=
× ,
1
G G2 are the number of vertices and edges in graphs G and G
where and 1 2, respectively, and
12
calculation based on an ordering of each graph’s degree sequence and involves only vertex label information. The second stage involves a more rigorous calculation based on a linear assignment of each augmented atom complex, thus accounting for bond pair typing as well as atom typing. Both screening stages have been described in detail [28], and test searches on a range of chemical datasets illustrate the very substantial increases in search efficiency that can be achieved in graph-based systems for chemical similarity searching [49].
Brint and Willett [87] propose yet another method for estimating Sub. This one differs from the other previously discussed in that it is not of polynomial-time complexity, although in practice it should be more efficient than a rigorous graph matching procedure. This method can be best thought of as an approximate MCIS algorithm with the useful property that the result will always be greater than or equal to the size of the actual MCIS. It consists of establishing a relaxed version of the modular product and then determining the size of the maximum clique present in it: this maximum clique corresponds to an upper-bound for the size of the actual MCIS.
CONCLUSIONS
In this paper, we have described many different MCS algorithms. In this section, we describe some common applications arising in the handling of chemical structure information and make some recommendations regarding the most appropriate algorithm(s) for each application.
Prior to the implementation of any rigorous graph matching procedure, it is beneficial to study the properties of the graphs being compared. It is often the case that the graphs can be simplified in some way to more adequately reflect the desired level of similarity and increase the efficiency of any given MCS algorithm. This can include topological considerations [49,72,73,76,80] or higher-level graphical representation such as reduced graphs [80,81,83] and pharmacophore maps
[43,84,88]. Additionally, for any large-scale application requiring the comparison of many graphs where it is not known a priori whether all graphs are sufficiently similar, a screening procedure should be implemented prior to graph matching. Of the published methods, the
the similarity determination is performed on the list of constituent augmented atoms (i.e., a center atom and all atoms bonded directly to it) rather than on the whole chemical graph.
One common application encountered in chemical information handling is the disconnected MCS problem for a set of 2D chemical graphs. Since exact algorithms have been developed which handle this problem easily, the need for an approximate algorithm has diminished
considerably. We believe that the most efficient published algorithm for this purpose is the RASCAL (for RApid Similarity CALculation) algorithm of Raymond et. al. [28], this claim being based on a detailed comparison of the efficiency of this clique-based algorithm with three other state-of-the-art clique detection algorithms [33,89,90]. RASCAL was found to be significantly faster in simulations involving ca. 20K inter-molecular comparisons, sometimes over six orders of magnitude faster; the algorithm was subsequently applied successfully to the calculation of ca. 128M inter-molecular comparisons [28,49] involving publicly available chemical structures. This algorithm can be operated in an MCIS or MCES formulation and can be modified to determine all maximal common subgraphs larger than some constant k rather than only the MCIS/MCES.
For the connected MCES problem, it appears that the Akutsu algorithm [54] may offer the best approach for 2D chemical graphs. This polynomial complexity algorithm can be easily coded using an established algorithm for the determination of biconnected components [55]. It also suggests the appealing prospect of offering a polynomial-time algorithm for the subgraph isomorphism problem in 2D chemical graphs, a potential improvement on the Ullmann algorithm
[52].
For the MCIS application regarding 3D graphs, the Akutsu algorithm is no longer applicable, and a suggested alternative is the Masuda algorithm [79]. Although the Masuda algorithm is of polynomial-time complexity, it is of relatively high order, and direct head-to-head experimental comparison with other procedures is necessary for a more definitive recommendation. The
Chemoinformatics often involve graph-based applications that do not directly concern the handling of chemical structures directly. One example is the comparison of clustering output from various clustering algorithms. In these cases, it is possible to have very large graphs, perhaps thousands of vertices, for which even the more efficient exact algorithms are infeasible. In these cases, it is necessary to implement an approximate method. Of the methods discussed in
this paper, the Funabiki-Kitamichi algorithm is recommended [61]. This algorithm performed well when compared with the simulated annealing approach on graphs of up to a thousand vertices and can be readily coded from the published account, as can the other algorithms recommended here.
In conclusion, we hope that this review has succeeded in its aim of organizing much of the literature on the MCS problem in the context of chemoinformatics applications. It is hoped that future published algorithms for these problems will include a clear description of the algorithm type as well as suggested applications. It would also be highly beneficial to the reader if such published accounts include experimental comparisons with established methods, involving non-trivial numbers of 2D and/or 3D chemical graphs.
Acknowledgements We thank the following: Pfizer (Ann Arbor) for funding; Alain Calvet, Eleanor Gardiner, Eric Gifford, Christine Humblet, and Sherry Marcy for helpful advice; and the Royal Society and the Wolfson Foundation for laboratory support. The Krebs Institute for Biomolecular Research is a designated centre of the Biotechnology and Biological Sciences Research Council.
REFERENCES
1. Kuhl, F., Crippen, G. and Friesen, D., J. Comput. Chem., 5 (1984) 24. 2. Raymond, J. and Willett, P., J. Comput.-Aided Mol. Des., 16 (2002) 59. 3. Willett, P., IMA Vol. Math. Its Appl., 108 (1999) 11.
6. Tonnelier, C., Jauffret, P., Hanser, T. and Kaufman, G., Tetrahedron Comput. Methodol., 3 (1990) 351.
7. Armitage, J. E., Crowe, J. E., Evans, P. N. and Lynch, M. F., J. Chem. Doc., 7 (1967) 209. 8. Arita, M., J. Jap. Soc. Artific. Intell., 15 (2000) 703.
9. Chen, L. and Robien, W., J. Chem. Inf. Comput. Sci., 34 (1994) 934.
10. Cone, M., Venkataraghavan, R. and McLafferty, F., J. Am. Chem. Soc., 99 (1977) 7668. 11. Horaud, R. and Skordas, T., IEEE Trans. Pattern Anal. Mach. Intell., 11 (1989) 1168.
12. Pelillo, M., Siddiqi, K. and Zucker, S. W., IEEE Trans. Pattern Anal. Mach. Intell., 21 (1999) 1105.
13. Shearer, K., Bunke, H. and Venkatesh, S., Video Indexing and Similarity Retrieval by Largest Common Subgraph Detection Using Decision Trees, No. IDIAP-RR 00-15, Dalle Molle Institute for Perceptual Artificial Intelligence, Martigny, Valais, Switzerland, 2000.
14. Bolles, R. and Cain, R., Int. J. Robotics Res., 1 (1982) 57.
15. Pla, F. and Marchant, J., Comput. Vision Image Understand., 66 (1997) 271. 16. Radig, B., Pattern Recogn., 17 (1984) 161.
17. Yang, B., Snyder, W. and Bilbro, G., Image and Vision Computing, 7 (1989) 135. 18. Diestel, R., Graph Theory, Springer-Verlag, New York, 2000.
19. McGregor, J., Software Pract. Exper., 12 (1982) 23. 20. Whitney, H., Amer. J. Math., 54 (1932) 150.
21. Beineke, L. W., J. Comb. Theory, 9 (1970) 129.
22. van Rooij, A. and Wilf, H., Acta Math. Hungar., 16 (1965) 263.
23. Nicholson, V., Tsai, C., Johnson, M. and Naim, M., In King, R. B. and Rouvray, D. H. (Eds.), Graph Theory and Topology in Chemistry, Elsevier, Athens, GA, 1987, pp. 226.
24. Kvasnicka, V. and Pospichal, J., Reports in Molecular Theory, 1 (1990) 99.
25. Durand, P., An Improved Program for Topological Similarity Analysis of Molecules,
Department of Mathematics and Computer Science, Kent State, Toledo, OH, 1996. 26. Durand, P., Pasari, R., Baker, J. and Tsai, C., Internet J. Chem., 2 (1999) 1. 27. Koch, I., Theor. Comput. Sci., 250 (2001) 1.
28. Raymond, J., Gardiner, E. and Willett, P., Comput. J., in the press.
30. Kann, V., On the Approximability of NP-Complete Optimization Problems, Department of Numerical Analysis and Computing Science, Royal Institute of Technology, Stockholm, Sweden, 1992.
31. Garey, M. R. and Johnson, D. S., Computers and Intractability, W. H. Freeman, San Francisco, CA, 1979.
32. Levi, G., Calcolo, 9 (1972) 341.
33. Bessonov, Y. E., Vychisl. Sistemy, (1985) 3.
34. Barrow, H. and Burstall, R., Inf. Proc. Lett., 4 (1976) 83.
35. Vizing, V. G., Third All-Union Conference on Problems of Theoretical Cybernetics, Novosibirsk, 1974, pp. 124.
36. Kozen, D., SIGACT News, 10 (1978) 50. 37. Grasselli, A., Calcolo, 3 (1966) 165.
38. Bron, C. and Kerbosch, J., Commun. ACM, 16 (1973) 575. 39. Ogawa, H., Pattern Recogn., 19 (1986) 35.
40. Koch, I. and Lengauer, T., Int. Conf. Intell. Syst. Mol. Biol., 5th, 1997, pp. 167. 41. Takahashi, Y., Maeda, S. and Sasaki, S., Anal. Chim. Acta, 200 (1987) 363. 42. Brint, A. T. and Willet, P., J. Chem. Inf. Comput. Sci., 27 (1987) 152. 43. Martin, Y., Bures, M., et al., J. Comput.-Aided Mol. Des., 7 (1993) 83. 44. Bayada, D. and Johnson, A. P., Underst. Chem. React., 14 (1995) 243. 45. Bessonov, Y. and Skorobogatov, V., Vychisl. Sistemy, (1982) 3. 46. Bessonov, Y. E., Vychisl. Sistemy, (1985) 23.
47. Skorobogatov, V. A., Applied Problems on Graphs and Networks, Akad. Nauk SSSR Sibirsk, Otdel., Vychisl. Tsentr, 1981, pp. 117.
48. Bessonov, Y. E., Vychisl. Sistemy, (1987) 43.
49. Raymond, J., Gardiner, E. and Willett, P., J. Chem. Inf. Comput. Sci., 42 (2002) 305.
50. Wong, A. and Akinniyi, F., Proc. Int. Conf. Systems, Man and Cybern., Bombay & New Delhi, India, 1983, pp. 197.
51. Akkiniyi, F., Wong, A. K. C. and Stacey, D. A., IEEE Transactions on Systems, Man and
Cybernetics, IEEE, 1986, pp. 740.
52. Ullmann, J. R., J. ACM, 23 (1976) 31.
54. Akutsu, T., IEICE Transactions on Fundamentals of Electronics, Communications and Computer Science, E76-A (1993) 1488.
55. Gabow, H. N., Inf. Proc. Lett., 74 (2000) 107.
56. Wagener, M. and Gasteiger, J., Angew. Chem. Int. Ed. Engl., 33 (1994) 1189.
57. Brown, R. D., Jones, G., Willett, P. and Glen, R., J. Chem. Inf. Comput. Sci., 34 (1994) 63.
58. Wang, T. and Zhou, J., J. Chem. Inf. Comput. Sci., 37 (1997) 828. 59. Xu, J., J. Chem. Inf. Comput. Sci., 36 (1996) 25.
60. Frohlich, H., Kosir, A. and Zajc, B., Inform. Sci., 133 (2001) 195.
61. Funabiki, N. and Kitamichi, J., IEICE Trans. Inf. & Syst., E82-D (1999) 1145. 62. Kirkpatric, S., Gelatt, C. D. and Vecchi, M. P., Science, 220 (1983) 671. 63. Barakat, M. T. and Dean, P. M., J. Comput.-Aided Mol. Des., 5 (1991) 107.
64. Schadler, I., Wysotzki, I., Komorowski, J. and Zytkow, J., In Principles of Data Mining and Knowledge Discovery, 1997, pp. 254.
65. Wipke, W. T. and Rogers, D., Tetrahedron Comput. Methodol., 2 (1989) 177. 66. Varkony, T., Shiloach, Y. and Smith, D., J. Chem. Inf. Comput. Sci., 19 (1979) 104. 67. Takahashi, Y., Satoh, Y. and Sasaki, S., Anal. Sci., 3 (1987) 23.
68. Hagadone, T. R., J. Chem. Inf. Comput. Sci., 32 (1992) 515.
69. Bayada, D. M., Simpson, R. W., Johnson, A. P. and Laurenco, C., J. Chem. Inf. Comput. Sci., 32 (1992) 680.
70. Brown, R. D., A Hyperstructure Model for Chemical Structure Handling, Department of Information Studies, University of Sheffield, Sheffield, UK, 1993.
71. Chen, Z. Z., Automata, Languages and Programming, Springer, 1996, pp. 268. 72. Chen, L. and Robien, W., J. Chem. Inf. Comput. Sci., 32 (1992) 501.
73. Sheridan, R. P. and Miller, M. D., J. Chem. Inf. Comput. Sci., 38 (1998) 915.
74. Gondran, M., Minoux, M. and Vajda, S., Graphs and Algorithms, John Wiley & Sons, 1984, pp. 41.
75. Syslo, M., Deo, N. and Kowalik, J., Discrete Optimization Algorithms, Prentice-Hall, 1983, pp. 227.
79. Masuda, S., Yoshioka, H. and Tanaka, E., Electronics and Communications in Japan. Part 3, 81 (1998) 48.
80. Takahashi, Y., Sukekawa, M. and Sasaki, S., J. Chem. Inf. Comput. Sci., 32 (1992) 639. 81. Yuan, S., Zheng, C., Zhao, X. and Zeng, F., Anal. Chim. Acta, 235 (1990) 239.
82. Gillet, V. J., Downs, G. M., Holliday, J.D., Lynch, M.F., Dethlefsen, W., J. Chem. Inf. Comput. Sci., 31 (1991) 260.
83. Rarey, M. and Dixon, J. S., J. Comput.-Aided Mol. Des., 12 (1998) 471. 84. Clark, D. E., Willett, P. and Kenny, P. W., J. Mol. Graphics, 10 (1992) 194.
85. Pepperrell, C. A., Taylor, R. and Willett, P., Tetrahedron Comput. Methodol., 3 (1992) 575. 86. Johnson, M., Naim, M., Nicholson, V. and Tsai, C., In King, R. B. and Rouvray, D. H. (Eds.), Graph Theory and Topology in Chemistry, Elsevier Science Publishers, 1987, pp. 219. 87. Brint, A. and Willett, P., J. Comput.-Aided Mol. Des., 2 (1989) 311.
88. Ting, A., McGuire, R., Johnson, P. and Green, S., J. Chem. Inf. Comput. Sci., 40 (2000) 347. 89. Wood, D., Oper. Res. Lett., 21 (1997) 211.
FIGURES a) 1 2 3 4 5 6 7 8 1' 2'
3' 4' 5'
6' 7' 8' b) 1 2 3 4 5 6 7 8 1' 2'
3' 4' 5'
6' 7' 8'
G1 G2
G1 G2
Figure 1. a) Maximum Common Induced Subgraph b) Maximum Common Edge Subgraph
[image:27.612.74.241.313.494.2]N N N N O O N O O N N N N N O O O a) N N N N O O N O O N N N N N O O O b)
Figure 2. a) Connected MCES b) Disconnected MCES
e1 e2 e3 e'1 e'2 e'3 G2=K1,3 G1=K3
a)
e1
e2
e3 b)
L(G1)
e'1
e'2
e'3
[image:27.612.74.270.545.682.2]L(G2)
MCS algorithm
approximate exact
[image:28.612.69.276.88.360.2]unconnected connected unconnected connected Figure 4. MCS Algorithm Classification
G1=P3
G2=P3
G1◊G2 u1
u2
u3
v1 v2 v3
Figure 5. Modular Product P P3◊ 3
B1
B2
B3
B4
Figure 6. Biconnected Components
1
2
3 4
1'
2'
3' 4' 1 1' 2 4' 3 ---4
[image:28.612.71.276.98.234.2]---G1 G2 G1 G2
Figure 7. Example Fitness Calculation for the Fitness Function in the Wagener-Gasteiger
[image:28.612.78.305.581.661.2]O
N S
N N
[image:29.612.71.279.88.181.2]N