0
Aspects of adiposity in
ponies
Thesis submitted in accordance with the
requirements of the University of Liverpool for
the degree of Doctor of Philosophy
by
Alexandra Helena Anne Dugdale
1
Abstract
Aspects of adiposity in ponies. Alexandra H.A. Dugdale
Obesity is a growing problem for humans and their horses and ponies, yet emaciated animals still form an important part of the work of equine welfare charities. Non-invasive yet reliable methods of assessing equine body fat are required in order to promote management procedures to improve animal welfare. The overall objective of this work was to investigate the application of a horse-specific body condition scoring system in ponies in order to either validate or revise it, or even replace it with a novel system if necessary.
Seasonal differences in appetite, body mass (BM) gain, body condition score (BCS) change and direct (ultrasound) and indirect (morphometry and D2O dilution)
measures of body fat were explored in two relatively homogeneous groups of mature Welsh mountain pony mares, studied over summer (June –September 2007) and winter (January-April 2008). The ponies in each group were paired so that, at study outset, two ponies were „thin‟ (BCS, 1-3/9); two were „moderate‟ (BCS, 4-6/9); and two were „obese‟ (BCS, 7-9/9). The greatest appetites (peak 4.6% BM as DMI), increases in body mass (~60kg) and in BCS (~3 points) were recorded for ponies of non-obese outset condition in summer (non-ObS, n=4). For ponies of non-obese outset condition in winter (non-ObW, n=3), appetites peaked at 3.5% BM as DMI, BM increased by a mean of 50kg and BCS increased by ~2 points over the 3 month study period. Appetites for all obese (Ob, n=4) ponies remained almost constant (~2% BM as DMI; peak 2.3% BM as DMI) and minimal changes in BM (n=3) and BCS (n=4) were recorded, regardless of season. All measures of body fat increased for non-Ob ponies (non-ObS>non-ObW). An exponential relationship was determined between body fat content and BCS and for values > 6, BCS was not a useful predictor of actual body fat content. The endogenous circannual mechanisms to encourage winter weight loss were insufficient to prevent the development of obesity in ad libitum fed ponies.
The effects of dietary restriction to 1% BM as DMI were studied in a group of 5 overweight or obese mature pony mares (BCS 5.6-8/9). Those measures outlined above were likewise recorded. All ponies remained healthy throughout the 12 week trial. Overall, BM reduced by 1% of outset BM per week. Approximately half the lost BM comprised fat, but fatter animals lost relatively more fat. Despite an average loss of ~30 kg BM, BCS did not change appreciably suggesting that BCS was a relatively poor indicator of early weight/fat loss in obese ponies.
The relationships between BCS, direct (ultrasonic) and indirect (morphometric and D2O dilution derived) measures of body fat and actual body fat content
determined by both physical dissection and chemical cadaver analysis were explored using 7 donated mature Welsh pony mares (BCS 1.25 to 7/9). Body „fat‟ content (dissected white adipose tissue or chemically-extracted lipid fractions) was the most variable constituent of the cadavers (up to 1/3rd body mass), and was non-linearly related to BCS. From these studies, it was also possible to validate the D2O dilution
technique for the measurement of total body water and fat in ponies.
Contemporaneously gathered data for BCS and body fat (D2O dilution) from
2
Acknowledgements
First and foremost, my grateful thanks go to World Horse Welfare for their substantial financial support of, and enthusiastic interest in, all the work presented in this thesis. Roly Owers, Andrew Higgins, Sam Chubbock, Chris Williamson, Tony Fleming and Tony Tyler formed the part of World Horse Welfare‟s team that we got to know well. Furthermore, I am indebted to the Biotechnology and Biological Sciences Research Council for the provision of my stipend through the Doctoral Training Award scheme, which enabled the greatest use of charitable funding for research purposes.
I would also like to thank Dr.s Caroline Argo and Patricia Harris, my main supervisors, for the concept and creation of the PhD programme and for their continued enthusiastic support and guidance throughout its development and fruition. Thanks also go to my other supervisors, Prof.s Derek Knottenbelt and Hilary Dobson, for their assistance and advice.
Many thanks are due to Gemma Curtis, my partner in crime, who helped me overcome, on numerous occasions, a flooded lab, flooded stables and unserviceable equipment to get the data gathered and analysed more or less on schedule. Keep smiling! Jean Wheeler and Helen Braid assisted in developing our numerous risk assessments and Jean Routly, Hilary Purcell and David Jones helped with FSIGTs and running insulin ELISAs. Jim Khambatta from Mercodia also requires a special thank you for conceding to my negotiation for doing us a great deal on the ELISA kit price! Roy Broadbank from Sartec was an enormous help in keeping the bomb calorimeter working and Peter Taylor and Sue Quinn were fantastic in teaching us how to use the biochemistry analyser and allowing us to run our hundreds of samples. They also helped us set up the NEFA assay, taught us how to stain for Heinz bodies in blood smears and helped us measure fructosamine for a student project. Thanks too go to Anja Kipar, Udo Hetzl and the histopathology team for helping us process, stain and image some of our samples. Ray Smith from Trouw Nutrition and Linda Turtle were instrumental in my learning the basics of proximate analysis. Nigel Jones and team were also a great support for various aspects of the work (laboratory space, land rover use, horse barn, paddocks etc.) – thank you all for your friendly welcome and help.
The team at the Rowett Institute in Aberdeen deserves an extra special mention. Eric Milne from the mass spectrometry group was truly inspiring. His patience and expertise in helping me with the deuterium analyses were second to none. Through Eric I also discovered David Brown and Christine Horrocks to whom I‟m extremely grateful for basically letting me take over their whole laboratory to analyse NDFs and nitrogens. Thanks are also due to Sue, Donna, all the Garys and the librarian who looked after me so well; not forgetting Louise Cantlay, Eric‟s new assistant, who has helped analyse all our latest samples.
3
Bryony Few. Val Turner‟s team were also amazing for helping with the initial processing. Dissection was facilitated by the awesome and artistic de-boning done by Geoff Partridge. Thank you Geoff - and you must remind me how you sharpen those blades! On the subject of which, W.R. Wright and Sons, Wholesale Butcher Supplies in Liverpool, played an important role in keeping us in sharp band saw blades.
So many avenues were explored en route to finding out about body and body-part mincing and the analysis of body-parts thereafter that there are many people to thank. Peter Molcher was our first contact but, via Eddie Clutton, Uncle Sam and Billy Steele, I found John Corbett at Nottingham, who postponed his retirement to teach us how to use the Wolfking mincer. After retirement, his place was taken by Mick Baker, who also brought the bone-grinder back into action. My many thanks go to Mick and his boss David Edwards, for enabling multiple visits to use their facilities (including their freezers). Thanks too to Claire‟s mum, Vanessa, for letting me stay overnight near to Sutton Bonington.
The story was similar as far as proximate analysis was concerned. My many thanks go to Marcus Mitchell from Nottingham and Andrew Mackie and Craig Thomas from Edinburgh who put up with my many questions about freeze-drying, oven-drying and the many different methods of lipid extraction. David Eden of the MLC put me in touch with Kim Matthews, who was a minefield of information, provided me with multiple documents and facilitated an extremely fruitful day sat in the library with a truly amazing librarian. I also thank Kim for putting me in touch with Fran Whittington, Mike Kitcherside and Kathy Hallet at Bristol, who constituted the team that finally processed all our pony samples. Mike delayed his retirement to help and Fran and Kathy gave up precious time from their own work to assist in completing the analyses before the laboratory was moth-balled. My very grateful thanks therefore go to all three for their expert tuition and expertise in getting a mammoth task completed. My thanks are also due to Prof. Jeff Wood for his enthusiastic interest in my work and for his help in finding various manuscripts.
Closer to home, my many thanks are due to Rachel James for her tuition in ultrasound imaging and for her valued friendship; and to my anaesthesia colleagues who enabled me to step off the rota for several months to complete the various experiments. I must also thank John Burford for the loan of his freeze-dryer (we still have it John!), and for his statistical insights. On the subject of statistics, Peter Cripps and Dai Grove-White deserve special thanks for their help with the data analyses and their enthusiasm for the subject. My very grateful thanks go to Patricia Jonker-Cholwe at Leahurst and the staff of the RCVS Trust library in London for their amazing abilities to find obscure references! Helen and Andy Tattersall, Colin Tibbey and Mick Wilde and all their pony breeder colleagues also deserve extra special thanks as, without them, we would still have been searching for ponies to recruit to the various trials and would not have had ponies made available to us for dissection. And finally, thanks also to David Holdridge from the MOD and the admin team at NED for their assistance with my enquiries.
4
Contents
Page number
Abstract
1Acknowledgements
2-3Contents
List of Tables
List of Figures
4-6 7-8 9-10
Chapter 1
1.1 1.2 1.3 1.4 1.5 1.6 1.7 1.8 1.9 1.10General Introduction
The British National Herd and Native ponies Obesity – an International Epidemic
Pathophysiology of obesity-related disease Origins of obesity: i) Regulation of food intake
Origins of obesity: ii) Quantifying energy requirements and intakes Origins of obesity: iii) Satiety and adiposity
Body composition assessment
Relevance to equine health and welfare Objective
Aims of the thesis
11-35 12 13 14 15 17 19 24 34 34 35
Chapter 2
2.1 2.2 2.3 2.4 2.5 2.6 2.7Effects of season and body condition on appetite, body
mass and body composition in ad libitum fed pony
mares
Summary Introduction
Materials and Methods Results Discussion Conclusion References 36-73 37 38 41 50 63 69 70
Chapter 3
3.1 3.2 3.3 3.4 3.5 3.6Effect of dietary restriction on body condition,
composition and welfare of overweight and obese pony
mares
Summary Introduction
5
3.7 References 108
Chapter 4
4.1 4.2 4.3 4.4 4.5 4.6 4.7 SI 1.1Assessment of body fat in the pony: I. Relationships
between the anatomical distribution of adipose tissue,
body composition and body condition
Summary Introduction
Materials and Methods Results
Discussion Conclusion References
Supplementary Information 1
Details of cadaver dissection, sample preparation and additional results of analyses
113-161 114 116 119 124 139 146 147 152-161 153-156
Chapter 5
5.1 5.2 5.3 5.4 5.5 5.6 5.7 SI 2.1 SI 2.1.1Assessment of body fat in the pony: II.
Validation of the deuterium oxide dilution technique
for the measurement of body fat
Summary Introduction
Materials and Methods Results
Discussion Conclusion References
Supplementary Information 2
Measurement of deuterium enrichment in plasma samples Expanded Materials and Methods
162-201 163 165 168 177 187 192 194 198-201 198 198-201
Chapter 6
6.1 6.2 6.3 6.4 6.5 6.6 6.7Can body condition scoring be used to determine body
fat in
Equidae
?
Summary Introduction
6
Annex 1
Novel Equine Fat Scoring System
229
229-231Chapter 7
7.1 7.2 7.3 7.3.1 7.3.2 7.3.3 7.3.4 7.4 7.5 7.6 7.7 7.8Concluding Discussion and Future Directions
Seasonality
Body composition and basic adipobiology: WAT content and distribution
Measurements of adiposity in vivo Body condition scoring
Morphometric and ultrasonographic measures of body fat Bioelectrical impedance analysis
Deuterium oxide dilution Pathophysiology of obesity Measurement of insulin resistance
Management of obesity (and insulin resistance) Conclusions
Future study interests
233-265 234 234 237 237 239 242 244 245 250 255 266 267
References
Pertaining to General Introduction and Concluding
Discussion & Future Directions
270-296
General Appendix
KoneLab 20i Biochemistry analytical methods Neutral detergent fibre determination
Published papers
297
298-300 301-302
7
List of Tables
Table Number
Title Page
number 1.1 Comparison of commonly used techniques for assessment of body
composition.
28-29
1.2 Summary of major equine body composition studies. 30-32
1.3 Summary of techniques used in companion amimal species for body composition assessment.
33
2.1 Specific anatomical locations for the ultrasonographic measurements of regional fat deposits.
45
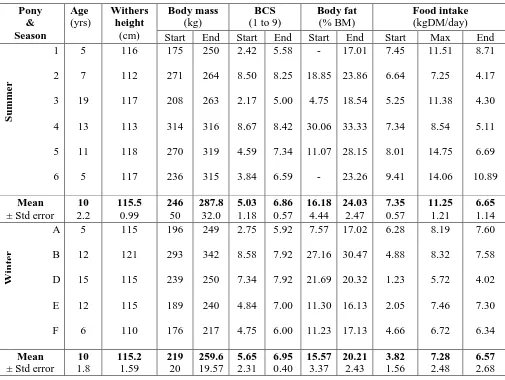
2.2 Summary data for phenotypic variables and appetite at the outset and end of the summer (n = 6) and winter (n = 5) 12-week studies in which ponies were offered ad libitum access to the study diet.
53
2.3 Circumferential morphometric and ultrasonographic fat depth measurements at the outset and end of the summer (n = 6) and winter (n = 5) 12-week studies in which ponies were offered ad libitum access to the study diet.
57
2.4 Summary of differences in rates of gains in circumferential and ultrasonogrpahic fat depth measurements for non-obese ponies in summer (n = 4) and winter (n = 3) trials in which ponies were offered ad libitum access to the study diet.
58
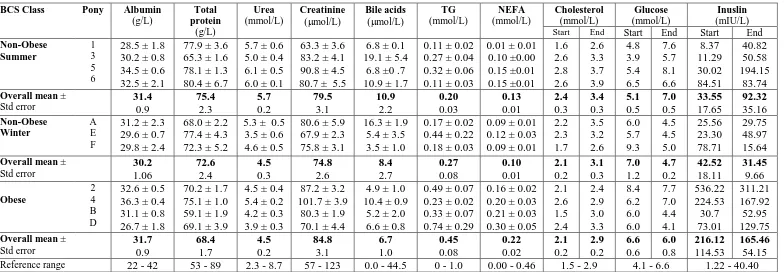
2.5 Summary of blood biochemical and insulin concentrations for individual ponies during the summer and winter 12-week trials in which ponies were offered ad libitum access to the study diet.
62
3.1 Specific anatomical locations for morphometric measurements. 82
3.2 Summary data for phenotypic variables of overweight and obese ponies (n = 5) at the outset and end of a 12-week trial of dietary restriction (1% BM as daily DMI).
89
3.3 Blood biochemical and insulin concentrations for overweight and obese ponies (n = 5) during a 12-week study of dietary restriction (1% BM as daily DMI).
94
4.1 Summary body composition and body condition score (BCS) data for the 7 mature pony mares donated for cadaver composition analysis.
125-126
4.2 Regional white adipose tissue (WAT) distribution for the 7 mature pony mares donated for cadaver composition analysis.
129
SI 1.1 Location of sites for collection of skin samples from pony cadavers. 155
SI 1.2 The mass of each white adipose tissue (WAT) depot for the 7 mature pony mares of differing body condition score (BCS) donated for cadaver composition analysis.
157
SI 1.3 Organ/tissue masses for the 7 pony mares of differing BCS donated for cadaver composition analysis.
8
SI 1.4 Results of proximate analyses for the eight major tissue categories derived from each of the 7 pony mares of differing BCS donated for cadaver composition analysis.
159
SI 1.5 Individual muscle, visceral and WAT depot water contents from a selection of sites from 6/7 pony mares of differing BCS donated for cadaver composition analyses.
160
SI 1.6 Gross energy contents of individual muscle, visceral and WAT depots samples from a selection of sites from 6/7 pony mare of differing BCS donated for cadaver composition analyses.
161
5.1 Summary descriptive data for body mass, total body water and body „fat‟ (measured by deuterium oxide dilution and proximate analysis) for 7 mature pony mares donated for cadaver composition analysis.
178
5.2 Regression equations to enable prediction of total body water or „fat‟ (dissectable WAT or chemically-extractable lipid) from deuterium oxide dilution-derived measures of total body water and total body fat mass.
182
6.1 Body condition scoring chart after Kohnke, 1992. 208
6.2 Descriptive data for age, body mass and withers height of 48 horses and ponies studied to enable assessment of the ability of Body Condition Score (BCS) to predict body fat content.
211
6.3 Breed and sex distribution of 48 horses and ponies studied to enable assessment of the ability of BCS to predict body fat content.
211
6.4 Results of linear regression modelling for the association between BCS and body fat percentage (measured by D2O dilution) for all
animals (n = 45) and when those animals were divided between non-obese (n = 21) and obese (n = 24) groups.
214
7.1 Location and function of the main mammalian facilitative glucose transporters.
248-249
9
List of Figures
Figure number
Title Page
number
1.1 The energy cascade. 16
1.2 Some factors responsible for the short-term regulation of food intake.
20
1.3 Overview of the satiety cascade. 22
2.1 Weekly body condition scores (BCS) and proportional increases in body mass and food intakes for pony mares of non-obese outset condition in summer (n = 4) and winter (n = 3) and obese condition in both seasons (n = 4), when allowed ad libitum access to the study diet for a 12-week period.
52
2.2 Regression of body fat percentage (measured by D2O dilution) on
body condition score (BCS) for pony mares studied in summer and winter when allowed ad libitum access to the study diet for a 12-week period.
55
2.3 Regression of digestible energy intake (DEI, MJ/kgBM/day) on the proportion of the day spent eating for ponies of thin or obese outset condition in summer (n = 4) and winter (n = 3), when allowed ad libitum access to the study diet for 12 weeks.
59
2.4 Regression of the rate of digestible energy intake (Joules/kgBM/minute) on BCS for ponies of thin or obese outset condition in summer (n = 4) and winter (n = 3), when allowed ad libitum access to the study diet for 12 weeks.
60
3.1 Mean changes in BCS and the proportions of outset body mass and umbilical belly girth for five overweight and obese pony mares during a 12-week study of dietary restriction (1% BM as daily DMI).
90
3.2 Mean changes in the proportions of outset rump width and rib-eye fat depth for five overweight and obese pony mares during a 12-week study of dietary restriction (1% BM as daily DMI).
92
3.3 Mean plasma glucose and insulin concentrations for overweight and obese pony mares (n = 5) at the outset, middle end of a 12-week trial of dietary restriction (1% BM as daily DMI).
95
3.4 Changes in mean proportions of the day spent in feeding, resting and other („play‟) activities (n = 3/5) over three time points during a12-week trial of dietary restriction (1% BM as daily DMI).
98
4.1 Regression of recovered skeletally-associated soft tissue mass and its white adipose tissue (WAT) content on body condition score (BCS) for 7 mature pony mares of varying BCS, donated for cadaver composition analysis.
10
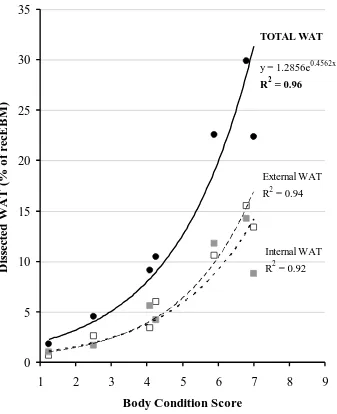
4.2 Total dissected WAT, and its internal and extrernal components, regressed on BCS for 7 mature pony mares of varying BCS, donated for cadaver composition analysis.
131
4.3 Marbling of fat between muscle fascicles of quadriceps femoris. 132
4.4 Histograms depicting the gross chemical empty (excluding gastrointestinal tract contents) body composition (determined by proximate analyses) for 7 mature pony mares of varying BCS, donated for cadaver composition analysis.
136
4.5 Total gross energy content of the recovered empty body mass (BM excluding contents of the gastrointestinal tract), regressed on BCS for the 7 mature pony mares of varying BCS, donated for cadaver composition analysis.
138
5.1 Inverse relationship of total body water (determined by proximate analysis) and body „fat‟ content (determined by dissection, proximate analysis or D2O dilution), for 7 mature pony mares of
varying BCS, donated for cadaver composition analysis.
179
5.2 Linear regression and Bland-Altman anlaysis of D2O
dilution-derived and proximate analysis-dilution-derived measures of total body water (TBW) for 7 mature pony mares of varying BCS, donated for cadaver composition analysis.
181
5.3 Linear regression and Bland-Altman analyses for all measures of body „fat‟ (D2O dilution-derived, chemical analysis and dissection)
for 7 mature pony mares of varying BCS, donated for cadaver composition analysis.
185
5.4 Linear regression and Bland-Altman analysis of dissected WAT and chemically-extracted lipid fractions for 7 mature pony mares of varying BCS, donated for cadaver composition analysis.
186
6.1 Scatterplot of standardised residuals versus predicted values from the final linear regression model describing the relationship between BCS and body fat content for 45 horses and ponies.
215
6.2 Quantile-quantile plot of standardised residuals versus expected inverse normal values from the final linear regression model describing the relationship between BCS and body fat content for 45 horses and ponies.
216
6.3 Scatterplot of standardised residuals versus actual BCS values from the final linear regression model describing the relationship between BCS and body fat content for 45 horses and ponies, demonstrating flaring of data points at BCS values greater than 7/9.
217
6.4 Scatterplot of standardised residuals versus predicted values from linear regression models based on non-obese (n = 21) and obese (n = 24) animals.
218
6.5 Quantile-quantile plot of standardised residuals versus the respective expected inverse normal values from linear regression models based on non-obese (n = 21) and obese (n = 24) animals.
219
6.6 Scatterplot of body fat % (D2O dilution-derived) versus BCS for 45
horses and ponies, demonstrating a non-linear relationship.
220
11
Chapter 1
12
1.1 The British National herd and Native ponies
The ancestors of modern horses and ponies inhabited highly seasonal environments. The origins of the horse extend back to the Eocene age, around 50-30 million years ago, after the Palaeocene which followed the massive extinction of the dinosaurs at the end of the Cretaceous period. In the Eocene age, animals like Hyracotherium (popular name: Eohippus), a fox-sized, forest-dwelling mammal and the later Mesohippus, flourished. The following Miocene (5-20 million years ago) and Pliocene (2.5-5 million years ago) ages saw the development of animals such as the Merychippus, Hipparion and the Pliohippus, which had three toes on each foot. Finally, the Pleistocene age (the last 2-2.5 million years) saw the development of what we refer to as the modern „horse‟, Equus caballus*.
In Britain, the National herd currently comprises more than 1.3 million horses and ponies (National Equine Database). Within the National herd the exact proportion of ponies is unknown but is considered in excess of 350,000 (NED Administration Team, December 2010). Several pony breeds are considered Native to Britain and, in particular, the Exmoor pony has been considered a close ancestor of the first truly wild horses present here (Speed and Etherington, 1952). Such Native ponies were considered to „show little or no signs of cross-breeding and selection by man, never be housed, fend for themselves and find all their own food‟ (Speed and Etherington, 1952). With domestication come the pit-falls of modern husbandry techniques and selective breeding which, according to Speed and Etherington (1951), will cause the demise of the domesticated animal. In the present crisis of growing obesity among the human and companion animal populations, it is interesting to ponder the place of modern management in the obesity epidemic in Equidae.
13
1.2 Obesity – an International epidemic
During the past two decades, public health concerns have increasingly been focused on the global epidemic of obesity plaguing particularly Western civilisations (Kopelman, 2000; Cummings and Schwartz, 2003). Obesity has been defined as the excessive accumulation of body fat which adversely affects health (NIH, 1985). However, not all fat depots are similar such that, at least for people, accumulation of upper body fat (subcutaneous and visceral) is more related to adverse metabolic consequences than lower body fat (Jensen, 2008). For humans, the consequences of obesity include features of the metabolic syndrome (cardiovascular disease, type 2 [insulin resistant] diabetes mellitus and renal disease), sleep apnoea/hypopnea and certain forms of cancer (DeFronzo and Ferrannini, 1991; Kopelman, 2000; Matthaei et al., 2000; Reisin and Alpert, 2005; Bastard et al., 2006).
14
1.3 Pathophysiology of obesity-related disease
The increased white adipose tissue mass present in obese states is not merely an inert energy store or thermal insulator but is an active tissue secreting many adipo-cytokines (adipokines), the profile of which, in obese states, is such as to promote the development of insulin resistance, endothelial dysfunction and an inflammatory state (Trayhurn and Wood, 2004; Kim et al., 2006; Vick et al., 2007; Geor and Frank, 2009, Radin et al., 2009). Hyperinsulinaemia was once heralded as a cardinal feature of insulin resistance (Draznin et al., 2000), which was itself first defined by Kahn (1978) as “(existing) whenever normal concentrations of hormone (insulin) produce a less than normal biological response”. Hyperinsulinaemia only persists, however, for as long as insulin resistance is accompanied by a compensatory response (increased insulin secretion +/- decreased insulin clearance) in order to normalise or near-normalise blood glucose concentration (Kruszynska and Olefsky, 1996; Erdmann et al., 2009; Toth et al., 2010). When decompensation occurs, insulin secretion is reduced and marked hyperglycaemia follows, leading to type 2 diabetes mellitus in humans and small animals (Mattheeuws et al., 1984; Nelson et al., 1990; Bergman et al., 2007). The equine pancreatic β cells are said to be less prone to exhaustion, so that
type 2 diabetes mellitus is rare in horses (Durham et al., 2008). Marked hyperinsulinaemia can develop in Equidae, the most severe consequence being endocrinopathic laminitis, a painful and debilitating inflammation of the digital lamellae which may ultimately require euthanasia (McGowan, 2008).
15
(Matthaei et al., 2000; Kim et al., 2006). From this model, the normal balance between insulin‟s effects to cause vasodilation (via nitric oxide (NO) as part of its metabolic functions) and vasoconstriction (via endothelins as part of its mitogenic functions) could be envisaged to favour vasoconstriction in insulin resistant states, this perhaps provoking equine laminitis (McGowan, 2008). However, the metabolic consequences of insulin resistance (in the liver, skeletal muscle and white adipose tissue) are also manifold, including relative hyperglycaemia and hypertriglyceridaemia with their own sequelae such as the production of advanced glyc(osyl)ation products (glucotoxicity) and advanced lip(oxid)ation end-products (lipotoxicity) which promote lipid peroxidation and cellular/mitochondrial dysfunction (Saltiel and Kahn, 2001; Unger and Zhou, 2001; Januszewski et al., 2003; Boden and Laakso, 2004; Civitarese and Ravussin, 2008). In addition to obesity, other factors including physiological state (e.g. pregnancy), dietary composition and physical exercise affect insulin sensitivity (Freestone et al., 1992; Storlien et al., 2000; Tomas et al., 2002; Hoffman et al., 2003; Kronfeld et al., 2005a and b). Emaciation (lipoatrophy) and lipodystophy are also associated with insulin resistance, supporting an important role of adipose tissue itself (via the spectrum of adipokines it produces) in the regulation of insulin sensitivity (Saltiel and Kahn, 2001; Heilbronn et al., 2004; Kronfeld et al., 2005a).
1.4 Origins of obesity: i) Regulation of food intake
16
Cummings and Schwartz, 2003; Cripps et al., 2005; German, 2006; Gesta et al., 2006; Sillence et al., 2006; Speakman, 2006; Turnbaugh et al., 2006; DiBaise et al., 2008; Argo, 2009). Nevertheless, the final common pathway to obesity remains an excess of energy intake over energy requirement (Lowell and Spiegelman, 2003). The gross energy (GE) consumed in food is partitioned between the animal that consumes it and the various sources of energy loss as depicted for the horse in Figure 1.1.
Intake gross energy (GE in feed)
100%
Digestible energy (DE)
~50% of GE (for forage)
Metabolisable energy (ME)
~ 37-44% of GE
Net energy (NE)
% not known for horses
Figure 1.1: The energy cascade (after Kienzle and Zeyner, 2010). For Equidae, gaseous losses and urinary energy losses are smaller than faecal losses (McDonald et al., 2002; Fuller et al., 2004; NRC, 2007).
Energy losses
Faecal energy (undigested food, etc.)
50% of GE
Gaseous energy (methane; very little hydrogen)
~2-3% of GE
Urinary energy ~4-10% of GE
Energy losses as the heat increment of feeding:-
Prehension and mastication of food
Digestion and absorption Waste formation/excretion
TOTAL HEAT PRODUCTION
(~40% of GE if at true maintenance)
Energy losses as heat during physiological maintenance
-Basal metabolism
-Bio-synthesis/degradation -Thermoregulation
-Voluntary activity
Retained energy (RE) used for production (chemical energy)
(0% if at true maintenance)
Energy balance may be positive or negative Tissue energy (growth or fat deposition)
Hair energy Lactation energy Conceptus energy
[image:17.595.57.561.255.698.2]17
1.5 Origins of obesity: ii) Quantifying energy requirements and intakes
The description of energy requirement for feeding purposes itself remains unresolved for animals (and man!), with no one system of energy evaluation being regarded as the „gold standard‟ between all countries (Hill, 2006). For example, the energy requirements of horses for maintenance, growth, reproduction, lactation and exercise are expressed in terms of digestible energy (DE) in the UK, some parts of Europe, USA and Australasia, whereas in France, a net energy (NE) system is preferred (NRC, 2007). The metabolisable energy (ME) system is currently being revisited for horses in Germany (Kienzle and Zeyner, 2010). For ruminants, ME systems tend to be preferred while NE, DE or ME systems are variously used for pigs and poultry (McDonald et al., 2002). While the NE system attempts to account for all sources of energy loss (for example, including the energy costs of feeding (prehension and mastication), digestion and absorption) and should therefore be more accurate, the system is more complex to use and the various sources of energy loss (and indeed, of energy „recovered‟) do not always constitute a constant proportion of the metabolisable energy (ME) in the feed (NRC, 2007). To add to the confusion, the units of energy adopted by different countries also vary, the USA favouring calories, whereas Joules are preferred in the UK and elsewhere (1 calorie = 4.2 Joules).
18
performed either with well-fitting face masks (Burke and Albert, 1978; Pagan and Hintz, 1986b; Mazan et al., 2003; Cruz et al., 2006) or, more usually, when the subject is confined within a metabolic chamber (Burke & Albert, 1978; Kane et al., 1979; NRC, 2007). The latter method requires correction factors to be applied for incomplete substrate oxidation, for example the production of methane (McDonald et al., 2002). Alternative methods for quantification of energy requirements which can be used for free-ranging animals, involve either heart-rate monitoring or the administration of doubly-labelled water (DLW) (Butler et al., 2004; Arnold et al., 2006). Heart rate methods depend upon the Fick principle (relationship between cardiac output [heart rate x stroke volume] and oxygen uptake [difference between arterial and venous blood]), and assume that the oxygen consumption per heart beat („oxygen pulse‟) is constant (or at least predictable), so enabling heart rate to be used to determine oxygen consumption (Butler et al., 2004). The DLW technique, also requiring correction for methane production, compares the rates of turnover of 18O and 2H in plasma water which can provide indications of oxygen consumption and carbon dioxide production (Butler et al., 2004; Fuller et al., 2004).
19
If energy demand remains difficult to quantify accurately, what of energy intake? Chemical analyses of feedstuffs can provide accurate information regarding their composition from gross energy, through amino acid profiles and right down to mineral and vitamin contents (Anon, 2002). Feed intake can be measured, although this is more difficult for animals grazing pasture (NRC, 2007; Smith et al., 2007; Ellis, 2010). Horses are trickle-feeders, spending 10-14hr/day grazing (Ellis, 2010). They naturally consume forage of high fibre content which undergoes extensive fermentation in the colon and caecum (McDonald et al., 2002; Lawrence and Lawrence, 2009). Feeding trials enable estimation of the apparent digestibility of various dietary components including its gross energy content, thereby facilitating calculation of the digestible energy intake (Fuller et al., 2001). In order to come full circle back to the consideration of energy requirements, extrapolation of digestible energy intake against average daily gain can then be used to estimate digestible energy requirements, for example, for maintenance (where ADG = 0 kg/day). Indirect calorimetry, however, offers more accurate estimations of energy requirements, despite the labour-intensive methodology (McDonald et al., 2002).
1.6 Origins of obesity: iii) Satiety and adiposity
20
Hyslop, 1996; Argo et al., 2002). Dulphy and colleagues (1997a & b) reported that the voluntary dry matter intakes of horses could not be predicted by the crude protein, crude fibre or neutral detergent fibre content of the feed. They also concluded that appetite was relatively poorly linked to season in horses compared to sheep, concluding that the organoleptic (sensory) characteristics of the food were more important short-term determinants of food intake in Equidae than sheep. Furthermore, since thorough chewing is a pre-requisite to small intestinal digestion and caeco-colic fermentation (McDonald et al., 2002), Ellis (2010) hypothesised that such factors as taste preference and a requirement for chewing could over-ride short-term biochemical/neurohormonal regulators of food intake. The environmental and animal factors influencing short-term food intake have been outlined in Figure 1.2.
Food/environmental factors
Availability (season; quantity; competition with other animals)
Quality
Variety
Palatability (depends on physico-chemical and organoleptic properties)
Availability of water (temperature/quality)
Climate (local weather conditions; nuisance flies)
Voluntary food intake (short-term)
Individual animal factors
Social status in herd hierarchy (may depend on breed, temperament, age, sex)
Physiological status (seasonal changes dependent upon photoperiod)
Health (e.g. dental disease)
Prior experience of that food (neophobia)
21
Physiological maintenance, growth and production require the support of sufficient energy and nutrient intake in both the short- and long-terms. Body mass, in particular body adiposity, is regulated in the long-term by a complex interplay of satiety/appetite signals and adiposity signals (Zigman and Elmquist, 2003; Redinger, 2008; Woods and D‟Alessio, 2008).
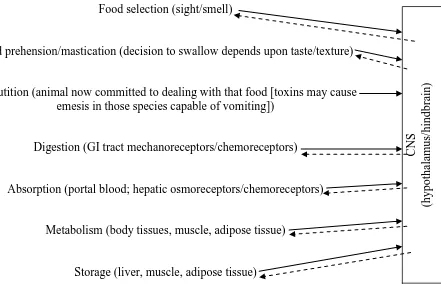
Short-term satiety signals tend to be phasically active during meals and include mechanical (stretch receptors) and chemical signals (peptides e.g. ghrelin, cholecystokinin and PYY) deriving from the gastrointestinal tract. These satiety signals relay information to the central nervous system (particularly the arcuate nucleus, paraventricular nucleus, perifornical area and lateral hypothalamus and the dorsal vagal area of the brainstem) but also have local effects within the gastrointestinal tract to alter its motility and digestive function (Schwartz et al., 2000; Cripps et al., 2005; Gossellin et al., 2007; Woods and D‟Alessio, 2008).
Longer term adiposity signals, including insulin and leptin, are more tonically active and are thought to provide the central nervous system with an ongoing message proportional to the total body fat (energy store). These adiposity signals are capable of changing the sensitivity of the brain to satiety signals (Schwartz et al., 2000; Woods and D‟Alessio, 2008). Indeed, food intake has been described in terms of a satiety cascade involving both feed-back and feed-forward controls, with the central nervous system as the overall co-ordinator of food intake (Forbes, 2007; Figure 1.3 below).
22
„master-clock‟ in its role as photoperiodically-entrained co-ordinator and regulator of circadian and seasonal physiological processes including metabolism (and food intake), sleep-wakefulness, hormone secretion (including those necessary for reproduction) and immune function (Van Cauter et al., 1997; Thiery et al., 2002; Henry, 2003; Murphy, 2010). These mechanisms may be of particular relevance to the long-term regulation of food intake in seasonal animals including Equidae (Arnold et al., 2006).
Food selection (sight/smell)
Food prehension/mastication (decision to swallow depends upon taste/texture)
Deglutition (animal now committed to dealing with that food [toxins may cause emesis in those species capable of vomiting])
Digestion (GI tract mechanoreceptors/chemoreceptors)
Absorption (portal blood; hepatic osmoreceptors/chemoreceptors)
Metabolism (body tissues, muscle, adipose tissue)
[image:23.595.132.573.290.579.2]Storage (liver, muscle, adipose tissue)
Figure 1.3: Overview of the satiety cascade (after Forbes, 2007).
For mature animals, the long-term maintenance of a more or less stable body weight appears to be the end-point of energy homeostasis and the ultimate controller of food intake (Zigman and Elmquist, 2003; Woods and D‟Alessio, 2008). In studies
C
NS
(hypo
thala
mus/
hindbra
23
of sheep, Vandermeerschen-Doize and colleagues (1982 & 1983) reported a polyphasic response to ad libitum food provision wherein it took 6 months for body mass to stabilise, with body fat stabilising at around 37% of live weight.
For mature native animals of temperate latitudes, a seasonal oscillation of body mass around a more or less constant value occurs alongside other photoperiodically-entrained physiological adaptations (Suttie et al., 1983; Mossberg and Jonsson, 1996; Argo et al., 1999; Fuller et al., 2001; Thiery et al., 2002; Arnold et al., 2006; Davies-Morel et al., 2006). Fuller and colleagues (2001) confirmed that seasonal changes in appetite were photoperiodically-entrained in Native ponies, as changes were induced under atrifical photoperiods. This seasonal effect has also been demonstrated for Przewalski horses studied in a semi-natural reserve, although mild winters and a relative abundance of good quality forage resulted in an overall increase in body weight over time in some animals with an attendant predisposition to laminitis (Budras et al., 2001; Scheibe and Striech, 2001).
24
Some fat depots have a protective/structural role (e.g. periorbital fat, peri-articular fat) and some have a more metabolically active/functional role (e.g. pericardial fat, bone marrow fat and fat surrounding lymph nodes), and these depots tend to be the last to be mobilised in chronic starvation states (Pond, 1998). Other depots may be considered to have more of a storage function (e.g. retroperitoneal fat, subcutaneous fat) (Pond, 1998). That white adipose tissue from different depots can have different characteristics and be differentially involved in metabolic disease has been recognised for some time in man and remains an important focus for research in all species (Jensen, 2008; Burns et al., 2010).
Body composition changes as an animal matures (Moulton, 1923; Callow 1948; Reid et al., 1955; Lohman, 1971; Taylor et al., 1989). Lean tissues such as bone and muscle are laid down preferentially as the animal grows, but white adipose tissue is the preferred form of chemical energy store once an animal has reached sexual maturity if energy intake exceeds demand, with repercussions for the meat industry (Reid et al., 1955; Warriss, 2000; McDonald et al., 2002; Sillence, 2004).
1.7 Body composition assessment
25
with the increasing prevalence of obesity in both man and domestic animals, methods of assessing body fat content which are non-invasive, easy to apply in a clinical situation, reliable and cheap should promote animal welfare (German et al., 2006).
Body composition can be described in terms of the relative amounts of the various biological or chemical components of the body. Traditionally, a two component model has been used, whereby the body is divided into fat and fat-free (lean) components and various assumptions are made regarding the nature of these two components (Wang et al., 1992; Shen et al., 2005). While the 2-component model remains useful for most animal studies, in which lean mass is said to be related to the patient‟s overall health (representative of overall protein nutrition), and the fat mass represents its energy reserves, each body can be divided into several components and body composition can be studied over 5 levels (atomic, molecular, cellular, tissue-system, whole-body) (Owens et al., 1993; Wang et al., 1992; Shen et al., 2005; Schroder and Staufenbiel, 2006). No matter what method of assessment is used, however, body fat remains the most variable component of the body and the body‟s water and fat contents are inversely related (Siri, 1956; Lohman, 1971).
26
which it is applied, no such similar measure currently exists for any animal species, although the subjective technique of body condition scoring (BCS) or various morphometric indices are often used as surrogate measures of the degree of fatness (Burkholder, 2000; Hayes and Shonkwiler, 2001). Although it is recognised that both emaciated and obese animals are less productive, quantification of the effects of varying body composition on health and productivity is necessary in order to define optimal body condition/s for different purposes (Jeffries, 1961; Andrew et al., 1994).
The various methods available for studying body composition have differing advantages and disadvantages (Table 1.1). Many of these techniques, however, are not readily applicable to domestic species, especially larger species, due to the size and non-compliant nature of these animals.
27
28
Table 1.1: Comparison of the most commonly used techniques for the assessment of body composition. (The number of plus signs provides a relative rating index for accuracy and precision).
Technique Accuracy Precision Advantages Disadvantages
Chemical analysis ++++ Unknown Accurate. Cost (time, reagents, equipment). Destructive.
Must define methodologies and how much of whole body is analysed.
Body weight ++ ++++ Non-invasive.
Easy to perform. Cheap.
Often portable scales. Fast.
No risk to patient. Can be used longitudinally to estimate changes in body composition in the individual.
Need calibrated weigh scales. No validated method to determine „ideal‟ body mass.
Unable to determine composition of weight changes.
Morphometry + + Non-invasive.
Easy to perform. Cheap. Fast.
No risk to patient.
Prone to operator error. Best related to body composition only in the study population.
Skinfold thickness + + Non-invasive.
Relatively easy to perform, but operator training preferable. Fast.
Cheap.
Portable callipers. No risk to patient.
Prone to operator error. Not all patients (esp. Animals) easy to measure.
Assumes s/c fat is representative of total body fat.
Best related to body fat only in the study population.
Body Condition Scoring
+ + Non-invasive.
Easy to perform. Cheap. Fast.
No risk to patient.
Best related to body composition in only the study population. Some scorer training helpful.
Ultrasonography ++ ++ Relatively
non-invasive. Operator training preferable. Relatively fast. No risk to patient. Equipment purchase and maintenance (medium costs). Portable equipment.
Requires relatively expensive equipment.
Prone to measurement error (poor probe positioning, intra- and inter-operater variation); possible poor repeatability if exact same sites not imaged.
Normally only superficial fat deposits can be imaged, therefore hard to infer about visceral fat. Best related to body fat only in the study population.
Densitometry
-under water weighing
+++ +++/+ Unknown. Requires expensive equipment. Requires patient
co-operation/training. Can be lengthy procedure. Assumes density of various body components is constant. Requires correction for residual lung volume and flatus. Unsuitable in animals.
Densitometry -air displacement plethysmography
+++ +++/+ Easily accepted by human patients.
Requires expensive non-portable equipment.
Can be lengthy procedure. Assumes density of various body components is constant. Requires corrective assumptions. Unsuitable in animals.
Absorptiometry (photon or X-ray)
++ +++ Relatively
non-invasive. Becoming the gold standard for assessment of body
Requires expensive non-portable equipment.
Operators must be trained in use of equipment.
29
composition in small animal veterinary practice.
sedation/anaesthesia. Unsuitable in large animals. Can be lengthy procedure. Assumes constant hydration factor for lean tissue.
Total Body Water (indicator dilution)
++ (slightly better for
18O than 2H)
+++ Minimally invasive. Assumes indicator evenly distributed throughout all body water and inert.
Some indicators are radioactive. Can be expensive (indicator and analysis).
Time consuming (equilibrium must be attained).
When used to estimate body fat requires assumption of constant hydration factor for lean tissues and that triglyceride content of fat mass is anhydrous.
Corrections required for isotope exchange.
Usually unquantifiable corrections required for respiratory and urinary losses and effect of gut water. Unpredictable accuracy for estimation of total body water and body fat because validity untested in many species.
Extracellular water +/+ (depending upon
indicator)
++ Minimally invasive. Assumes indicator evenly distributed throughout only ECF. Some indicators are radioactive. Can be relatively expensive (indicator and analysis).
Measured alongside TBW in order to better estimate intracellular fluid and thence body fat, but assumes fat mass is anhydrous.
Total body potassium +++ +++/+ Non-invasive. Requires patient co-operation, so unsuitable for animals. Requires expensive equipment. Requires correction for body geometry and background interference.
Assumes only lean tissue contains K in estimation of body fat.
Bioelectical impedance analysis (BIA)
+ + Relatively
non-invasive.
Requires certain degree of patient co-operation (minimal movement). Relies on assumption of constant hydration of lean tissue & anhydrous triglyceride content of fat mass for derivation of fat content.
Predictions are specific to the population from which the equations/models were derived. Poor results if patients abnormally hydrated.
Poor ability to track changes in fat mass over time.
Paucity of validation studies.
Total body electrical conductivity (TOBEC)
+? +? Relatively
non-invasive.
Expensive equipment.
30
Table 1.2: Summary of major equine body composition studies. Details of breeds, ages and sexes of animals included in each trial are presented, where available. In addition, body mass (BM), body condition score (BCS) and other measurements recorded are summarised. The term „empty body‟ differs according to the study, see table for further details where available.
Author/s (year)
Breed Age Sex Number Live BM
(kg)
BCS Measurements % Fat
Bradley (1896)
? Mature? ? ? Mean 430 ? Visceral and CNS
weights compared to live weight
Not recorded
Robb et al. (1972)
Shetland 8mo-18yr g, m & s 11 81-259 ? Dissection for
determination of mass of liver, spleen, kidneys and empty GI tract and its contents.
Chemical analysis of empty body (all tissues accounted for except liver). Not
exsanguinated.
6.6-18.9% of empty BM (where empty BM = Live BM less contents of GI tract) (Fat determined by ether extraction) Westervelt
et al. (1976) Ponies Horses? Shetland ? ? ? ? ? ? 15 (8 ad
lib-fed; 7 limit-fed) 8 11 (6 control; 5 exercised) 95-150 336-559 ? ?mod to fat?
Ultrasound 3 sites s/c fat pre-mortem. Fat depth measured by calliper post-mortem
Chemical analysis of whole cadaver less gut contents. Method of slaughter and whether exsanguinated was not reported.
Chemical analysis of whole cadaver less gut contents. Method of
31
slaughter and whether exsanguinated was not reported.
9.0±0.8% of empty BM (exercised) Again, empty BM = Live BM less contents of GI tract Webb and Weaver (1979) Ponies T‟bred 2-10yr 1.5-14yr 4 g 7 m 1 s 1 g 3 m 1 s 12 5 163-376 326-511 8 lean/ poor 3 good 1 fat 4 emac -iated/ poor 1 good *Dissection; visceral weights compared with live weight Mean 5.1% of live weight (<1 - >11%)
Martin-Rosset et al. (1983)
Heavy breeds 12-30months 40 colts 35 fillies
75 483 (12mo)
to 735 (30mo)
? *Dissection Mean 9%
32 Conne-mara X Welsh Mt. Shetland ? ? ? 1 3 2 Kane et al.
(1987)
Horses? 1-26yr varied 6 281-474 good Ultrasound of
rump fat pre-mortem.
Chemical analysis of empty body (exsanguinated, eviscerated (incl. Fat), decapitated. Not recorded whether hide, head, tail and lower limbs included. 10-1-24.0% of empty BM (exact definition of empty BM uncertain) Martin-Rosset et al. (2008)
French Sports breeds
9.8±2.3yr varied 20 404.5-557.5 BCS 1
to 4.5 (1-5 INRA system) *Dissection; bomb calorimetry of „total‟ soft tissues (fat and muscle) 2.6-14.7% of empty BM (Empty BM= Live BM less contents of GI tract)
g = gelding; m = mare; s = stallion; T‟bred = Thoroughbred
33
Table 1.3: Overview/summary of techniques used in companion animal species for assessment of body composition.
Species Objective measure or Index Measure or Index correlated with:- Measure or Index suggested as predictor of:- Reference
Equine Body mass index (BMI) =
BM (kg)/Withers height (m)2
BCS Adiposity Donaldson et al. 2004
Suggested alternative BMI as (heart girth x length) /
withers height Or even heart girth / withers
height
Equine Heart girth/withers height BCS Adiposity Carter et al. (2009a)
Crest height Cresty neck score Regional adiposity “
Mid neck circumference / withers height
Cresty neck score Regional adiposity “
Mean neck circumference / withers height
Cresty neck score Regional adiposity “
Equine Ultrasonic rump fat thickness BCS Adiposity Henneke et al. 1983 (using
equations of Westervelt et
al. 1976)
Body mass / withers height Ultrasonic rump
fat thickness
Adiposity “
Heart girth / withers height Ultrasonic rump
fat thickness
Adiposity “
Equine Ultrasonic rump fat thickness Empty body fat
(chemical analysis)
Adiposity Westervelt et al. 1976
Other sites of subcutaneous fat were also assessed; just caudal to scapula and over
ribs
Equine Ultrasonic rump fat thickness Decapitated,
exsanguinated empty body fat
(chemical analysis)
Adiposity Kane et al. 1987
Equine Ultrasonic rump fat thickness Partial empty
body fat (no head, lower limbs, skin
or GI contents)
Adiposity Gee et al. 2003
Other sites of subcutaneous fat were also assessed
Feline Feline BMI =
1.5(ribcage circumference at 9th
rib – leg index (patella to calcaneus)) / 9
?? Adiposity Hawthorne and Butterwick
2000
Canine BMI = Body mass /
shoulder height x length (occiput to tailbase)
% fat by DEXA Adiposity Mawby et al. 2004
Other equations including limb length (hock to stifle) and pelvic circumference, some sex-specific
% fat by DEXA Adiposity “
Canine Pelvic circumference % fat by DEXA Adiposity Dobenecker 2008
Canine Ultrasonic lumbar subcutaneous
fat depth
Carcase fat content (ether
extraction)
Adiposity Wilkinson and McEwan
[image:34.595.69.544.143.724.2]34
1.8 Relevance to equine health and welfare
Anecdotally, ponies are often said to be more prone to obesity than horses. Whilst obesity is not the sole cause of insulin resistance, greater insulin resistance has been reported among ponies compared with horses, even regardless of their body condition (Jeffcott et al., 1986). This then begs the question of „cause or effect‟ between greater innate insulin resistance and a possible preponderance towards obesity in ponies. Ponies, especially those of Native breeds, retain a marked seasonality in body condition such that body weight (fat) is gained during spring/summer when food is abundant (which may be helped by greater innate insulin resistance), but is lost during the subsequent winter when forage availability becomes sparse (Fuller et al., 2001; Davies-Morel et al., 2006). It then becomes clear how modern husbandry techniques (year-round access to food (graze or conserved food) of good quality and often in excessive quantity, provision of shelter/housing, use of rugs, minimal work load), combined with global warming (increased winter availability of forage), can promote the summer fat gain, negate the winter fat loss and encourage the development of obesity, especially in ponies.
1.9 Objective
35
to improve welfare. To achieve this objective, it was necessary to begin with an investigation of the basic adipobiology in a genetically similar group of animals. Mares from a relatively homogeneous breed of local Native pony, the Welsh Mountain pony, were therefore chosen.
1.10 Aims of the thesis
To achieve this objective, several studies were designed to address specific aspects:-
Evaluation of the effect of season and body condition on appetite and fattening
in Native ponies.
Determination of precisely where and how much or how little fat can be
contained within the pony‟s body and how this relates to body condition scoring systems.
Evaluation of methods for measuring body fat content in living ponies.
Development of feeding and monitoring programmes for the management of
controlled weight loss in obese ponies.
Critique of current body condition scoring systems in the light of our own
findings and, if necessary, to facilitate the development of a novel pony-specific BCS system.
36
Chapter 2
Effects of season and body
condition on appetite,
body mass and body
composition in ad libitum
fed pony mares
During the writing of this thesis, this chapter has been published:
Dugdale, A.H.A., Curtis, G.C., Cripps, P.J., Harris, P.A., Argo, C.McG. (2010) Effects of season and body condition on appetite, body mass and body composition in ad libitum fed pony mares. The Veterinary Journal Doi: 10.1016/j.tvjl.2010.11.009
Preliminary data from this chapter were also presented as an abstract and a poster:
Dugdale, A.H.A., Curtis, G.C., Knottenbelt, D.C., Harris, P.A., Argo, C.McG. (2008) Changes in body condition and fat deposition in ponies offered an ad libitum chaff-based diet. Proceedings of 12th Congress of the European Society of Veterinary and Comparative Nutrition, Vienna, September 2008. P 39.
37
2.1 Summary
Changes in appetite, body mass (BM), body condition score (BCS), direct (ultrasonographic) and indirect (deuterium oxide dilution technique) measures of body fat were monitored in Welsh Mountain pony mares (n=11, 5-19 years of age) offered ad libitum access to a complete diet (Gross Energy 16.9 ±0.07 MJ/kg dry matter) for 12 weeks during summer (n = 6; 246 ±20 kg) and winter (n = 5; 219 ±21 kg). At the outset, each group comprised two thin (BCS 1-3/9), two moderate (BCS 4-6/9) and two obese (BCS 7-9/9) animals.
For ponies that were non-obese at the outset, BM was gained more rapidly (P=0.001) in summer (0.8 ±0.1 kg/day) than winter (0.6 ±0.0 kg/day). This was associated with a seasonal increase in dry matter intake (DMI) which became maximal (summer, 4.6 ±0.3% BM as DMI/day; winter, 3.5 ±0.1% BM as DMI/day) during the second month. The appetite of the obese ponies was half that reported for non-obese animals in the summer and BM remained constant irrespective of season.
38
2.2Introduction
Throughout their evolution, ponies native to temperate latitudes adapted to survive in marginal and intensely seasonal mountain and moorland habitats (Speed and Etherington, 1952). Until the last century, these ponies would have been worked within their environment of origin, with little provision of supplementary feedstuffs or shelter (Speed and Etherington, 1952). The past 100 years have seen a progressive increase in the number of these animals being kept under lowland „domestic‟ conditions. Translocation to such environments has altered nutritional provision from the seasonally variable supply of native grasses to year-round access to highly digestible forages and concentrates. This move has been associated with a dramatically increased incidence of obesity and related disease (Wyse et al., 2008; Argo, 2009).
39
mass of mature ponies oscillates seasonally around a long term constant or slowly increasing value (Dawson et al., 1945; Scheibe and Streich, 2003). By uncoupling the pony from its natural winter check on body mass gain, domestication may promote year-on-year increments in body mass (BM) leading to obesity and its deleterious effects including the inter-related pathophysiologies of insulin resistance and laminitis (Scheibe and Streich, 2003; Bastard et al., 2006; Geor, 2008). The attainment of obesity in the pony may be hastened by access to pastures comprising high-sugar grass cultivars, developed to meet the extreme metabolic needs of high yielding dairy cattle.
Body fat content is a key participant in the multifactorial regulation of appetite (Forbes, 2003; Woods and D‟Alessio, 2008). In humans, appetite is decreased in obese subjects (National Researh Council, 1990). Increased body condition scores (BCS) have also been associated with reduced food intakes in sheep and cattle (Bines et al., 1969; Tolkamp et al., 2006).
40
41
2.3 Materials and Methods
Animals and study design
All procedures were conducted in accordance with Home Office requirements and were approved by the University of Liverpool‟s Animal Welfare committee and the Faculty of Veterinary Science‟s Research Ethics committee.
Two groups of six Welsh Mountain pony mares (5-19yr) were obtained from local pastures (53oN) two weeks prior to the start of the study. One group was studied for 12 weeks during summer (Group S, June to September, n = 6, age 10 ±2 yr, outset body mass (BM) 246 ±20 kg; mean daily temperature 15.1oC [range 3.8-25.6oC]). The trial was repeated with a separate group of animals during the following winter (Group W, January to April, n = 6, 10 ±2 yr, outset BM 219 ±21 kg; mean daily temperature, 7.0oC [range -4.6 to 17.3oC]).
Body condition score (BCS) was determined subjectively by one observer using a 9-point scale from 1 (emaciated) to 9 (obese) as described by Kohnke (1992; modificiation of Henneke et al., 1983). At the outset of each study, the two seasonal groups contained two „thin‟ (BCS 1 to 3), two „moderate‟ (BCS 4 to 6) and two „obese‟ (BCS 7 to 9) animals. For unrelated reasons, one thin winter pony did not complete the trial and data were excluded from analyses.
42
handling and measurement protocols. Initial hay feeding was progressively substituted for increasing quantities of the study diet which was available ad libitum by the first day of each trial (Day 1). Water was freely available throughout.
Fluorescent strip lighting (220 lux at pony eye level) was controlled by automatic timers to mimic day length at either the summer (Group S, 16L:8D, lights on 06:00 h; lights off 22:00 h) or winter solstice (Group W, 8L:16D, lights on 08:00 h; lights off 16:00 h). Low intensity, red fluorescent lights facilitated animal handling by night. Where possible, ponies exercised freely in a graze-poor paddock for 30min daily.
Nutrition
43 Apparent digestibility
Apparent digestibilities of gross energy (GE), organic matter (OM), dry matter (DM), neutral detergent fibre (NDF), crude protein (CP) and ash in the study diet were determined by total faecal collection over 72h during the first and final weeks of each trial. Faeces were collected immediately after defecation and pooled for each individual in a waterproof sack. Total daily faecal output for each animal was weighed (±10g, Weigh-Tronix; Avery Weigh-Tronix, West Bromwich, West Midlands, UK), mixed thoroughly and a sample (~150g) stored (-20oC) pending analyses. Each day, fresh food samples (~100g) were similarly stored. Refused food from each animal was also weighed, sub-sampled (~100g), stored and subsequently analysed to account for differences in composition between offered and refused feeds.
Feed and faecal analyses
44
Body mass, body condition scoring and morphometrics
On weekdays (08:30 h to 09:30 h), the BM of each pony was recorded (±1 kg, Lightweight Intermediate weigh scales; HorseWeigh, Llandrindod Wells, UK). Weighbridge calibration was checked monthly against standard weights.
Ponies were body condition scored weekly (Kohnke, 1992) by a single observer blinded to previous records. Heart girth, umbilical belly girth and mid-neck circumference were measured each week (±0.5cm), with a plasticised measuring tape (We-Bo Animal Measure; Danish Agricultural Association, Copenhagen, Denmark). Measurements were conducted when ponies were relaxed and standing squarely and CVs associated with each procedure were determined using ten repeat measures collected on a single occasion in a single moderate BCS pony.
Ultrasonographic measurement of accessible fat depots
45
Table 2.1: Specific anatomical locations for each of the regional fat deposits evaluated. All measures of fat depth were recorded on the left side of the animal by transcutaneous ultrasonography (variable frequency, 5.5, 7 or 8MHz linear array probe). All measurements with the exception of axillary fat were made in the vertical
midline of the image. Coefficients of measurement variation are presented.
Measurement of total body water and estimation of body fat percentage
Deuterium oxide dilution (D2O, 99.8 atom percent excess; CK Gas Products,
Hook, Hampshire, UK), was used to measure total body water (TBW) pool size of each pony at the beginning and end of each 12 week study (Fuller et al., 2004). Fat free mass and therefore total body fat mass (TBFM), were subsequently determined by application of the inter-species lean tissue hydration factor, 0.732 (Pace and Rathbun, 1945).
Fat deposit Anatomical location CV
(%)
Tailhead Probe parallel with vertebral column, immediately lateral to dorsal spinous processes of the
sacral/coccygeal vertebrae at the tailhead, just cranial to the first tail hairs.
9.9
Rump Probe centred on line equidistant between point of hip (tuber coxae) and centre of tailhead (tail hair arc).
10.5
Rib-eye Probe centred 15cm lateral to dorsal midline in 12th intercostal space.
7.0 Withers Probe centred equidistant between dorsocaudal
angle of scapula and highest point of withers.
9.3 Axillary Lateral thoracic vein identified at point of
emergence between deep pectoral and latissimus dorsi muscles. With lateral thoracic vein in cross section, fat depth immediately adjacent to vein was measured.
19.1
Retroperitoneal Probe positioned parallel and immediately lateral to ventral midline, just caudal to xiphisternum.