o
o
o
o
o
[D)(Q)MA~N lCOlU19JlUItOl9J®
leve~
[D)(9lQ)(UJ9J9Jerr
Apollo Computer Inc. 330 Billerica Road Chelmsford, MA 01824
~®~®lreUi)C~
Copyright © 1987 Apollo Computer Inc. All rights reserved. Printed in U.S.A.
First Printing: Latest Revision:
April, 1982 January, 1987·
This document was produced using the Interleaf Workstation Publishing Software (WPS). Interleaf and WPS are trade-marks of Interleaf, Inc.
APOLLO and DOMAIN are registered trademarks of Apollo Computer Inc.
AEGIS, DGR, DOMAIN/BRIDGE, DOMAIN/DFL-100, DOMAIN/DQC-100, DOMAIN/Dialogue, DOMAINIIX, DOMAIN/La-ser-26, DOMAIN/PCI, DOMAIN/SNA, D3M. DPSS. OSEE. GMR. and GPR are trademarks of Apollo Computer Inc. Apollo Computer Inc. reserves the right to make changes In specifications and other Information contained in this publi-cation without prior notice, and the reader should In all cases consult Apollo Computer Inc. to determine whether any such changes have been made.
THE TERMS AND CONDITIONS GOVERNING THE SALE OF APOLLO COMPUTER INC. HARDWARE PRODUCTS AND THE LICENSING OF APOLLO COMPUTER INC. SOFTWARE CONSIST SOLELY OF THOSE SET FORTH IN THE WRIT-TEN CONTRACTS BETWEEN APOLLO COMPUTER INC. AND ITS CUSTOMERS. NO REPRESENTATION OR OTHER AFFIRMATION OF FACT CONTAINED IN THIS PUBLICATION, INCLUDING BUT NOT LIMITED TO STATEMENTS RE-GARDING CAPACITY , RESPONSE-TIME PERFORMANCE, SUITABILITY FOR USE OR PERFORMANCE OF PRODUCTS DESCRIBED HEREIN SHALL BE DEEMED TO BE A WARRANTY BY APOLLO COMPUTER INC. FOR ANY PURPOSE, OR GIVE RISE TO ANY LIABILITY BY APOLLO COMPUTER INC. WHATSOEVER.
IN NO EVENT SHALL APOLLO COMPUTER INC. BE LIABLE FOR ANY INCIDENTAL. INDIRECT, SPECIAL OR CONSE-QUENTIAL DAMAGES WHATSOEVER (INCLUDING BUT NOT LIMITED TO LOST PROFITS) ARISING OUT OF OR RELATING TO THIS PUBLICATION OR THE INFORMATION CONTAINED IN IT. EVEN IF APOLLO COMPUTER INC. HAS BEEN ADVISED, KNEW OR SHOULD HAVE KNOWN OF THE POSSIBILITY OF SUCH DAMAGES.
THE SOFTWARE PROGRAMS DESCRIBED IN THIS DOCUMENT ARE CONFIDENTIAL INFORMATION AND
C
'. I0,
o
o
o
Preface
This manual describes the language level debugger, DEBUG. We've organized this manual as follows:
Provides a brief overview and tutorial of DEBUG. Chapter 1
Chapter 2 Explains how to compile your source code so that it can be debugged, and how to invoke the debugger.
Details all DEBUG commands. Chapter 3
Chapter 4 Explains some language dependencies. For example, what should a C programmer know when using DEBUG?
Appendix A Appendix B Appendix C
Related Manuals
Supplies some helpful hints in Question and Answer format. Explains how to debug an installed library.
Describes how optimization affects debugging.
Use the following language manuals in conjunction with the debugger manual:
• DOMAIN Pascal Language Reference (000792) • DOMAIN FORTRAN Language Reference (000530) • DOMAIN C Language Reference (002093)
Problems, Questions, and Suggestions
\Ve appreciate comments from the people who use our system. In order to make it easy for you to com-municate with us, we provide the User Change Request (UCR) system for software-related comments, and the Reader's Response form for documentation comments. By using these formal channels you make it easy for us to respond to your comments.
You can get more information about how to submit a UCR by consulting the DOMAIN System Command Reference. Refer to the CRUCR (CREATE_USER_CHANGE_REQUEST) Shell command description. You can view the same description on-line by typing:
$ help crucr <RETURN>
For your documentation comments, we've included a Reader's Response form at the back of each
manu-al.
Documentation Conventions
Unless otherwise noted in the text, this manual uses the following symbolic conventions:
boldface must be used, but letters in lowercase boldface are optional. For in-stance, consider SIGnal. Since the word is boldfaced, it is mandatory. The
ar-rangement of uppercase and lowercase letters indicates that the word can be ab- I~
breviated to SIG. \
,_/
'nonboldface
italicized
output
color
(comments)
< >
CTRL/Z
Words that are neither boldfaced, nor italicized indicate a part of the expression that you must supply, but you do not supply it literally. For instance, consider pathname. You would not enter the word "pathname," you would enter a path-name instead.
Italicized words are optional arguments.
Typewriter font words in command examples represent literal system output.
Colored words indicate user input.
In examples, comments are italicized and enclosed in parentheses.
Angle brackets enclose the name of a key on the keyboard.
The notation CTRL/ followed by the name of a key indicates a control character sequence. You should hold down <CTRL> while pressing the key.
Horizontal ellipsis points indicate that the preceding item can be repeated one or more times.
Vertical ellipsis points mean that irrelevant parts of a figure or example have been omitted.
Summ~ry
of Technical Changes
We last revised this manual for SR9.0. Since then, we've reorganized the manual and made it look pret-tier. DEBUG software has changed in the following ways:
• -SRC is now on by default. The -NSRC option must be used to suppress source display.
• You no longer have to supply fully-qualified routine names or variable names (e.g., FOO\BAR\ WALDO) when the routine or variable is visible from the current environment.
• You can now refer to line numbers in other routines in the current source file without prefixing the routine name.
• DEBUG marks breakpoint locations in the source display with a "I".
• New options for the ENVIRONME!'\TT command allow you to walk up and down the call stack, and restore a previously defined user environment.
• A new SOURCE command allows you to directly specify the source file to be displayed. Please use this new SOURCE command instead of the old SDIR command.
• By using the new SOURCE command, you can display the source code of programs that were compiled with the -DB option.
• The DELETE -BREAKPOINT command accepts two new SUb-options: -VA for deleting a breakpoint at a specific address, and -HERE for deleting the current breakpoint.
• If a program stops in Apollo library code. DEBUG no longer automatically sets the user environ-ment to the last-called user routine. (The new -CALLER option of the ENVIRONMENT com-mand makes it easy to walk back manually.)
c
c
0
0
0
o
o
"
0
0
0
0
0
0
0
0
0
0
0
0
0
A new debugger variable named 'MAX_QUAL limits the number of qualifiers (which are enclos-ing routine-names) that prefix displayed routine and variable names.
DEBUG displays unprintable characters in ASCII data as '<Ax>' or '<xx>'. A new debugger vari-able named 'MAX_BAD_CHARS limits the number of such characters which are output in a string.
Character string literals in commands may be delimited with either single or double quotes. Single and double quotes are interchangeable (but must be used in matching pairs).
You can now set breakpoints on FORTRAN statement functions.
DEBUG now correctly accesses FORTRAN arrays that have variable dimensions.
By default, DEBUG displays C "char" variables (8-bit integers) in ASCII format and allows you to set them to character literals. You can set Pascal" char" variables to integer values.
You can subscript all C pointers. (Prior to SR9.5, you could not subscript struct fields and array elements.) The" all" subscript [.] is not valid in general because the size of the implied array is unknown. But it can be used with pointers to chars for which the usual null-terminated string con-vention applies.
You can now de-reference pointers to procedures and functions. The result is a character string containing the name of the routine.
The SHELL command now accepts a shell command string as an argument.
The -PROC command line option now accepts a process uid or a Unix pid as its argument.
The source code position arrow is now turned off while the target program is running.
You can now debug installed libraries, though some rather severe restrictions apply. A new -GLOB command line option lets you step into code in global address space.
A new SIGNAL command simulates a fault at the current point of execution.
Action lists for faults have been added. If you define a macro named 'FAULT_ACTION, DE-BUG executes it when the program faults. The debugger variable 'FAULT_STATUS contains the fault status code.
o There is a new -VERBOSE option for HELP.
o DEBUG can now distinguish between unsigned and signed integer variables.
o We've fixed many bugs.
c
C/
Contents
o
Chapter 1 Introduction to DEBUG
1.1 The Debugging Process . . . 1-2 1.2 A Short Debugging Tutorial . . . 1-2 1.2.1 Three Sample Debugging Sessions . . . 1-2
Chapter 2 Invoking DEBUG
2.1 Preparing Programs For DEBUG . . . 2-1 2.1.1 The -DB Compiler Option . . . 2-2 2.1.2 The -DBS and -DBA Compiler Options . . . 2-2
o
2.1.3 The -NDB Compiler Option . . . 2-2 2.2 Invoking DEBUG . . . 2-3 2.2.1 DEBUG Options . . . 2-4 2.2.2 The -NC Option . . . ' .. 2-4 2.2.3 The -PROC Option . . . ' . . . 2-5 -PROC Example . . . 2-5 Using ... PROC to Debug Child Processes Spawned by a Program . . . 2-7 Advantages of -PROC . . . 2-7 2.2.4 The -READ Option . . . 2-7 2.2.5 The -SET Option . . . 2-8o
2.2.6 Windowpane Options: -WPnn and -NWP . . . 2-8 2.2.7 Source Display Options: -SRC, -NSRC, -SRC_T, and -SRC_R . . . 2-10 2.2.8 The -SDIR Option . . . 2-11 2.2.9 The -GLOB Option .. '. '.' . . . 2-11 2.2.10 The -SMAP Option . . . 2-11Chapter 3 Using DEBUG
ENVIRONMENT . . . 3-26 EXAMINE . . . 3-29 EXIT . . . 3-32 Expressions . . . 3-33
Faults . . . 3-36
c
GO . . . 3-38HELP . . . 3-40 IF . . . 3-41 JUMP . . . 3-42 LIST . . . 3-43 MACRO . . . 3-45 Pointer Variables . . . 3-47 PRINT . . . 3-49 QUIT . . . 3-51 READ . . . 3-52 Routine-Name . . . 3-53 SDIR . . . 3-57 SET . . . 3-58 SHELL . . . 3-62 SIGNAL . . . 3-63 Source -Code Display . . . 3-64 SOURCE . . . 3-67 Statement-ID . . . 3-69 STCODE . . . 3-71 STEP . . . 3-72 TB . . . 3-75 VA . . . 3-76 Variables . . . 3-78
# . . . 3-80
c
Chapter 4 Language-Related Issues
Appendix A Helpful Debugger Hints
o
Appendix B Debugging Installed LibrariesB.l Controlling Program Flow . . . B-1 B.l.l The DEBUG Option -GLOB . . . B-1 B.2 Variables and Breakpoints ... " . . . B-2
Appendix C Debugging Optimized code
C.l -DBA . . . C-l C.2 -OPT 0 . . . C-2 C.3 -OPT 1 . . . C-2 C.3.1 Dead-Code Elimination . . . C-2 C.3.2 Assignment Merging . . . C-2 C.3.3 Common Subexpression Elimination . . . C-3 C.4 -OPT 2 . . . C-3 C.S -OPT 3 . . . C-3
o
C.S.l Putting Local Variables in Register . . . C-4 C.S.2 Eliminating Assignments to Dead Static Variables . . . C-4 C.S.3 Reordering Instructions . . . C-4 C.S.4 Removing Loop Invariant Statments . . . C-4 C.6 -OPT 4 .... ! • • • • • • • • • • • • • • • • • • • • • • • • • • • • • • • • • • • • • • • • • • • • • • • • • • • • • • • • • • • • • • • • C-4C.7 Summary and Advice . . . " . . . C-S
o
o
Illustrations
Figure Page
1-1 A DEBUG Session With a Simple FORTRAN Program ... 1-4 1-2 A DEBUG Session With a Simple C Program ... 1-5 1-3 A DEBUG Session With a Simple Pascal Program ... 1-6 2-1 Debugging Without the -PROC Switch ... 2-5 2-2 Debugging With The -PROC Switch ... 2-6 2-3 Default Window Panes ... 2-9 2-4 -WP70 Creates Nonequal Window Panes ... 2-9 2-5 -NWP Combines the DEBUG Commands Window Pane and the
Target Program I/O Window Pane ... 2-10 C-1 To Optimize or Not To Optimize ... C-1
Table 2-1 2-2 3-1 3-2 3-3 4-1
Tables
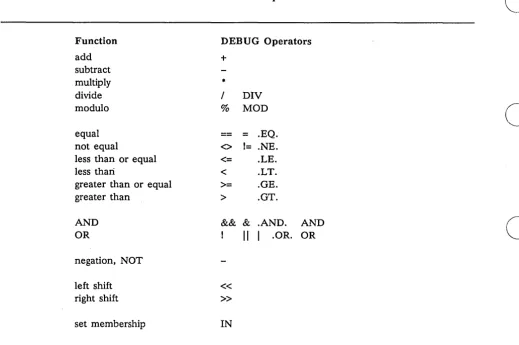
Page Compiler Options Affecting Debugging ... :... 2-1 DEBUG Command Line Options ... 2-4 DEBUG Operators ... 3-34 Legal DEBUG Data Types ... 3-47 Variable Cross Assignments ... ' ... 3-61 C Operators Not Supported by DEBUG ... 4-4
c
c
o
o
o
o
o
Chapter
1
The DOMAIN Language Level Debugger (DEBUG) is a high-level language debugger. You use it to debug FORTRAN, Pascal, and C programs running on the AEGIS or the DOMAINIIX operating systems. DEBUG supports the features found in most high-level language debuggers; that is, it lets you set breakpoints, jump through the program, and examine variables. But DEBUG also supports many other interesting features. Us-ing DEBUG, you can
• Control program flow
• Set breakpoints to suspend program execution at any statement. • Step the program one source statement at a time.
• Change the order of execution. • Intercept or simulate program faults.
• Examine program status
• Display, set, or change the value of a variable.
• Describe the data type and storage allocation of a variable.
• Trace the chain of calls that brought the program to its current state.
• Display program source code
• Display the source code of the program in a separate window, with an automatically updated indication of the current point of execution.
• Have full Display Manager access to the source file display for scrolling, text searching, etc.
• "Program" DEBUG
• Define action-lists of commands to be automatically executed at breakpoints or program faults.
• Define macros to abbreviate common sequences of commands.
1.1 The Debugging Process
The debugging process can be divided into the following three steps:
1. Compile the program so that DEBUG can use it. (For details, see Chapter 2.)
2. Invoke DEBUG. (Also see Chapter 2.)
3. Use DEBUG after you've invoked it. (For details, see Chapter 3.)
To accomplish step 1, compile with the -DB, -DBA, or -DBS option. For example:
$ ftn test.ftn -dba $ pas test.pas -dba $ cc test.c -dba
The simplest way to accomplish step 2 is to issue the command DEBUG followed by the name of the object
file you want to debug, for example: .
$ debug test. bin
Accomplishing step 3 is more complicated, so we provide the following short tutorial.
1 .2 A Short Debugging Tutorial
The goal of a debugging session is to eliminate the errors in your source code. The debugger is a tool that helps you find errors by allowing you to selectively examine a program's variables while the program is run-ning. Once you find the' errors, you must edit the source code and recompile it.
A feature of all debuggers is that they let you set breakpoints through the program. A breakpoint is an order to temporarily halt program execution at a particular line. For instance, if you set a breakpoint at line 20, the program will run normally until it reaches the statement at line 20, and then it will halt. In DEBUG, you set breakpoints with a command called, conveniently enough, BREAKPOINT. While halted at a breakpoint, you can examine the values of variables or perform any other debugger function. In DEBUG, you use the EXAMINE, PRINT, or ARGS command to display the value of variables. You can set an unlimited number of breakpoints in the program. Debuggers also support a command that resumes program execution from the breakpoint; in DEBUG, this command is called GO.
The STEP command is an alternative to the combination of BREAKPOINT and GO commands. You use the STEP command to execute the program one statement at a time.
So, there you have it in a nutshell. You use the debugger to flip from breakpoint to breakpoint in order to
c
discover where your program went wrong. Keep in mind that you cannot use DEBUG to change erroneous
C,. ,,'
source code. You can only use DEBUG to detect the location of erroneous source code. When you find the . error, you still have to go back and change your source code.1.2.1 Three Sample Debugging Sessions
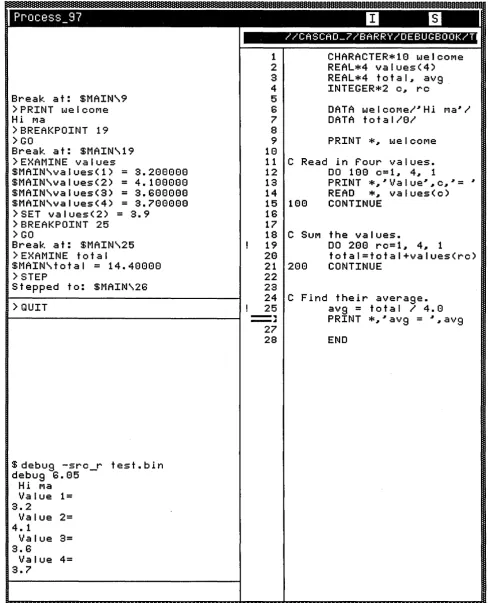
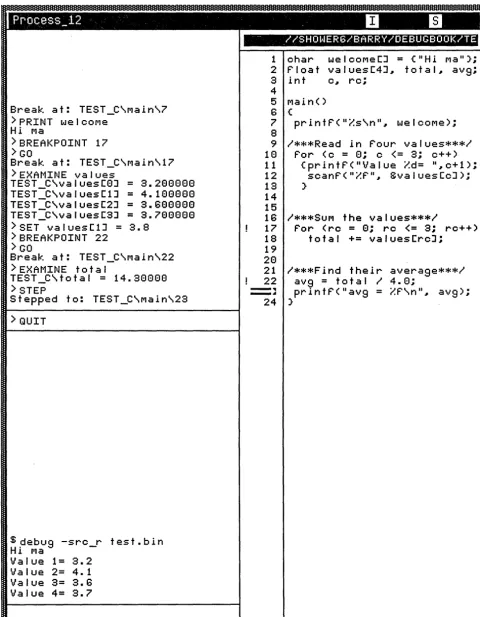
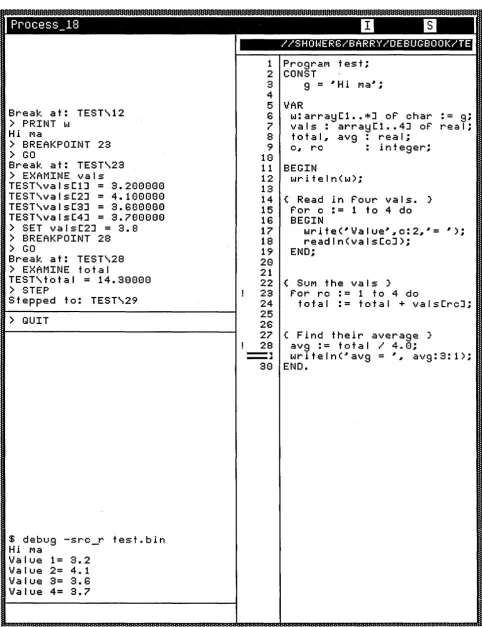
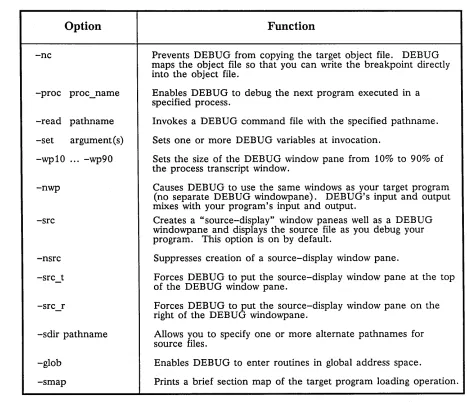
To help you get started, we provide Figures 1-1, 1-2, and 1-3, which show sample debugging sessions with FORTRAN, C, and Pascal programs. Notice how the d~bugging window in these figures is divided into the following three window panes:
• The right window pane is a listing of the source code that we are debugging.
• The bottom left window pane is a transcript pad showing all input and output of the running program.
• The top left window pane is where we enter all our DEBUG commands, and DEBUG displays debug-ger output.
Let's now examine the top left window pane in greater detail. Here's the order of the debugging commands:
PRINT Displays the value of the character array.
o
o
o
o
o
GO EXAMINE SET
BREAKPOINT GO
EXAMINE STEP QUIT
Advances the program from the start to the first breakpoint. Displays all four elements of the array.
Changes the value of the second element of the array. Sets a second breakpoint at the given line number.
Advances the program from the first breakpoint to the second. Displays the value of a simple variable.
Advances the program to the next statement. Ends the debugging session.
Break at: $MAIN\9 >PRINT welcoMe Hi Ma
> BREAKPOINT 19
>
GOBreak at: $MAIN\19 > EXAMINE va lues
$MAIN\valuesCl) = 3.288888 $MAIN\values(2) = 4.188888 $MAIN\values(3) = 3.688888 $MAIN\values(4) = 3.788888
>SET values(2) = 3.9 > BREAKPOINT 25
>
GOBreak at: $MAIN\25 > EXAMINE tota I
$MAIN\total = 14.40888 > STEP
Stepped to: $MAIN\26
> QUIT
$ debug -src_r test. bin debug 6.85
Hi Ma Value 1= 3.2
Value 2= 4. 1
Value 3= 3.6
Value 4= 3.7 1 2 3 4 5 6 7 8 9 18 IICASCAO_7/BARRY/OEBUGBOOK/T
CHARACTER*18 welcoMe REAL*4 values(4) REAL*4 total~ avg INTEGER*2 c~ rc
DATA welcoMe/~Hi Ma~1
DATA total/81
PRINT *~ welcoMe 11 C Read in Pour va lues. 12 DO 188 c=l~ 4~ 1
13 PRINT *~~Value~~c~~= ~
14 READ *~ valuesCc)
15 188 CONTINUE 16 17 18 19 28 21 22 23 24 25
-
...-
..
27 28C SUM the values.
208
DO 288 rc=1~ 4~ 1
total=total+valuesCrc) CONTINUE
C Find their average. avg = total I 4.0
PRINT *~~avg = ~~avg
[image:14.615.59.548.58.662.2]END
Figure 1-1. A DEBUG Session With a Simple FORTRAN Program
Introduction 1-4
,
(~
o
o
o
o
o
Break at: TEST_C\Main\7 >PRINT welCOMe
Hi Ma
> BREAKPOINT 17
>
GOBreak at: TEST_C\Main\17 >EXAMINE values
TEST C\valuesC8J = 3.288888 TEST-C\valuesC1J = 4.188888 TEST-C\valuesC2J = 3.688888 TEST:C\valuesC3J = 3.788888 >SET valuesC1J = 3.8
> BREAKPOINT 22
>
GOBreak at: TEST_C\Main\22 > EXAMINE tota I
TEST_C\total = 14.38888
>
STEPStepped to: TEST_C\Main\23
>
QUIT$ debug -src_r test. bin
Hi Ma
Value 1= 3.2 Value 2= 4.1 Value 3= 3.6 Value 4= 3.7
-" IISHOWER6/BARRY/DEBUGBOOK/TE
1 char welcoMeCJ = (IIHi Mall); 2 Ploat valuesC4J .. total .. avg; 3 int c .. rc;
4
5 Main() 6 (
7 printP( lIi:s\nll .. we I cOMe);
8
9 1***Read in Pour values***1 18 Por (c = 8; C (= 3; c++) 11 (printP( "Va I ue i:d= " .. c+1); 12 scanP( lIi:p lI .. 8:va I uesCcJ); 13 )
14
15
16 I***SUM t he va I ues***1
17 Por (rc = 8; rc <= 3; rc++) 18 total += valuesCrcJ;
19 28
21 1***Find their average***1 22 avg = tot a I I 4. 8;
[image:15.620.64.545.57.674.2]=~ printp(lIavg = i:P\n" .. avg); 24 )
Break at: TEST\12 ) PRINT w
Hi Ma
) BREAKPOINT 23 ) GO
Break at: TEST\23 ) EXAMINE vals
TEST\valsC1J = 3.288888 TEST\valsC2J = 4.188888 TEST\valsC3J = 3.688888 TEST\valsC4J = 3.788888 ) SET valsC2J = 3.8 ) BREAKPOINT 28 ) GO
Break at: TEST\28 ) EXAMINE total
TEST\total = 14.38888 ) STEP
Stepped to: TEST\29 ) QUIT
$ debug -src_r test.bin Hi Ma
Value 1= 3.2 Value 2= 4.1 Value 3= 3.6 Value 4= 3.7
IISHOWER6/BARRY/DEBUGBOOK/TE
1 PrograM t es t ; 2 CONST
3 g = ~ H i Ma~;
4 5 6 7 8 9 18 VAR
w:arrayCl •• *J of char vals: arrayC1 •• 4J of
total~ avg real;
c~ rc : integer; 11 BEGIN
12 wri te I n(w); 13 14 15 16 17 18 19 28 21
( Read in four vals. ) for c := 1 to 4 do BEGIN
write(~Value~~c:2~~=
readln(valsCcJ); END;
22 ( SUM t he va I s )
23 for rc : = 1 to 4 do
: = 9;
rea I;
24 total:= total + valsCrcJ;
25
26
27 ( Find their average ) 28 avg: = tot a I I 4.8;
[image:16.615.58.541.51.679.2]===~ writeln(~avg = ~~ avg:3:1>; 38 END.
Figure 1-3. A DEBUG Session With a Simple Pascal Program
c'
c
o
o
o
o
o
Chapter
2
This chapter explains how to prepare a program so that it can be debugged, and how to invoke the debug-ger.
2.1 Preparing Programs For DEBUG
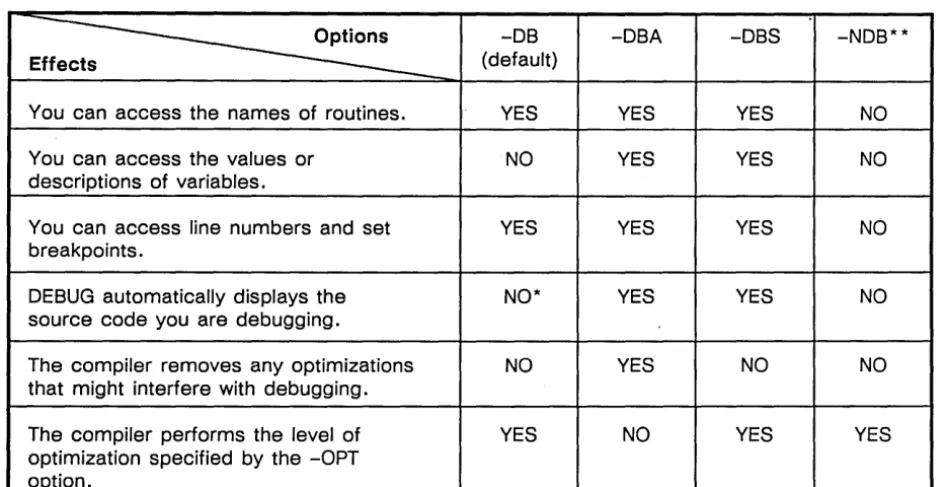
In order to use DEBUG to debug a program, you must first compile your source code with the correct com-piler option. Each comcom-piler (CC, PAS, and FTN) supports four command options that affect DEBUG's ac-cess to a program. Table 2-1 lists these options and summarizes the DEBUG acac-cess each option provides. A detailed description of each option follows the table.
Table 2-1. Compiler Options Affecting Debugging
~
-DBEffects (default)
You can access the names of routines. YES
You can access the values or NO descriptions of variables.
You can access line numbers and set YES breakpoints.
DEBUG automatically displays the NO'" source code you are debugging.
The compiler removes any optimizations NO that might interfere with debugging.
The compiler performs the level of YES optimization specified by the -OPT
option.
DEBUG only displays the source code that you request. '" '" You cannot debug a file compiled with -NOB.
-DBA
YES
YES
YES
YES
YES
NO
-DBS -NOB"''''
YES NO
YES NO
YES NO
YES NO
NO NO
[image:17.620.76.551.450.693.2]2.1.1 The -DB Compiler Option
When you compile a program with the -DB option (the default), the compiler performs its normal
optimiza-tions and creates a line number table, but it does not create a symbol table.
C'
The line number table permits you to set breakpoints or run a traceback. The line number table providesDEBUG with the names of the routines in the module, but does not provide information on the nesting structure. Therefore, if two routines have the same name, DEBUG cannot distinguish between them. Because it does not create a symbol table, the -DB option provides no access to variables, constants, and labels. Therefore, the -DB option is usually of little value when you intend to use DEBUG.
This option does permit source display debugging (described in the "Source Code Display" listing of Chap-ter 3); however, DEBUG will only display the source code that you explicitly request to see. (The -DBS and -DBA options provide DEBUG with enough information to automatically display the proper source code.)
2.1.2 The -DBS and -DBA Compiler Options
For most debugging, you will want to compile with either the -DBS or -DBA option. As Table 2-1 shows, ~
both options provide the exact same access to the debugger, the only difference is in how the compiler opti- I,
mizes the code.
\..,---If you specify -DBA, the compiler eliminates all optimizations that could interfere with debugging. If you specify -DBS, the compiler allows any optimizations. These optimizations could interfere with debugging since the source code may not correspond exactly to the object code. On the other hand, -DBS ensures that the code you debug is the same as production code compiled with -DB or -NDB thereby increasing your confidence in the correctness of the final program.
-DBA makes debugging easier by eliminating compiler optimizations that interfere with a direct correspon-dence between the source and object programs. Which is better? It is hard to generalize, but here are two helpful hints:
• The difficulty of debugging a program 'compiled with -DBS depends greatly on the program itself. You may wish to start with -DBS and switch to -DBA only if optimization-related programs are too great.
• Optimization sometimes exposes latent program bugs. Debugging a program compiled with -DBA should not ·replace thorough testing of the optimized program.
Appendix C details the ways in which optimization can affect debugging.
2.1.3 The -NOB Compiler Option
The -NDB option causes the compiler to create as compact an object module as possible. The resulting ob-ject module will have no line number table or symbol table. DEBUG has no access to programs compiled with -NDB. In fact, -NDB also interferes with the TB, HPC, and DPAT utilities. Therefore, we recom-mend that you not use -NDB unless it is absolutely essential to reduce the program's size. Note that the ex-tra DEBUG information added by -DB, -DBA, or -DBS does not affect the execution time of the program.
o
o
o
o
o
2.2 Invoking DEBUG
To invoke DEBUG, issue a command line that has one of the following two formats:
$ debug debug_options target_program target-program_arguments or
$ debug debug_options -proc process_name
Debug_options are one or more options described in the next section. The target_program is the object file that you want to debug. Target_program_arguments are any arguments you want to supply to the tar-get_program.
You must specify all debug_options before you specify the target program name. DEBUG only scans for options up to the target program name. For example, consider how the system interprets the following two different command lines:
$
debug
to
test.bin
at
DEBUG
sees this
Your program sees this
$
debug test. bin -src
t
Your program sees this
By default, when you invoke DEBUG (without specifying the -proc option), the following happens:
1. The system forks, creating a new process. DEBUG runs in the child process, which is named "DE-BUG" (or "DEBUG.1" or "DEBUG.2", etc.).
2. DEBUG loads the target program into the original (parent) process. During program loading, DE-BUG copies all read-only portions to read/write storage, so that you can set breakpoints.
3. DEBUG splits the window into three window panes -- one window pane displays the source code you are debugging, another window pane displays all DEBUG commands you make, and a third window pane holds all I/O of the program you are debugging.
4. DEBUG sets a breakpoint on the first executable statement in the target program.
5. DEBUG looks in your home directory for the pathname user_data/startup_debug. If
DEBUG finds this pathname, DEBUG processes the file's contents as a sequence of DEBUG commands. If DEBUG does not find this pathname, no error occurs. DEBUG then looks in your working directory for filename startup_debug. If DEBUG finds this filename, DEBUG processes the file's contents as a sequence of DEBUG commands. If DEBUG does not find this filename, no error occurs.
6. DEBUG starts execution of the target program. The target program runs until just before the first executable user statement, where DEBUG sets a breakpoint. At that point, DEBUG issues its prompt character (» and waits for a command.
NOTE: You cannot redirect or pipe the I/O of the target program. For example, the com-mand line
$ DEBUG foo.bin >foo.output
.
2.2.1 DEBUG Options
The DEBUG command line options allow you to customize the operation and appearance of your debugging session. Table 2-2 summarizes these options and gives a brief description of each option's function.
Table 2-2. DEBUG Command Line Options
Option
Function
-nc Prevents DEBUG from copying the target object file. DEBUG maps the object file so that you can write the breakpoint directly into the object file.
-proc proc_name Enables DEBUG to debug the next program executed in a specified process.
-read pathname Invokes a DEBUG command file with the specified pathname. -set argument(s) Sets one or more DEBUG variables at invocation.
-wpl0 ... -wp90 Sets the size of the DEBUG window pane from 10% to 90% of the process transcript window.
-nwp Causes DEBUG to use the same windows as your target program (no separate DEBUG windowpane). DEBUG's input and output mixes with your program's input and output.
-src Creates a "source-display" window paneas well as a DEBUG windowpane and displays the source file as you debug your program. This option is on by default.
-nsrc Suppresses creation of a source-display window pane.
-src_t Forces DEBUG to put the source-display window pane at the top of the DEBUG window pane.
-src_r Forces DEBUG to put the source-display window pane on the right of the DEBUG windowpane.
-sdir pathname Allows you to specify one or more alternate pathnames for source files.
-glob Enables DEBUG to enter routines in global address space.
-smap Prints a brief section map of the target program loading operation.
The remainder of this section describes these options in more detail.
2.2.2 The -NC Option
The -NC (No Copy) option prevents DEBUG from copying the target object file. Instead, DEBUG maps the object file so that you can write breakpoints directly into the object. This option is useful when you are debugging a large program. The -NC option saves time because the system requires less time to map the tar-get for writing than it does to copy the entire procedure code.
[image:20.612.57.524.141.543.2]o
o
o
o
o
If DEBUG does leave breakpoints in the object file, it sets a flag so that you know that the object file is bad.
If you try to use the object file again, you receive the following error message:
object module has unremovable breakpoints; rebind (process manager/loader)
When you use the -Ne option, it is a good practice to keep an original copy of the object file and copy it to a test file before invoking DEBUG.
2.2.3 The -PROC Option
DEBUG always runs in a separate process from the target program. By default, DEBUG runs in a child of the process in which it is originally invoked, and the target program runs in the parent. You use the -PROe option to specify a different process for the target program to run in. The format for the option is:
process name -PROC pid
-process_uid
You must specify exactly one of the three choices with -PROe.
When you use the -PROe option, you do not specify a target program; instead, DEBUG watches the speci-fied target process (and its children) until it detects a new program being started (invoked or exec'ed). You are responsible for starting the target program in the named process. Usually you start the target program by invoking it on a command line, just as you would if you were not debugging it.
-PROC Example
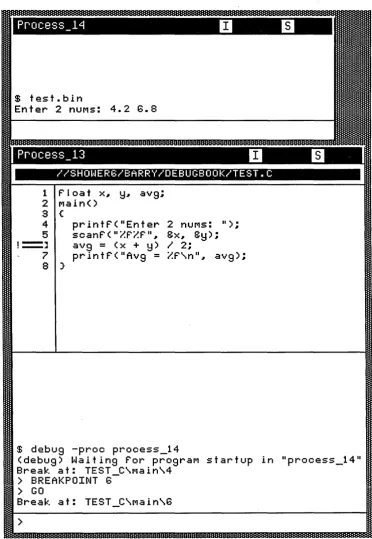
If you do not specify the -PROe option, DEBUG and the target program run in the same window, as shown in Figure 2-1. In this example, DEBUG is a child process of Process_B.
IISHOWER6/BARRY/DEBUGBOOK/TEST.C
1 P I oa t x..
y..
avg; 2 Main()3 ( 4
5
printP( IIEnter 2 nUMS: II); scanf(IIZPZP II .. gx .. gy);
, -
.
-
..
..
avg=
(x + y)I 2;
printP(IIAvg
=
;"-:P\nll .. avg);7 8 )
Break at: TEST C\Main\4
>
BREAKPOINT13->
GOBreak at: TEST_C\Main\13
>
[image:21.623.157.448.368.715.2]$ debug test.bin Enter 2 nUMS: 4.2 6.8
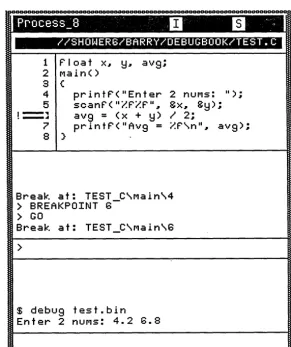
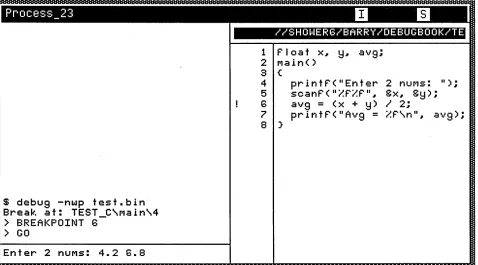
Sometimes, you may want to control the process in which the target and debugger run. Figure 2-2 shows how we used the -PROe option to run DEBUG in Process_13 and the target program in Process_14.
$ test.bin
Enter 2 nUMS: 4.2 G.8
IISHOWERG/BARRY/DEBUGBOOK/TEST.C
1 F' I oa t x.. y.. avg;
2 Main()
3 (
4
5
1 - "
. -
..
7
8 )
printF'( "Enter 2 nUMS: II); scanF'(Ii:F'i:F'" ..
Bx .. By);
avg=
(x + y)I 2;
printF'(IIAvg
=
i:F'\n" .. avg);$ debug -proc process_14
(debug) Waiting Por prograM startup in Iprocess_14" Break at: TEST C\Main\4
>
BREAKPOINTG->
GOBreak at: TEST_C\Main\G
[image:22.615.101.474.94.634.2]>
Figure 2-2. Debugging With The -Proc Switch
Let's trace the steps we used to get the situation shown in Figure 2-2:
1. We created two shells. In our examples, the operating system named the
sGhe~ls
process_ 1 1 3 4 andd
C
Process_13. You'll likely get different names. We decided to run DEBU In Process_ an
test. bin in Process_14.
o
o
o
o
o
2. We typed the following command in Process_13:
$ debug -proc Process_14
The system responded with the following prompt:
(debug) Waiting for program startup in "Process_14" 3. We moved the cursor into Process_14 and entered the command:
$ test. bin
4. We debugged test. bin by entering DEBUG commands from Process_13; program output ap-peared in Process _14.
Using -PROC to Debug Child Processes Spawned by a Program
Because DEBUG watches both the specified target process and its children for a program start, you can use DEBUG to debug child processes spawned by a program. The basic technique is the following:
1. Start the parent program, but don't start it under DEBUG.
2. After the program has started, but before it spawns the child process, start DEBUG specifying the parent process in a -PROe option. You may need to force the parent to pause in order to accom-plish this.
3. Resume the parent process. When the child process is created and either invokes or execs a new program, DEBUG switches its attention to the child process and debugs the new program.
For programs that use a fork-exec sequence to spawn a child, you can use the following alternate tech-nique:
1. Modify the code to force the child process to pause after the fork but before the exec.
2. When the child process pauses, start DEBUG on it.
3. Resume the child process. DEBUG will detect the exec as above.
Advantages of -PROC
Using the -PROe option has several advantages. The first advantage is that the -PROe option minimizes DEBUG's interference with the target process. The normal DEBUG invocation creates a new process in which to run the debugger (transparent to the user). However, at invocation, DEBUG momentarily runs in the same process as the target before continuing in the newly created process. This can alter memory con-tents and cause the target to run differently from a program running in a separate process, particularly if the program has unitialized variables or erroneously makes wild memory references. Therefore, if your pro-gram runs differently during a normally invoked DEBUG session than when you run it alone, try using the -PROe option.
The second advantage is that the -PROe option forces DEBUG to run in its own separate window. This en-ables you to use the Display Manager DQ (eTRL \Q) command unambiguously in either the debugger or the target window.
The third advantage is that the -PROe option gives the target program full use of a window.
2.2.4 The -READ Option
-Read path name
where pathname is the name of a file containing DEBUG commands. DEBUG executes the commands in the file immediately after it executes the commands in the default startup files (if they exist; see Chapter 1). The -READ option serves an identical purpose as the READ command (described in Chapter 3). By issu-ing a READ command as your very first command, you get the same results as if you had used the -READ option on your command line.
If the file contains any GO or STEP commands, DEBUG defers processing these commands until it has processed every other command. For example, in the following command file, the EXAMINE command executes before the GO command:
> SET 'max_var_len
=
66 > BREAKPOINT 262> GO
> EXAMINE try
NOTE: Your DEBUG command line may contain no more than one -READ option. How-ever, the file of DEBUG commands may itself contain READ commands.
2.2.5
The
-SET
.Option
The -SET option sets the value of one or more debugger variables at invocation. For information on debugger variables, see the "Debugger Variables" listing in Chapter 3. Remember that debugger variables are somewhat different from program variables. After you invoke DEBUG, you can also set values with the SET command. (The option and the command are similar.) The option has three different formats:
FORMAT1: -SET 'debugger variable
-SET 'debugger-variable=initial value FORMAT2:
FORMAT3: -SET u 'debugger_variable = imtia,-value "
In other words, specifying the name of the 'debugger_variable is mandatory, but specifying its value is op-tional. If you do not specify its value, DEBUG will prompt you for it. The only difference between FOR-MAT2 and FORMAT3 is blank space. If there are any blank spaces between the 'debugger_variable and the initial_value, then you must enclose both in quotation marks (either single or double). For example, compare the right and wrong ways to use -SET:
-SET 'max_array_dim -SET 'max_array_dim=8 -SET 'max_arraY_dim = 8 -SET "'max_array_dim = 8"
(Right) (Right) (Wrong) (Right)
For more information about the SET command, refer to Chapter 3.
2.2.6
Window pane Options: -WPnn and -NWP
By default, DEBUG divides the window into three window panes: the source display window pane, the DE-BUG commands window pane, and the program I/O window pane. In this section, we concentrate on the DEBUG commands window pane and the program I/O window pane.
c
By default, the DEBUG commands window pane and the target program I/O window pane take up equal ~,
space as shown in Figure 2-3. You can scroll through the DEBUG commands transcript pad and the target
l ..
program 1/0 transcript pad work just as you would through any other DOMAIN transcript pad. DEBUGo
o
Break at: TEST_C\Main\4
>
BREAKPOINT 6>
GOBreak at: TEST_C\Main\6
>
$ debug test.bin
Enter 2 nUMS: 4.2 6.8
IISHOWER6/BARRY/DEBUGBOOK/TE
1 F'I oa t x.. y.. avg; 2 Main()
3 (
4
5
1 - "
.-
..
7
8 )
printF'( "Enter 2 nUMS: II); scanF'(IZF'ZF'" ..
ex .. ey);
avg
=
(x + y)I 2;
[image:25.617.69.551.56.333.2] [image:25.617.67.546.437.704.2]printF'(IIAvg
=
ZF'\n" .. avg);Figure 2-3. Default Window Panes.
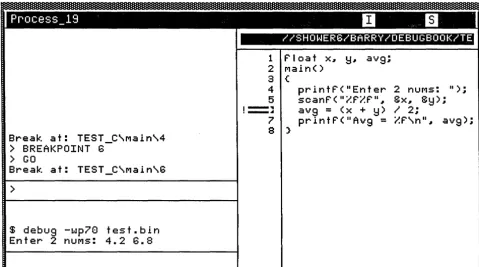
Use the -WPnn options to specify window panes of differing sizes. You can set the DEBUG window pane size in increments of 10 percent of the transcript window. The options are:
o
-WP10, -WP20, ... -WP90 = DEBUG window pane size of: 10%, 20%, ... 90% For example, Figure 2-4 demonstrates a DEBUG window pane size of 70%.o
o
I
Ii
Break at: TEST_C\Main\4
>
BREAKPOINT 6>
GOBreak at: TEST_C\Main\B
>
$ debug -wp78 test.bin Enter 2 nUMS: 4.2 6.8
IISHOWER6/BARRY/DEBUGBOOK/TE
1 F' I oa t x.. y.. avg; 2 Main()
3 ( 4 5
1 - "
.-
..
7
8 )
printF'( "Enter 2 nUMS: II); scanF'(IIZF'ZF'II ..
ex .. ey);
avg
=
(x + y)I 2;
printF'(IIAvg
=
ZF'\nll .. avg);The -NWP option suppresses the creation of separate input and transcript pads; therefore, all DEBUG commands mix with program input and output as illustrated in Figure 2-5.
$ debus -nwp test.bIn
Break at: TEST C\MaIn\4
>
BREAKPOINT
B->
GO
Enter 2 nUMS: 4.2
B.8
IISHOWERB/BARRY/DEBUGBOOK/TE
1 f' I oa t x..
y..
avS; 2 MaIn()3 (
4
5
B 7
8 )
prlntf'( IIEnter 2 nUMS: II);
scanf'(II~f'~f'II ..
&x .. &y);
avS
=
(x + y)I 2;
[image:26.612.64.542.100.365.2]prlntf'(IIAvS = ~P\nll .. avg);
Figure 2-5. -NWP Combines the DEBUG Commands Window Pane and the Target Program I/O Win- (
dow Pane. \, __
~
The primary advantage of the -NWP option is that it causes the DEBUG commands you enter to be pre-served when the DEBUG session ends. (If you do not specify -NWP, the DEBUG commands disappear.) The primary disadvantage of -NWP, is that if you specify it, DEBUG may not be able to display anything if your program
• Creates a frame.
• Does direct graphics in a window. That's because direct graphics programs take control of the dis-play and keyboard (resources that the Disdis-play Manager normally controls). If a breakpoint or fault occurs while you're debugging a program of this kind, DEBUG returns the display and keyboard to the Display Manager's control. The program regains control of these resources just before it re-sumes execution.
• Relies on exclusive use of STREAM_$ERRIN and STREAM_$ERROUT.
If you specify -NWP and -PROC on the same command line, DEBUG ignores the -NWP.
2.2.7 Source Display Options: -SRC, -NSRC, -SRC_T, and -SRC_R
The source display feature allows you to view your source code as you debug it. Use one of the DEBUG op-tions -SRC, -SRC_T, or -SRC_R to trigger source display debugging. There are only minor differences among the three:
• If you specify -SRC_R, DEBUG puts the source display to the right of the other window panes. For example, see Figure 2-4.
Invoking Debug 2-10
c'
o
o
o
o
o
o If you specify -SRC_T, DEBUG puts the source display on top of the other window panes. For ex-ample, see Figure 2-1.
o If you specify -SRC in a window that is wider than it is tall, DEBUG puts the source display to the right of the other window panes (Le., like -SRC_R).
o If you specify -SRC in a window that is taller than it is wide, DEBUG puts the source display on top of the other window panes (Le., like -SRC_T).
The -SRC option is the default. Use the -NSRC option to suppress source display.
If you specify -NWP with -SRC, -SRC_R, or -SRC_T, DEBUG divides the window into only two window panes (instead of three) and puts the source display to the right or on top.
2.2.8 The -SOIR Option
The -SDIR (Source Directories) option allows you to specify one or more alternate directories for the source filename(s) stored in the object file. If DEBUG cannot find a source file that has the pathname stored in the object file, it extracts the filename section of the pathname, combines it with the first path-name from the list created with -SDIR, and searches again. DEBUG continues to search through the list of pathnames until the search succeeds or until the end of the list. The format of -SDIR is:
-SDIR pathname ... -SDIR pathname
In other words, the key word -SDIR must be followed by a pathname. Furthermore, the command line can optionally contain more than one of these options.
DEBUG processes the pathnames from left to right across the command line to compose the SDIR list. You can also create or add to the SDIR list with the SOURCE command described in the" SOURCE" listing of Chapter 3.
2.2.9 The -GLOB Option
The -GLOB option is detailed in Appendix B. It should only be of concern for those programmers wishing to debug installed libraries.
2.2.10 The -SMAP Option
If you specify the -SMAP option, DEBUG prints a section load map at startup. For example, here is a sample load map:
Object Module "//SHOWER6/BARRY/DEBUGBOOK/TEST.BIN" Section Map:
# Location Size Name
1 00008000 000000A8 PROCEDURE $
2 000080A8 00000068 DATA$
3 009080E8 00000104 DEBUG$ 4 00008110 00000004 AVG
5 00008114 00000004 Y
c
,;---/ '
\
'--- .'u
o
o
0
o
Chapiter
3
In Chapter 2, we explained how to invoke DEBUG; here we explain how to use DEBUG once it has been invoked. This chapter starts with some important facts about using DEBUG; the remainder of this chapter is an encyclopedia of DEBUG commands.
If you are not familiar with DEBUG, we suggest that you read the tutorial introduction in Chapter 1, focus on sections 3.1, 3.2, and 3.3 of this chapter, and concentrate on the following listings later in this chapter:
•
BREAKPOINT•
EXAMINE•
GO•
QUIT•
Routine-Name•
Variables•
STEP3.1 Entering DEBUG Commands
DEBUG provides many ways to enter DEBUG commands. The simplest method is simply to enter one command at a time in response to the DEBUG prompt (»; for example:
> EXAMINE prufrock
> BREAKPOINT 17 > QUIT
A command string is two or more DEBUG commands separated by semicolons. A command string can-not exceed 512 characters. Here are three simple commands combined into a command string:
An action-list is a command or command string enclosed by a pair of brackets. Usually you do not enter' an action-list by itself but as an argument to a more complex command such as IF. You can make an ac-tion-list span more than one line by not closing the brackets until the end of the action list. For example, the following action-list spreads across three lines: .
> [EXAMINE prufrock; BREAKPOINT 17;
PRINT carray]
>
Note that DEBUG prompts you with an underscore
U
until you include the closing brackets.Another way to enter commands is to store them in a file and allow DEBUG to execute all the commands in the file. There are a number of ways to specify such files:
• If the user_data directory in your home directory contains a file named startup_debug, DE-BUG reads and executes the commands in the file when you invoke DEDE-BUG.
• If the working directory contains a file named startup_debug, DEBUG reads and executes the commands in the file when you invoke DEBUG.
• If you specify the -READ pathname option when you invoke DEBUG, DEBUG reads and exe-cutes the commands in pathname when you invoke DEBUG.
• If you specify the READ pathname command after you've invoked DEBUG, you can get DEBUG to read and execute the commands in pathname during your DEBUG session.
Finally, you can group one or more DEBUG commands into a macro by using the MACRO command. Then, if you want DEBUG to execute all these commands, you merely specify the name of the macro.
3.2 Overview of DEBUG's Features
This section provides an overview of DEBUG features.
3.2.1 Setting Breakpoints and Tracing
c
Use the BREAKPOINT command to set a breakpoint. If you just want to know that your program exe-cuted a certain statement, use the -TRACE option with BREAKPOINT. DEBUG does not stop the pro-gram when you use -TRACE. DEBUG permits you to specify an action-list for DEBUG to perform when
it reaches the breakpoint. (~
3.2.2 Controlling Program Flow
DEBUG permits you to step through the program on a statement by statement basis or to go until the next breakpoint is reached. You can restart a stopped program from the statement where it last stopped or from anywhere else in the same routine. You can stop the execution of the current routine and, if the routine has a return value or can take a FORTRAN alternate exit, you can force the return parameters to whatever values you wish. The GO and STEP commands control program flow.
3.2.3 Operating on Variables
DEBUG can show the values, give the virtual address, describe the data types, and change the values of variables. It can perform these operations on all FORTRAN, Pascal, and C variables with one exception: Pascal FILE variables. You can only describe (with the DESCRIBE command) a Pascal FILE variable. You can, however, do anything with a file_variable".
When you use DEBUG to examine the contents of a variable, you can display the data according to the variable type (for example, integer data displayed as integers) or in some other standard format (hexa-decimal or ASCII, for example).
"-- .
o
o
o
o
o
You can also use variables as terms in expressions that DEBUG evaluates.
Use the PRINT and EXAMINE commands to display a variable's value, and use the SET command to change a variable's value.
3.2.4 Displaying Traceback and Examining Routine Arguments
The DEBUG command ARGS (arguments) displays the arguments, if any, of a routine. The DEBUG command TB (traceback) traces the calling sequence that led to the current routine, and can optionally show the arguments of each routine in the calling sequence.
3.2.5 Creating Debugger Macros and Definitions
If you have commands that you often enter or text strings that you often use, you can define debugger names as shorthand for those strings or commands. This allows you, for example, to examine a group of variables repeatedly without typing all the variable names each time.
Use the MACRO command for creating command macros and the DEFINE command for creating text string definitions.
3.2.6 Setting Environments
In most instances, DEBUG automatically searches the proper environment (i.e., routine) when you ask to set a breakpoint, examine a variable, etc.; however, in some cases, you may want to explicitly name a dif-ferent environment for DEBUG to look in. The two most common reasons for setting a difdif-ferent environ-ment are:
o When the program is stopped in a routine, but you want to examine the value of a variable stored in another routine.
• When the program is stopped in a routine, but you want to set a breakpoint in another routine.
You control the environment with the ENVIRONMENT command.
3.2.7 Running a Shell From the Debugger
DEBUG allows you to run a Shell by invoking the SHELL command. This Shell is exactly like any DO-MAIN operating system Shell: it allows you to run programs, execute Shell commands, and so on. Once you close the Shell, you return to debugging your program.
3.3 General DEBUG Information
Here, we discuss command abbreviations, case sensitivity, and debugger names.
3.3.1 Command Abbreviations
Most DEBUG commands can be abbreviated. For example, you can use any of the following to specify the QUIT command:
> Q
> QU
> QUI
> QUIT
3.3.2 Case Sensitivity
The keywords in DEBUG commands are case insensitive. The names of procedures, functions, subrou- ( ; , tines, and variables in Pascal and FORTRAN programs are also case insensitive. However, the names of -' functions and variables in C programs are case sensitive.
3.3.3 Debugger Names (of Variables, Macros, and Definitions)
You can use debugger names in definitions made with the MACRO and DEFINE commands, and as names for debugger variables. A debugger name has the following general format:
... identifier
The accent grave ("'), often called a "tic", must be the first character. Following the accent grave, you must specify an identifier. The fiTst character of the identifier must be a letter. Each succeeding character can be a letter, a digit, an underscore
lJ
or a dollar sign ($). The name can contain up to 32 characters.3.4 The DEBUG Encyclopedia
The remainder of this chapter consists of an encyclopedia of DEBUG commands and concepts. We've organized the listings alphabetically. The following list summarizes the DEBUG commands:
ARGS
BREAKPOINT
DEFINE
DELETE
DESCRIBE
ENVIRONMENT
EXAMINE
EXIT
GO
HELP
IF
JUMP
LIST
MACRO
QUIT
READ
SET
SHELL
SIGNAL
SOURCE
Displays the names and values of each argument in an active routine.
Sets a breakpoint.
Defines an abbreviation for a frequently-used command or string.
Deletes macros, definitions, breakpoints, or alternate source directories.
Describes the data types of one or more variables.
Displays· or changes an environment.
Displays the value(s) of one or more variables.
Ends a debugger session.
Begins or resumes execution of the target program.
Displays information about DEBUG commands.
Evaluates a given expression and conditionally executes an action-list.
Moves between commands in an action-list.
Lists information on macros, definitions, breakpoints, routines, program vari-ables, DEBUG varivari-ables, and alternate source directories.
Defines a sequence of DEBUG commands that you can then invoke with a
sin-gle name. .
Displays the value(s) of one or more expressions.
Ends a debugger session and terminates the target program.
Executes a file of DEBUG commands.
Assigns a new value to a program variable or debugger variable.
Invokes a command Shell.
Simulates a fault.
Specifies the source code that DEBUG displays.
(~
(~
o
o
o
o
o
STCODE STEP TB VA #
Displa ys the text of a system error code.
Executes the next statement in the target program. (Traceback) Displays the current call stack.
Displays the virtual address of a variable, a routine, or the program counter. Adds a comment line to the DEBUG transcript pad.
The following list summarizes the DEBUG conceptual listings: Action-Lists
Arrays
You use an action-list to group commands for easy access.
When you want to examine or define a portion of an array you can turn to this listing for information on specifying all or part of an array.
Debugger-Variables In addition to program variables from your source code, DEBUG understands
Expressions
Faults
Po in ter-Variables
Routine-Name
two other kinds of variables: user-defined debugger variables and predefined debugger variables. Both are described here.
Some DEBUG commands can take an expression as an argument. Here, we explain the rules for composing a legal DEBUG expression.
This listing explains how DEBUG handles faults and fault-handlers.
This listing explains how to manipulate pointer variables during DEBUG ses-sions. (Also see Section 4.2.5 in Chapter 4.)
In a program with more than one routine, it is important that you understand how to identify the proper routine; turn here for that understanding.
Source Code Display This listing details the source code that DEBUG displays. Statement-ID
Variables
This listing explains how to specify a particular statement in a program (so that you can set a breakpoint there, for instance).
Action-Lists -- Use an action-list to group commands together for easy access.
FORMAT
An action-list is not a command, but a way of entering commands.
[debug-command1,' debug-command2; ... ; debug-commandN]
REQUIRED
None.
OPTIONAL
debug-command Zero or more DEBUG commands separated by semicolons (;). See Section 3.1 for a description of DEBUG commands.
DESCRIPTION
An action-list is a way to group commands for easy access. Usually, action-lists are used as arguments to other commands. For instance, the BREAKPOINT command takes an action-list as an optional argument. However, you can also issue an action-list by itself, unattached to another command. Enclose the entire action-list in square brackets. For example, here is a sample action-list:
[EXAMINE x; PRINT string; GO]
DEBUG prompts for more commands for the action-list as long as there are more left brackets than right brackets, and the total length of the command string does not exceed 512 characters. The prompt for more input is an underline character. For example, here is a command with an action-list that is spread over four lines. For clarity, we show the commands in the action-list on separate lines
(DEBUG does not require this format).
> BREAKPOINT beach\ -DO [EXAMINE david; PRINT ~Value should be:~, mermaids DESCRIBE waves, storm;
EXAMINE waves, storm]
DEBUG also uses the underline character as a prompt for more input when you use square brackets to define arrays and sets. Refer to the" Arrays" listing for details.
DEBUG does not check the contents of an action-list until you execute it. In other words, if you made some sort of syntax error within an action-list, DEBUG does not detect the error when you de-fine the action-list, but detects the error when you execute the action-list. .
GO and STEP Commands Within Action-Lists
If you place a GO command in an action-list, it will be the last command executed in the action-list. For instance, although the following action-list looks temptingly correct
> [BREAKPOINT 25; GO; EXAMINE x]
DEBUG only executes the BREAKPOINT and GO commands. DEBUG does not execute the EX-AMINE because it appears after the GO. (You could put the EXEX-AMINE command in an action-list associated with the breakpoint to get the desired result.)
o
o
o
o
o
ARGS -- Displays an active routine's arguments and argument values.
FORMAT
Args routine-name
REQUIRED ARGUMENTS
None. If you do not specify a routine-name, DEBUG displays the arguments of the cur-rent routine.
OPTIONAL ARGUMENTS
routine-name
DESCRIPTION
The name of an active routine whose arguments you want to investigate. (See the "Routine-Name" listing later in this encyclopedia for details about specifying a routine-name. Note that a routine-name can include an activation-number which identifies a specific activation of a recursive routine. Don't forget that a routine-name must end with a backslash \.)
Use the ARGS command to display the name and value of each argument of the specified active rou-tine. Note that ARGS only reports information about the routine's arguments (Le., parameters); it does not report the routine's local variables. DEBUG does not necessarily display the arguments in the same order you defined them.
The optional routine-name must be the name of an active routine. The only routines that are active at anyone time are
• The routine where DEBUG is currently stopped.
• The routine(s) that called this routine. (Therefore, the main routine of the program is always active.)
Before issuing ARGS, you may want to set the debugger variables ... max_qual, ... max_ var_Ien, or ... max_array_dim, which are detailed in the "Debugger Variables" listing later in this encyclopedia.
See also the -Args option of the TB command.
Note To FORTRAN Users
DEBUG does not know whether a a program entered a subroutine through the main or through an al-ternate entry point. When you issue an ARGS command, DEBUG always tries to display the arguments associated with the main entry. Thus, the data that DEBUG displays may be invalid if the program
en-tered the routine through an alternate entry.
-You can use EXAMINE or SET commands to access the arguments you know to be valid. If you use the ARGS command or attempt to EXAMINE or SET invalid arguments, you will get bad data and possibly an access violation or odd address fault.
EXAMPLES
Suppose you are stopped at a breakpoint somewhere in routine F. To study the arguments of this rou-tine, issue the following command:
> ARGS
SAMPLEMOD\MATH\F\x 5 SAMPLEMOD\MATH\F\y 3.14
c
o
o
o
o
The results indicate that routine F supports two arguments, x and y, with values of 5 and 3.14, respec-tively. We could have produced the same results by issuing a routine-name, for instance:
> ARGS F\
SAMPLEMOD\MATH\F\x
=
5 SAMPLEMOD\MATH\F\y = 3.14Since routine F was called by routine MATH, we can also investigate the arguments of routine MATH as follows:
> ARGS MATH\
Arrays -- Here, we explain how to specify arrays in commands that accept them as arguments.
DESCRIPTION
DEBUG supports several ways to specify an array or a portion of an array. Before you specify an ar-ray, you may want to read the "Debugger Variables" listing later in this encyclopedia. The variable
.. max_array_dim is particularly useful when specifying arrays.
Consider, for example a three-dimensional array (10 x 9 x 8) named stearns. You can refer to this variable or parts of this variable in any of the following ways:
• Simply give the array name, in which case any operation refers to the whole array (for example, stearns).
• Name an element explicitly (for example, stearns (1,5,5) or stearns [1,5,5]). (You can use parentheses or square brackets interchangeably, regardless of the source language.)
• Specify, in place of an array subscript, a range of the form:
o
expression: expression
In this case, the first expression must be less than or equal to the second, and both must evalu-ate to integers or the approprievalu-ate index type, for example:
stearns(1:5,6:9,5»
alphabet['a':'z'] (A Pascal array indexed by chars.)
Replace an explicit reference to one or more array dimensions with an asterisk (*), which re-fers to all subscripts in that dimension. Omitting the dimension has the same effect, as long as you include all dimensions to the left, and do not include any dimensions to the right. For ex-ample, each of the following examples refer to the entire array:
stearns(1:10,1:9,1:8) stearns[*,*,*]
stearns(*,*) stearns [] stearns
The following are also equivalent to each other:
stearns(8) stearns[8,*,*]
stearns(8:8,1:9,1:8)
Here are some more, examples of legal array references: stearns(1:8)
stearns(8,1:9)
stearns(*,8)
stearns(9,8)
(Refers to the first eight elements of the first
dimension, and all elements of the other two dimensions.)
(Refers to the eighth element of the first dimension and all elements of the second and third dimensions.)
(Refers to all of the first and third dimensions and the eighth element of the second dimension.)
(Refers to the ninth element of the first dimension,
the eighth element of the second dimension, and all elements of the third dimension.)