promoting access to White Rose research papers
White Rose Research Online
Universities of Leeds, Sheffield and York
http://eprints.whiterose.ac.uk/
This is an author produced version of a paper published in
Materials and
Structures
.
White Rose Research Online URL for this paper:
Published paper
Tlemat, H., Pilakoutas, K., Neocleous, K. (2006)
Stress-strain characteristic of
SFRC using recycled fibres
, Materials and Structures, 39 (3), pp. 365-377
Ref. MS1696 – Resubmitted Right side of the page
reserved to our referees
Stress-strain characteristic of SFRC using recycled fibres
Authors: H. Tlemat, K. Pilakoutas and K. Neocleous
Centre for Cement and Concrete, Department of Civil & Structural Engineering, The University of Sheffield, UK
Abstract:
This paper presents work from a comprehensive study on the development of a flexural design framework for concrete reinforced with steel fibres that are recovered from used tyres. The experimental flexural behaviour of notched concrete prisms reinforced with these fibres is initially presented. For comparison purposes, prisms reinforced with industrially produced fibres are also considered. An attempt to adopt an existing RILEM design framework to derive appropriate tensile stress-strain blocks is made, but problems are identified with key parameters of the framework. The influence of crack propagation and location of neutral axis depth on the tensile stress distribution is examined. Following an analytical study, it is concluded that the uniaxial stress-strain model, proposed by RILEM overestimates the load-carrying capacity and should be modified by utilising more advanced analytical techniques.
Résumé
Cet article présente une étude sur le développement d'un cadre flexural de conception pour le béton armé à base de fibres d’acier récupérées des pneus utilisés. Le comportement flexural expérimental des prismes en béton entaillés renforcés avec de fibres est initiallement presenté. Aux fins de comparison, des prismes renforcés à base de fibres industriellement produites sont également considérés. Pour déduire les blocs de tension appropriés de contrainte-deformation, une tentative d'adopter un cadre existant de conception de RILEM est effectuée, cependant des problèmes sont identifiés avec les paramètres clé du cadre. L'influence de la propagation de fissure et ainsi que la location de la profondeur d'axe neutre sur la distribution de tension d'effort est examinée. A la suite d’une analyse analytique, on peut conclure que le modèle de contrainte-deformation uniaxial, proposé par RILEM surestime la charge de portance et devrait être modifié en utilisant des techniques analytiques plus élaborées.
1. Introduction
Waste arising from used tyres is currently being managed through the implementation of environmental legislation. In the European Union, the driving force behind the waste management of tyres is the implementation of a number of directives, especially the 1999 Landfill directive [1]. This directive has already stopped the disposal of whole tyres to landfill, and will prohibit the disposal of tyre constituents by 2006. As a result, tyre recycling has become much more popular since it is one of the most environmentally friendly and economically viable ways of managing waste tyres.
and steel fibres. In pyrolysis, tyres are thermally decomposed to their constituents in the absence of air such as oil, gases (hydrogen, methane and other hydrocarbons), carbon, and steel wires. In the cryogenic process the tyre is fractured after being frozen to a suitable temperature.
Research at the University of Sheffield [2, 3, 4, 5] demonstrated that steel fibres recycled from used tyres (RSF) can be effectively used to reinforce concrete. In addition, it was indicated that the mechanical behaviour of concrete reinforced with tyre-recycled steel fibres (RSFRC) is comparable to that of conventional steel fibre reinforced concrete (SFRC). Therefore, it can be presumed that the design models developed to evaluate the flexural resistance of conventional SFRC are also applicable for RSFRC.
An attempt to use the RILEM design model [6, 7, 8] in FEA simulation for the derivation of flexural behaviour of RSFRC was not successful due to the following reasons. The RILEM model considers almost constant tensile stress in the fracture zone, which is clearly not the case for all fibres, since failure is mainly through pull-out and not yield.
The value used for the load at the limit of proportionality Fu
directly affects the determination of the design parameters such as the stress at the limit of proportionality, ffct, and the
equivalent flexural strengths, feq2 and feq3. The authors found
that the RILEM procedure for determining Fu [6] does not
give consistent results. A Brite-Euram project on SFRC developed an iterative procedure for determining Fu, where
a reasonable estimate of the initial slope (between 0.1 and 0.4 of the peak load) is necessary [9]. This project demonstrated that the iterative technique leads to more uniform results, but attempts by the authors to use the procedure did not lead to consistent results. It is noted that the final RILEM recommendation for the σ-ε model uses residual flexural tensile strengths and, hence, the model is independent of Fu.
Finally, two fixed values are considered for the neutral axis depth for the determination of post-cracking flexural tensile strengths (σ1 and σ2) after cracking, independent of the
amount and type of fibre reinforcement.
This paper describes an experimental study, carried out on RSFRC and SFRC prisms to investigate the above issues. The effect of crack propagation and location of neutral-axis depth on the tensile stress distribution are examined.
The study was carried out on notched prisms by utilising the RILEM bending test [6]. It is noted that a four-point load arrangement was used instead of three-point load. The use of four-point load arrangement created a region of constant moment and, hence, minimised the overestimation of bending resistance, caused at the point of load application by the load-spreading effect [10].
2. Experimental Examination 2.1 Methodology
2.1.1 Types of fibres and mixes
Two types of RSF were considered: a) pyrolysed and b) shredded. Steel fibres obtained from virgin tyre cord and two types of industrially produced steel fibres were also examined.
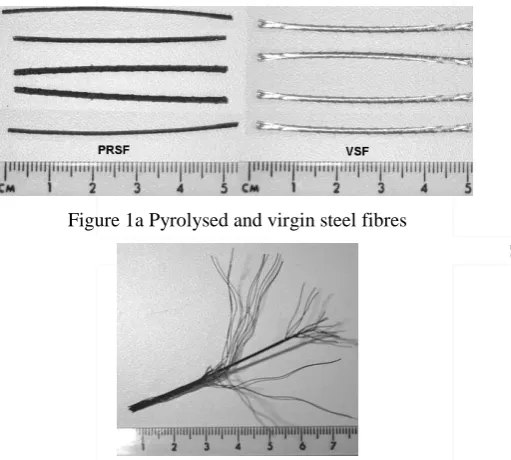
[image:4.595.44.300.369.599.2]The pyrolysed steel fibres (PRSF) were obtained by cutting recycled steel tyre-cord to 50 mm pieces. The cord was obtained from the microwave-induced pyrolysis of whole tyres [11]. The recycled cord was undamaged, since the tyres were decomposed at relatively low temperatures (about 350○ C). However, it is noted that the cord was not entirely clean, as it contained a layer of carbon on its surface. In addition, the steel fibre diameter depends exclusively on the type of cord used in the tyre. The typical fibres shown in Fig. 1a were obtained from super-single tyres. The fibres comprised 12 wires of 0.23 mm diameter, twisted together into a core strand of 0.85 mm diameter, and surrounded with another 15 twisted wires. On the cord surface there is a single twisted wire with a twist pitch of 5.33 mm (Fig. 1b). The fibre overall external diameter is 1.55 mm with effective diameter 1.16 mm and a tensile strength in excess of 1250 MPa. In general, the PRSF were not consistent in diameter (ranging 0.8 to 1.55 mm) and shape (Fig. 1a).
Figure 1a Pyrolysed and virgin steel fibres
Figure 1b Construction of one pyrolysed fibre
The virgin steel fibres (VSF) were obtained by cutting virgin steel tyre-cord to 50 mm pieces. The VSF fibres were free from any contaminates and had a consistent diameter of 1.55 mm. Their surface and tensile strength were similar to those of PRSF fibres (Fig 1a).
0.23 mm, a length averaging over 20 mm and a tensile strength of around 2000 MPa.
[image:5.595.46.534.14.843.2]Two types of industrially produced steel fibres (ISF) were used and both had a hooked end as illustrated in Fig. 3. The fibres with a flattened end, here called ISF-1, had a length of 50 mm, a nominal diameter of 1mm, and a tensile strength of 1050 MPa. The ISF-2 fibres were made of cold drawn wires, 50 mm long, 1.05 mm thick, and a tensile strength of 1000 MPa (Fig. 3). The geometry and tensile strength of each fibre type are summarised in Table 1.
Figure 2 Un-sieved shredded steel fibres
Figure 3 Types of industrially produced steel fibres
Table 1. Summary of geometry and tensile strength for each type of fibre
Fibre type
Length (l)
Diameter (d)
Tensile strength
[mm] [mm] N/mm2 SRSF 20a 0.23a ~ 2000 PRSF 50 0.80 – 1.55 >1250 VSF 50 1.55 >1250 ISF-1 50 1.00b 1050 ISF-2 50 1.05 1000
a average, b nominal
Table 2. Material information for each type of prism
Groups: Type of Prism
Fibre ratio
Aspect ratio d/l
SP3 Sand Aggregates Slump 10 mm 20mm
[% ]1
[-] [%]2 [kg/ m3] [kg/ m3] [kg/ m3] [mm] Plain 0.0 - 0.1 865 345 690 200
SRSF
0.5 ≤87 0.2 860 1035 0 160 1.0 ≤87 0.4 855 1035 0 150
2.0 ≤87 0.75 744 1035 0 55
PRSF
1.5 ≈32 0.2 851 345 690 200
3.0 ≈32 0.4 837 345 690 150 6.0 ≈32 0.75 807 345 690 140
VSF
1.5 32 0.2 853 345 690 160 3.0 32 0.4 841 345 690 90
6.0 32 0.75 815 345 690 70 ISF-1 6.0 50 0.75 815 345 690 150
ISF-2 6.0 48 0.75 815 345 690 150
1 % by mass, 2 % by cement mass, 3 Superplasticizer
A mix design (SPFA 40/30) with a cement content of 236 kg/m3 and a water to cement ratio of 0.66 was used for all types of prisms. The coarse and fine aggregate used in this work was fluvial dragged gravel. For practical mixes, the maximum size of coarse aggregate is recommended not to be larger than 2/3 of the length of the steel fibre and should not exceed 1/5 of the minimum size of the specimen [12]. Hence, the aggregates used for plain and SRSF specimens had a maximum size of 10 mm. Two sizes of coarse aggregates were used for the remaining fibres: a) one with a maximum size of 10 mm, and b) one with a maximum size of 20 mm. To improve workability, 30% (by cement mass) of a special SPFA (superpozzolan fly-ash) and various percentages of superplasticizer (Sulphonated Napthalene-Formaldehyde Condensate) were used. Each mix resulted in a set of three prisms and six cubes.
As expected, Table 2 shows that increasing the fibre ratio reduces the workability as measured by the slump test. To obtain a reasonable workability the superplasticizer was increased when the fibre ratio was increased.
2.1.2 Specimen preparation
The prismatic specimens (150 mm deep, 150 mm wide, and 550 mm long) were cast in timber moulds. The specimens were cast in two layers, and were vibrated in the moulds during casting. A day after casting, the specimens were demoulded and then placed in the mist room until the day of testing. A notch (25 mm high and 5 mm thick) was sawn at mid-span, a day before testing, using rotating diamond blades into the tensile face of each beam (perpendicular to the top casting surface) [4, 5]. The purpose of the notch was to act as a crack inducer. All tests were performed at an age shown in Table 3.
2.1.3 Testing procedure
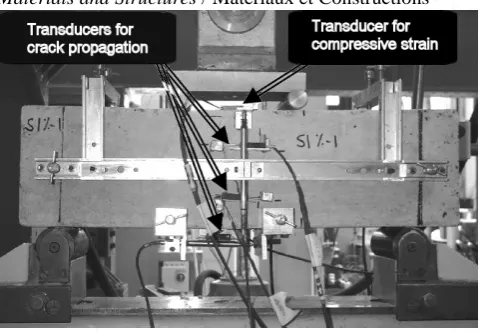
[13]. To avoid these errors and the effect of torsion on the deflection measurements, it was decided to use a yoke (Fig. 4) as specified by the Japanese standard [14]. The rollers were pinned and, hence, free to rotate and to allow the expansion of concrete. The specimens were tested in a 100 kN servo-hydraulic machine under displacement control at a constant rate of 0.2 mm/min [4, 5].
Average mid-span beam deflections were measured on both sides of the beam (δ1and δ2) using two transducers fixed to
[image:7.595.48.326.195.532.2]the yoke (LVDT5) and, hence, any torsional effects (due to the roller arrangement) were cancelled out.
Figure 4 Instrumentation and test set up
Figure 5 Testing arrangement and instrumentation
2.2 Results
2.2.1 Effect of fibre content and type 2.2.1.1 Compressive strength
For the compressive strength, cubes were placed according to BS 12 [15] with the cast face not in contact with the platens of the testing machine The load was applied at a constant rate of stress within the range of 0.2 to 0.4 (kN / s), and the compressive strength was measured to the nearest 0.5 MPa.
The cylinder compressive strength and the secant modulus needed for the subsequence analysis were calculated according to Eurocode-2 [16] as follows.
ffcm = 0.85*fcm, [MPa] Equation (1)
Efcm = 9.5 ffcm 2/3
[MPa] Equation (2)
Where:
Efcm secant modulus of concrete in compression, ffcm mean compressive cylinder strength in SFRC,
fcm measured mean compressive cube strength in
SFRC.
Table 3 shows the cube compressive strength as the average of six specimens tested on the same day as the corresponding set of prisms. Since different constituents are used in the different mixes, a direct comparison between groups is not easy to make. However, within groups, increased fibre reinforcement appears to increase the compressive strength in all fibres except SFRC. The reduction of strength shown for SFRC 2% may be associated with the reduced workability in that set. Between groups there is only one direct comparison that can be made relating to the sets having 6% fibres. If date of testing is taken into account, no major differences are noted.
2.2.1.2 Flexural strength
[image:8.595.44.288.43.209.2]Figure 6 Average load versus mid-span deflection for control beam
Figure 7 Fracture of plain concrete prism
Fig. 8 shows the average load versus average mid-span deflection for all the SRSF prisms. As expected, the flexural behaviour of the prisms improves as the fibre fraction increases. Fibres act as crack arrestors, giving a substantial increase in toughness, even when fibres debond and are pulling out. In the case of 0.5% fibre ratio, only the toughness was increased. The peak load is 10% lower than of plain concrete, but that can be attributed to the lower compressive strength. However, overall the peak load and the toughness increase with the amount of fibres used.
Figure 8 Flexural behaviour of SRSF prisms with different % of fibres
[image:9.595.47.282.478.638.2]large surface area. However, the diameter of this powder may be such that it leads to a better packing of the particles of wet concrete. The carbon black may also have an effect on the bond strength of the fibres. However, there is no physical evidence to support that. Since the fibres are mixed by weight and the PRSF fibres have carbon black, this means that less PRSF fibres are used in comparison to VSF. A density examination shows a difference between the two fibres at up to 15%. As less PRSF fibres are used in comparison to VSF, this may explain both the small reduction in energy absorption capacity and the increase in workability.
Figure 9 Effects of PRSF and VSF fibre ratios on flexural resistance
[image:10.595.43.281.189.359.2]Fig. 10 shows that the behaviour of the prism reinforced with 6% ISF-1 and ISF-2 fibres is similar to that of VSF and PRSF prisms. Fibres are pulled out rather than broken during the softening regime. Provided that the fibre bond with concrete is good enough, there should not be much difference between the behaviour of prisms with different fibres, despite the very different nature of the fibres.
Figure 10 Flexural behaviour of prisms containing 6% ISF, PRSF, and VSF
2.2.2 Pre-crack behaviour
[image:10.595.53.278.457.611.2]Figure 11 Initial behaviour for prisms containing PRSF
[image:11.595.84.262.282.419.2]On further deformation, the load also decreases due to complete fibre pull out. The experiments were stopped after the crack exceeded 4 mm. On unloading, the cracks were still visible as shown in Fig. 12.
Figure 12 Fracture of PRSF prism
2.2.3 Flexural strain and crack measurements
To determine the complete strain/crack-width profiles, gauges were used to measure the displacement at fixed points along the depth at mid-span as shown in Fig. 13.
Figure 13 LVDTs Locations and assumed strain distribution
The distance between Gauge 5 and Gauge 2 is equal to hsp.
The displacement measured at each gauge can be used to estimate the elastic strain prior to crack initiation and the crack width after crack initiation, as follows.
i i el i i
w
l
li is the length of the gauge
εi is the longitudinal strain.
After crack initiation, the displacement may be obtained as the sum of the elastic displacement and the crack opening (equation 4).
c i el i
i
w
w
u
()=
,+
, After crack initiation Equation (4)The compressive strain can be determined by dividing the displacement measured by gauge 5 by the length of the transducer l5 (50mm). The tensile strain prior to crack
initiation, at locations h2, h3 and h4 (30, 66 and 117 mm
from the bottom surface), respectively, can be determined by dividing the displacement measured by gauges 2, 3 and 4 by a gauge length of 55mm.
Using the cracked hinge model proposed by Ulfkjaer et al.
[17] and adopted for fibre reinforced concrete by Olesen [18], the tensile strain can be obtained by equation 5.
s
w
E
c i i
i t
. max ,
,
=
+
σ
ε
Equation (5)Where:
σi, max maximum stress at first crack,
wi,c deformation measured after crack initiation, s length of the hinge.
Obviously, the determination of the length of the hinge is critical in the calculation of strain. Ulfkjaer et al. [17] applied the hinge model to a three-point bending beam and obtained a value of s equal to hsp/2. This was based on
[image:12.595.41.282.268.337.2]simulated elasto-plastic analysis and comparison with experiments. This result was also confirmed by Olesen [18].
Fig. 14 shows the load versus mid-span deflection and strain at locations 2, 3, 4 and 5 versus mid-span deflection. It can be seen that the compressive strain εc0,s5 and the
tensile strain εt0,s2 prior to crack initiation (at a deflection
corresponding to point A) are more or less equal. The first crack at gauges 2, 3 and 4 was initiated at a load P0,s2, P0,s3
and P0;s4 of 21.4, 28.5 and 32.0 kN, respectively. After
crack initiation, the tensile strains εc1,s2; εc1,s3; and εc1,s4 at
peak loads (at a deflection corresponding to point B) were 1.31, 0.84 and 0.03 ‰, respectively.
Figure 14 Strain measurements for VSF 1.5%
2.2.4 Position of neutral axis depth
The position of the normalised neutral axis (y = 1-x/hsp)
[image:12.595.47.279.555.698.2]remain plane (Bernoulli). The calculated value of y varied between 0.61 and 0.82 at first micro crack and peak-load, respectively. The maximum depth of the neural axis was 0.95h at a deflection of 3.2 mm. For prisms with higher fibres ratio (3% and 6%), less values were registered, as shown in Fig. 15 for the loads at first-crack, peak and at 3mm deflection. Similar results were reported by Schnuetgen and Dam [19]. It is clear, that the simple approach taken by the RILEM model [7, 8] that the value of y is independent of the fibre volume is not right.
Figure 15 Variation of neutral axis depth for VSF prisms
Using the strain values determined at peak load (Point B, Fig. 14) and the corresponding neutral axis position, the strain profile over the prism’s depth can be determined as illustrated in Fig. 16.
Figure 16 Strain profile over the prism depth
It can be seen that the method to determine the strains and neutral axis position was accurate. This vindicates the choice of hinge length of hsp/2 and can be used as a building block for the development of design models.
2.2.5 Parameters for the determination of stress-strain relationship
To predict the stress-strain curve recommended by RILEM TC 162-TDF [7], the parameters associated with the bending test of the same standard [5] were studied. The limit of proportionality ffct and the equivalent tensile
strengths feq1 and feq3 were determined from the
load-deflection curve for four-point load tests at several specific deflection values (δu, δ2and δ3) as shown in Fig. 17. These
values were determined according to DVB [20], from where they were adopted by RILEM.
Fu is the highest value of the load when deflection δu does
[image:13.595.44.288.386.524.2]3
2
L
F
M
uu
=
∗
(Nmm) Equation (6) Where:L Support span (mm).
Assuming a linear stress distribution, the limit of proportionality ffct,u can be calculated by equation 7.
2 , sp u u fct
h
b
L
F
f
∗
∗
=
(N/mm2) Equation (7)Where:
b width of the specimen (mm),
hsp distance between the notch tip and the top of the
[image:14.595.41.535.10.824.2]cross section (mm).
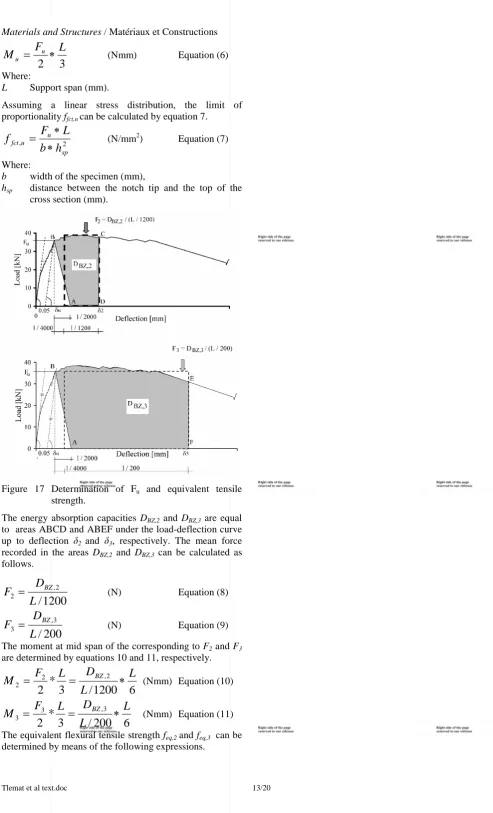
Figure 17 Determination of Fu and equivalent tensile
strength.
The energy absorption capacities DBZ,2 and DBZ,3 are equal
to areas ABCD and ABEF under the load-deflection curve up to deflection δ2 and δ3, respectively. The mean force
recorded in the areas DBZ,2 and DBZ,3 can be calculated as
follows.
1200
/
2 , 2L
D
F
=
BZ (N) Equation (8)200
/
3 , 3L
D
F
=
BZ (N) Equation (9)The moment at mid span of the corresponding to F2 and F3
are determined by equations 10 and 11, respectively.
6
1200
/
3
*
2
2 , 2 2L
L
D
L
F
M
=
=
BZ∗
(Nmm) Equation (10)6
200
/
3
*
2
3 , 3 3L
L
D
L
F
M
=
=
BZ∗
(Nmm) Equation (11)The equivalent flexural tensile strength feq,2and feq,3 can be
2 2 2 2 2 ,
6
/
sp sp eqbh
L
F
bh
M
f
=
=
(N/mm2) Equation (12)2 3 2 3 3 ,
6
/
sp sp eqbh
L
F
bh
M
f
=
=
(N/mm2) Equation (13)In addition, the residual flexural tensile strengths fR,1 and fR,4, provided by RILEM as a final recommendation [8],
[image:15.595.40.535.6.837.2]were calculated from the load-CMOD curve at CMOD equal to 0.5 mm and 3.5 mm, respectively as shown in Fig. 18.
Figure 18 Determination of Fu and residual tensile strengths
2 , , sp i R i R
bh
L
F
f
=
(N / mm2) Equation (14)It should be noted that the CMOD at the bottom surface is calculated using CMOD1 measured at a distance ξ (5 mm)
below the prism using the following relationship [21].
ξ
+
=
h
h
CMOD
CMOD
1 (mm) Equation (15)feq,2or fR,1 is used in the verification of the serviceability
limit states, while feq,3or fR,4 is taken into account at the
ultimate limit state. These design parameters were determined for all tested specimens and are tabulated in Table 3.
Table 3 Averaged test results Groups:
Type of Prism
Fibre ratio
fcm Age Fu Ppeak COVPp1 δu ffct,u feq,2 feq,3 fR,1 fR,4
[% ] [MPa] [Day] [kN] [kN] [%] [mm] [MPa] [MPa] [MPa] [MPa] [MPa] Plain 0.0 51.5 101 18.0 18.0 9 0.03 3.45 - - - -
SRSF
0.5 49.5 90 18.5 18.5 22 0.05 4.26 1.4 1.6 1.1 0.8 1.0 50.0 94 23.1 23.1 5 0.06 5.32 2.0 2.8 3.9 1.7 2.0 45.0 105 27.1 27.1 6 0.08 6.24 2.4 4.1 6.0 2.5
PRSF
1.5 44.0 112 25.1 27.1 7 0.07 5.78 3.3 4.6 5.4 3.7 3.0 38.5 113 31.7 34.0 15 0.11 7.30 4.3 6.1 7.8 5.8 6.0 50.0 115 37.4 58.3 15 0.11 8.62 6.3 11.0 12.6 11.2
VSF
1.5 54.1 163 28.7 28.6 11 0.09 6.61 3.2 5.8 6.6 4.3 3.0 62.0 162 33.4 40.7 23 0.07 7.7 5.2 7.7 10.2 5.2 6.0 66.2 161 41.6 61.6 23 0.07 9.6 5.9 12.6 14.1 10.4 ISF-1 6.0 52.9 66 44.8 64.6 14 0.09 10.3 6.6 12.4 14.1 12.7 ISF-2 6.0 63.9 196 46.8 61.3 6 0.12 10.78 5.6 11.8 13.8 11.5
1
[image:15.595.47.283.185.313.2]Ref. MS1696 – Resubmitted Right side of the page
reserved to our referees The results shown in Table 3 indicate that the equivalent
tensile strengths (feq,2 and feq,3) or the residual strengths (fR,1
and fR,4) of PRSF are slightly lower than for VSF (due to
reasons explained earlier). However, the strength characteristics of prisms reinforced with 6% VSF are similar to those for prisms containing 6% of ISF-1 or ISF-2. This can lead to the conclusion that cleaned PRSF fibres are as good as industrial fibres.
The feq,2and fR,1 values for the prism reinforced with 2%
SRSF are comparable to those obtained for prisms reinforced with 1.5% of the other types of fibres. However, this is not true for feq,3or fR,4. This indicates that SRSF can
be used in applications where bridging of micro cracks is more important than flexural strength.
3. Discussion on Parameters
The results in Table 3 suggest that the relationship between the equivalent flexural tensile strengths (feq,2and feq,3) and
the residual flexural tensile strengths (fR,1 and fR,4) differs
significantly. The residual flexural tensile strength values (fR,1) were higher than the values obtained for the equivalent
flexural tensile strength feq,2. This is probably as much to do
with the definition of these values and the test method as with the accuracy. This difference ranged from 1.6 to 2.5 times. This means that the use of both parameters for design purposes, in a similar way as recommended by RILEM, can lead to different results. This problem is related to the fact that the RILEM method for determining the load at the limit of proportionality Fu and the corresponding δu is not
consistent. Therefore, the evaluation of DBZ,2 is inaccurate.
The effect of errors in the determination of the initial slope on feq,3 is minor. Fig. 19 shows the relationship between feq,2
[image:16.595.53.302.459.610.2]and feq,3, and between fR,1 and fR,4.
Figure 19 Correlation between equivalent tensile strength and residual tensile strength parameters
Fig. 20, on the other hand, reveals that the residual tensile strength parameter fR,4 and equivalent tensile strength feq,3
have similar values but fR,1 is greater than feq,2. This
indicates that fR,4 and feq,3 parameters are insensitive to
Figure 20 Correlation between fR and feq.
4. Analytical investigation of RILEM
stress-strain approach
The design recommendation proposed by RILEM appears to overestimate the load-carrying capacity of prisms tested by the Brite-EuRam Project BRPR-CT98-0813 [22]. To investigate the reliability of the RILEM stress-strain model, it is necessary to calculate the load mid-span deflection. For the finite element analysis undertaken by Dupont and Vandewalle of the Brite-EuRam project BRPR-CT98-0813 [22] a relatively simple approximation of the stress-crack width curve was used as input for tensile stiffening. The final stress-strain relationship was then calculated by simply dividing the crack width by the characteristic length, which was assumed to be the length of one finite element. Dupont and Vandewalle [24] assumed the characteristic length to be 0.79hsp (hsp, prism effective depth) and the
strains were determined by dividing the crack width by two times the assumed characteristic length.
The French recommendation on FRC [25] calculates the strains by dividing the crack width by an assumed characteristic length equal to 2h/3. However, the determination of the value of h is not clearly defined in the recommendation.
The characteristic length (or the width of the fracture zone in a smeared tensile test) is defined by Bazant and Pijaudier-Cabot [26] as the ratio GF/WF. The surface
fracture energy, GF, expresses the energy absorbed to create
a unit crack area. WF represents the energy absorbed by a
volume of material during a smeared tensile test, where a high number of microcracks are created. Both the surface fracture energy and the volumetric fracture energy are determined from the complete area enclosed by the stress-displacement or stress-strain curves.
In this work, the tested VSF beam with 1.5% fibre ratio was analysed using ABAQUS FE-package [27]. Due to the symmetric boundary, only one half of the prism was analysed. The tension softening effect was modified using the stress-strain curve based on the RILEM design parameters provided in Table 1. Fig. 21 shows the distribution of the principal stresses at peak load. The position of the neutral axis is about 0.8hsp at a peak load of
Figure 21 Distribution of the principal stress.
A comparison of the load-deflection curves obtained experimentally and analytically, is shown in Fig. 22. The use of the RILEM stress-strain approach leads to an over estimation of the peak response. In addition, the FE-program was not able to converge after a deflection of 0.12 mm. The overestimation of the load-currying capacity highlights the deficiencies of the RILEM identified earlier and underlines the need for the development of more robust models.
Figure 22 Load-deflection behaviour (result of testing and FEA)
5. Conclusions
The SRSF and PRSF can form a viable alternative to commercially-available steel fibres for use in SFRC. The majority of steel fibre reinforced concrete specimens failed in flexure due to pull-out rather than yielding. The displacement controlled load application lead to stable results throughout the load history.
The equivalent flexural tensile strength for PRSF is slightly lower than that of VSF, due to the lower compressive strength and the black carbon on the PRSF surface. Both ISF prisms and VSF prisms are similar in behaviour. This indicates that cleaned PRSF fibres can be as effective as ISF fibres. Concrete prisms reinforced with 2% SRSF fibre behave similarly to prisms reinforced with 1.5% ISF fibres. SRSF concrete can be used in applications where a high resistance against micro cracking is required.
It is demonstrated here that the neutral axis depth of SFRC migrates with load and should differ for different types and amounts of steel fibres.
The equivalent hinge length of hsp/2 was shown to lead to reasonable results when converting displacement measurements to equivalent strains.
The load at limit of proportionality can not be accurately determined and its use can lead to erroneous estimation of
[image:18.595.47.282.280.418.2]accuracy and are better parameters for design. The values of the parameters feq,2 and fR,1 have great differences contrary
to feq,3 and fR,4.
A finite element analysis has shown that the stress-strain approach proposed by RILEM overestimates the peak response. A discussion on the characteristic length for determination of strain from crack width shows that there is a diversity of opinions among the researchers and this is also reflected in code equations.
6. Acknowledgements
The authors wish to acknowledge the Marie-Curie EU Community program “Improving Human Research Potential and the Socio-Economic Knowledge Base” under contract number HPMF-CT-2002-01825, the UK Government’s Department of Trade and Industry for the partners in Innovation project “Demonstrating steel fibres from waste tyres as reinforcement in concrete” (contract: CI 39/3/684, cc2227) and the University of Sheffield for their financial support.
7. References
1. European Commission, ‘Council Directive of 26 April 1999 on the landfill of waste’, Official Journal of the
European CommunitiesL182 (1999) 1-19.
2. Pilakoutas, K. and Strube R., ‘Reuse of tyre fibres in concrete’, Proceedings of the International Symposium on Recycling and Reuse of Used Tyres, Dundee, March 2001 (Thomas Telford Ltd, London, 2001) 225-236. 3. Tlemat, H., Pilakoutas, K. and Neocleous, K., ‘Pullout
behaviour of steel fibres recycled from used tyres’, Proceedings of International Symposia on Celebrating Concrete: People and Practice (in Role of Concrete in Sustainable Development), Dundee, Sept. 2003 (Thomas Telford Ltd, London, 2003) 175-184.
4. Tlemat, H., Pilakoutas, K. and Neocleous, K., ‘Flexural toughness of SFRC made with fibres extracted from tyres’, Proceedings of International Symposium on Advances in Waste Management and Recycling (in Recycling and Reuse of Waste Materials), Dundee, Sept. 2003 (Thomas Telford Ltd, London, 2003) 365-374.
5.
Tlemat H., ‘Steel fibres from waste tyres to concrete: Testing, modelling and design’. PhD thesis, (Dept. of Civil and Structural Engineering, The University of Sheffield, UK, 2004).6. RILEM TC 162-TDF, ‘Test and design methods for steel fibre reinforced concrete: bending test’, Materials and Structures 35 (253) (2002) 579-582.
7. RILEM TC 162-TDF, ‘Test and design methods for steel fibre reinforced concrete: σ-ε design method’,
Materials and Structures33 (226) (2000) 75-81.
8. RILEM TC 162-TDF, ‘Test and design methods for steel fibre reinforced concrete, σ-ε design method. Final recommendation’. Materials and Structures 36 (262) (2003) 560-567.
Industrial & Materials Technologies Programme (Brite-Euram II) (2002).
10. Timoshenko, S.P. and Goodier, J.N., ‘Theory of Elasticity’, 3rd Edn. (McGraw Hill, New York, 1970). 11. AMAT, ‘Advanced molecular agitation technology’,
(Internet Site: www.amat-ltd.com, 2003).
12. Japan Society of Civil Engineers, ‘Recommendation for design and construction of steel fibre reinforced concrete’, Concrete Library of JSCE VI (Article 15) (1994).
13. Copalaratnam, V.S. and Gettu, R., ‘On the characterisation of flexural toughness in FRC’, Cement Concrete Composites17 (1995) 249-254.
14. Japan Society of Civil Engineers-SF4, ‘Methods of tests for flexural strength and flexural toughness of steel fibre reinforced concrete’, Concrete Library of JSCE (1994) 58-61.
15. British Standards Institution, ‘BS 12 - British standard for concrete: method for determination of compressive strength of concrete cubes’, (British Standards Institute, London, 1996).
16. European Committee for Standardisation, ‘Eurocode 2 - EVV 1992-1-1- Design of concrete structures-Part 1: General rules and rules for buildings’, (British Standards Institute, London, 1992).
17. Ulfkjaer, J., Krenk, S. and Brincker, R., ‘Analytical model for fictitious crack propagation in concrete beam’. Journal of. Engineering Mechanics ASCE 121
(1) (1995) 7-15.
18. Olesen, J. F., ‘Fictitious crack propagation in fibre-reinforced concrete beams’, Journal of Engineering Mechanics ASCE127 (3) (2001) 272-280.
19. Schnuetgen, B. and Dams, S., ‚Stahlfaser im Tunnelbau’, Beton-informationen Heft 5-94 (Beton-Verlag, Duesseldor, 1994).
20. DVB, ‘Grundlagen zur Bemessung von Industriefussboeden aus Stahlfaserbeton, (Basis for evaluation of steel fibre concrete for use in industrial floors’, Deutschen Beton Vereins (1995) 258-272. 21. Barr, B. and Lee, M.K., ‘Definition of round robin test,
preparation of specimens, execution and evaluation of round Robin testing - report of subtasks 2.1 and 2.2’, Brite-Euram project BRPR-CT98-0813: Test and Design Methods for Steel Fibre Reinforced Concrete, Project funded by the European Community under the Industrial & Materials Technologies Programme (Brite-Euram II) (2002).
22. Hemmy, O., ‘Recommendations for finite element analysis of FRC - report of subtask 3.5’, Brite-Euram project BRPR-CT98-0813: Test and Design Methods for Steel Fibre Reinforced Concrete, Project funded by the European Community under the Industrial & Materials Technologies Programme (Brite-Euram II) (2002).
24. Dupont D. and Vandewalle, L., ‘A practical proposal to drive a stress-strain relation with residual tensile strengths – annex 5.1.3’, Brite-Euram project BRPR-CT98-0813: Test and Design Methods for Steel Fibre Reinforced Concrete, Project funded by the European Community under the Industrial & Materials Technologies Programme (Brite-Euram II) (2002).
25. Resplendino, J. and Petitjean, J. `French recommendations for ultra-high performance fibre-reinforced concretes`. Test and Design Methods for Steel Fibre Reinforced Concrete – Background and Experiences- Proceedings of the RILEM TC 162-TDF Workshop. Edited by B. Schnetgen and L. Vandewalle. Germany
26. Bazant, Z. P. and Pijaudier-Cabot, G., ‘Measurement of characteristic length of non-local continuum’, Journal of Engineering Mechanics (ASCE)115 (4) (1989) 755-767.