Cost of kWh produced and Payback Time of a
PV-Solar-Thermal-Combined Rooftop Collector at Different Locations in New Zealand
F. Kamel Abdalla1, Paul Wilson2
1 Leader Renewable Energy Research Laboratory (RERL)
2 Head of School of Electrical & Computer Engineering, Faculty of Applied Technology
Christchurch Polytechnic Institute of Technology (CPIT) P.O. Box 540 Christchurch 8032 NZ
E-mail: abdallaf@cpit.ac.nz and wilsonp@cpit.ac.nz
Presenter:
Cost of kWh produced and Payback Time of a
PV-Solar-Thermal-Combined Rooftop Collector at Different Locations in New Zealand
F. Kamel Abdalla1, Paul Wilson2
1Renewable Energy Research Laboratory (RERL)
2School of Electrical & Computer Engineering, Faculty of Applied Technology
Christchurch Polytechnic Institute of Technology (CPIT) P.O. Box 540 Christchurch 8032 NZ
E-mail: abdallaf@cpit.ac.nz and wilsonp@cpit.ac.nz
Abstract
The cost of the produced energy from an electric/thermal rooftop solar generator and the payback time is calculated for different geographic locations in New Zealand. The system consists of separate units of photovoltaic and thermal solar collectors suitable for a single household use. The operational data of an evacuated tube solar thermal collector and an average polycrystalline solar photovoltaic solar generator are taken as a basis for the calculation. The annual amount of energy produced and the resulting savings over the system lifetime are presented. The potential advantages provided by this comprehensive use of solar radiation are emphasised.
1. INTRODUCTION
It is most common in New Zealand for water and space to be heated directly by electricity. This situation is due to the fact that NZ has traditionally had an abundance of natural hydroelectricity produced, transmitted and distributed efficiently with minimal polluting effect. The energy consumption in water and space heating for domestic and industrial use is considered to account for 40 - 60 % of the total electricity energy consumption.
The recently released National Energy Efficiency and Conservation Strategy, ref. [1] announces a target to increase renewable energy supply to provide a further 25-55PJ/year (6,944–15,278 GWh/year) of consumer energy by 2012. The target represents a 19-42 percent increase over the current renewable energy supply. The renewable energy target is intended to give effect to the required progressive transition to renewable energy. This is in stark contrast to the recent history where over the last decade the market share of total consumer energy provided by renewables has declined to 29 percent (132 PJ = 36,667 GWh) in 2001.
lifetime and the payback time are presented.
2. THE MODEL
Operational data resulting from field measurements of an evacuated tube solar collector heater having a collector area of 1.37m2 tested at Christchurch as described in ref. [2] and the
[image:3.595.125.475.240.452.2]interpreted operation data of a 1 kWp-GC-PV system at different locations in NZ is applied to economic models in order to help assess the economic performance of the combined system. Figure 1 shows the average energy yield of the combined system and the average availability of solar radiation at Christchurch.
Monthly average Energy Yield of Solar System at Christchurch - NZ 1kWp GC-PV and 1.37 m2 solar Thermal - Total 1870 (kWh/year)
0 50 100 150 200 250 300
E
n
er
gy
Y
ie
ld
(
kWh)
GC-PV-ac (kWh) 141.4 109.8 89.9 60 39.37 29.4 33.48 51.77 76.2 111 130.8 145.4
Solar Thermal (kWh) 127.1 95.2 74.4 54 27.9 15 21.7 40.3 60 94.55 111 130.2
Total (kWh) 268.5 205 164.3 114 67.27 44.4 55.18 92.07 136.2 205.5 241.8 275.6
Mean Solar Radiation (kWh/m2 month) 188.5 146.2 119.7 80.1 52.39 39.3 44.64 68.82 101.7 148.2 174.3 193.8
Jan Feb Mar Apr May Jun Jul Aug Sep Oct Nov Dec
Figure 1. Average Energy yield/year of the proposed combined solar system and average availability of solar radiation at Christchurch
[image:3.595.88.517.594.685.2]The total model system cost interpreted according to present New Zealand market data is shown in Table 1.
Table 1: System Cost
Item No. Units Total cost range NZ $
PV module 1 8,000
Modules installation, Wiring & Cabling 1,500
Inverter (PCU) 700 W-ac 1 2,500
Evacuated tube solar thermal 1.37 m2unit 1 2,500
Total Initial Capital Investment 14,500
that of the solar thermal system results in the total reduction in the energy demand from the utility grid. Figure 2 shows the resulting electric energy savings for one-family household implementing the proposed combined solar system at Christchurch.
Electrical Energy Demand (kWh) of Average One-Family House At Christchurch
Total (kWh/year) 4736 Before and 2866 After
-100 0 100 200 300 400 500 600 700 800
E
ner
gy
D
em
and (
kW
h)
[image:4.595.122.473.130.324.2]Demand Before (kWh) 282 271 265 305 655 745 702 454 319 230 229 279 Demand After (kWh) 13.54 66.04 100.7 191 587.7 700.6 646.8 361.9 182.8 24.47 -12.8 3.41 Jan Feb Mar Apr May Jun Jul Aug Sep Oct Nov Dec
Figure 2. Realisable electric energy savings from the proposed solar system.
At other locations in New Zealand the energy yield of an identical system will vary according to the availability of solar radiation. It is expected that in northern parts of the country a considerable increase in energy yield could be achieved.
3. ECONOMIC ANALYSIS
The life-cycle analysis is used in order to evaluate the economic performance of the proposed solar system. The life-cycle cost of a solar system is its initial cost plus the lifetime cost of maintenance and operation discounted to the present time. The life-cycle benefit of the solar system is the total value of all the energy produced over the system lifetime similarly discounted to the present time. The methodology used in this report is comprehensively reported in ref. [3] and [4]. Costs and benefits for each operational year are projected and then discounted back to the year of installation to obtain the "present value". The present value of the benefits is then compared to the present value of the costs. In order to carry out the economic calculation the following assumptions are made:
r interest rate 7% p.a.
N lifetime of the system in year
t marginal tax bracket 0 % (no governmental subsidies) g savings escalator 0.10, i.e. 10% p.a.
CI Initial capital of investment in NZ$ are 12000 for GC-PV and 2500 for the thermal ETC
The total energy savings per year for the operation of the subject system in kWh/year and the average solar energy availability for different locations, as provided by NIWA, are summarised in Table 2.
Table 2: Average solar energy availability and forecasted energy production of a 1-kWp GC-PV and a 1.37m2 ETC solar heater at different locations in New Zealand
Auckland Wellington Christchurch Dunedin Total average solar
radiation (kWh/m2 year) 1575.33 1422.28 1357.56 1252.78
Total energy Yield (kWh/year)
GC-PV 1181.5 1066.7 1018. 7 939.58
ETC 999 878 851.3 759.13
Combined system GC-PV + ETC
2180.5 1944.7 1870 1698.7
The economic viability of the system will be determined by the comparison of costs to benefits. In the following the Net Present Value of Lifetime System Cost PVC and the Net Present Value of Lifetime System Benefit PVB will be calculated and compared.
3.1. Net Present Value of Lifetime System Cost
System cost includes the initial investment capital (CI) needed to acquire and install the system plus Insurance (TI) and Operation & Maintenance (OM+TI) Cost. The present value of lifetime system cost, PVC is given by:
PVC = CI +
CRF = Capital Recovery Factor
The Capital Recovery Factor (CRF) is used to discount future payments to the present and is expressed as:
CRF =
3.2. Net Present Value of Lifetime System Benefit
By using a constant rate to represent long-term escalation, it is possible to obtain the present value of the lifetime benefits (PVB) by multiplying the First Year Benefit X0 by a single
calculated parameter MB, the benefits present value multiplier, which can be accounted using
the following expression:
(OM+TI) x CI CRF
PVB = MB X0, M
g r - g
g
1+ r r g
N; r = g
B N = + − + ≠ 1
1 1 ;
3.3. Payback time
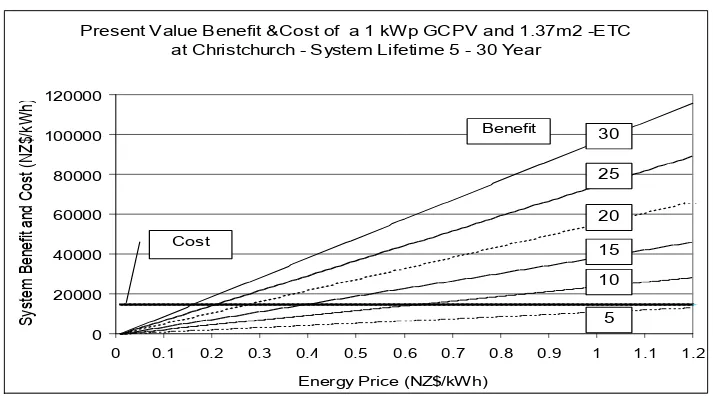
Usually the payback time is computed as the time at which first cost and annual expenses with compounded interest equal the total savings of energy cost with compounded interest, ref. [5]. Figure 3 shows the present value of the cost and benefit of the subject combined system at Christchurch showing the point of intersection where the costs equal the benefits for different system lifetime of 5 – 30 years. The relation describing the payback time of the proposed combined system for different energy prices at different locations in New Zealand is presented in Figure 4. The same relationship for the grid connected photovoltaic system without combination with the solar thermal unit is presented in Figure 5 while Figure 6 shows the relationship regarding the solar thermal unit without the GC-PV.
Present Value Benefit &Cost of a 1 kWp GCPV and 1.37m2 -ETC at Christchurch - System Lifetime 5 - 30 Year
0 20000 40000 60000 80000 100000 120000
0 0.1 0.2 0.3 0.4 0.5 0.6 0.7 0.8 0.9 1 1.1 1.2
Energy Price (NZ$/kWh)
[image:6.595.119.476.371.570.2]Sy st em B enef it a nd C os t ( N Z$ /k W h) Cost Benefit 30 25 20 15 5 10
System Pay-Back Time vs. Energy Price
of a 1 kWp GCPV combined with a 1.37 Evacuated Tube Solar Collector at different locations, New Zealand
5 10 15 20 25 30
0.1 0.2 0.3 0.4 0.5 0.6 0.7 0.8 0.9 1 1.1 1.2 1.3 1.4 1.5 1.6 Energy Price (NZ$/kWh)
Sy
st
e
m
Pa
y-Ba
ck
T
im
e (
ye
ar
) Dunedin
Christchurch Wellington Auckland
Fig. 4 Payback time of the combined system vs. present energy price.
System Pay-Back Time vs. Energy Price of a 1 kWp GCPV at different locations, New Zealand
5 10 15 20 25 30
0.1 0.2 0.3 0.4 0.5 0.6 0.7 0.8 0.9 1 1.1 1.2 1.3 1.4 1.5 1.6 Energy Price (NZ$/kWh)
Sy
st
em
Pa
y-Ba
ck
T
im
e (
ye
ar
)
[image:7.595.147.450.72.317.2]Dunedin Christchurch Wellington Auckland
System Pay-Back Time vs. Energy Price
of a 1.37 Evacuated Tube Solar Collector at different locations, New Zealand
5 10 15 20 25 30
0.1 0.2 0.3 0.4 0.5 0.6 0.7 0.8 0.9 1 1.1 1.2 1.3 1.4 1.5 1.6 Energy Price (NZ$/kWh)
Sys
te
m
Pa
y-Ba
ck
T
im
e (
ye
ar
)
Dunedin Christchurch Wellington Auckland
Fig. 6 Payback time of the Evacuated Tube Solar Collector vs. present energy price. The calculations show that as expected the combination of the GC-PV system with a solar thermal unit improves the economics of the whole system and reduces the payback time. Solar favourable locations such as Auckland demonstrate shorter payback time and hence better economics for the technology.
Based on a current averaged price of 18c per kWh, the payback time for a combined system is approximately 25 years. If the price should rise beyond this, and there is no reason to suspect it will not do so, the payback time is a little as ten years (in Auckland) at an electricity price of 50c per kWh. If purely economic rationale is used there is little economic benefit, based on current costs, in this form of renewable energy supply. If a wider picture is taken and some of the intangible benefits, not discussed in this paper, are also considered, then in terms of social and environmental payback these systems may prove to be more attractive.
4. CONCLUSIONS
The analysis presented in this paper for a combined solar installation including GC-PV and solar thermal units at a typical domestic house has shown that such a system will present realisable benefits in each of the four main population centres in New Zealand compared to simple GC-PV systems operated separately.
With the current uncertainties surrounding future electricity pricing and the requirements for a move to an increased use of renewable energies, the time has never been more opportune for an increased uptake of such systems in New Zealand.
5. REFERENCES
1. New Zealand National Energy Efficiency and Conservation Strategy (Oct. 2001), Energy Efficiency and Conservation Authority EECA website www.eeca.govt.nz
Water Heater, Paper presented to Conference. ISES 2001 Solar World Congress, Adelaide, Australia 25 Nov. -2 Dec. 2001
3. Doane J.W., O’Toole R.P., Chamberlain R.G., Bos P.B. and Maycock P.D., The Cost Of Energy From Utility-Owned Solar Electric Systems, JPL 5040-29 ERDA /JPL/1012-76/3 Report June 1976
4. Mierzejewski T., Economic Analysis For Residential / Commercial Photovoltaic Systems Intertied With New Zealand Electricity Networks, NZ Energy Efficiency and Conservation Authority EECA