Gate-keeping Into the Knowledge Society: Have
We Got it Right?
Jay Somasundaram*, Don Bowser^, and P.A. Danaher
#*Office of the Executive Director (Corporate Services), Central
Queensland University, Rockhampton, Australia. ^Division of
Teaching & Learning Services, Central Queensland University,
Rockhampton, Australia.
#Faculty of Education and Centre for
Re-search in Transformative Pedagogies, University of Southern
Queensland, Toowoomba, Australia
[email protected]
[email protected]
[email protected]
Abstract
University admission is generally a competitive process, with more applicants seeking entry to programs than places available. The undergraduate selection process typically requires the processing of large numbers of students, and the process needs to be transparent and effi-cient. Usually admission is primarily, if not solely, based on grades, obtained at school and/or in an external exam. Existing studies indicate that admission grades, while the strongest pre-dictor currently available, are at best able to predict approximately 40% of the subsequent university grades (Adelman, 1999).
This paper reports on the correlation between the grades used for admission and their subse-quent university grades for approximately 7000 students admitted between 2003 and 2005 to a particular Queensland university in Australia. The paper reports that there are significant differences in the correlation between these grades and subsequent university performance across disciplines. Engineering and the physical sciences, for example, have a higher correla-tion than the social sciences. In addicorrela-tion, Queensland’s school certificate provides supple-mentary measures of five generic skills. The paper also examines the value of these meas-ures in predicting university performance.
University graduates are arguably the lynch-pins of a knowledge society. Selection methods must be good predictors of success at university and also continuation in careers that deliver optimum benefits for both the individual and the society that subsidised their study. The paper concludes that, while purely grades based admission is transparent and efficient for a univer-sity, it may not be particularly fair or effective.
Keywords: Admissions policy, Ethics
Introduction
A university degree is now considered a pre-requisite for participation in a knowledge society. The process for selecting students for university “reflects the complex political, social and economic features of [that] country” (Andrich & Mercer, 1997, p. ix). In Queensland, Australia,
the Queensland Studies Authority (QSA) (website: www.qsa.qld.au) is a statutory body
re-sponsible for a range of educational services including syllabus, assessment, moderation and accreditation at the school level.
dur-ing their schooldur-ing. There is a sophisticated moderation process to standardise the grades received across classes, subjects and schools.
Another set of scores, know as Field Positions (FPs), is also reported. FPs range from 1 (highest) to 10. There are five fields:
Field A: extended written expression involving complex analysis and synthesis of ideas;
Field B: short written communication involving reading, comprehension and expression in
English or a foreign language;
Field C: basic numeracy involving simple calculations and graphical and tabular
interpre-tation;
Field D: solving complex problems involving mathematical symbols and abstractions;
Field E: substantial practical performance involving physical or creative arts or expressive
skills.
Different subjects have different FP weightings and, if a student’s subject choice is such that the total weight is above a threshold, then the student’s grade for that FP is calculated from the grades for the relevant subjects and reported. The majority of students receive three or four FP grades.
Admission to domestic undergraduate courses in Queensland universities is coordinated
through the Queensland Tertiary Admissions Centre (QTAC) (website: www.qtac.edu.au).
Nevertheless, admission policy and actual admissions are made by individual universities and faculties. A sound achievement in English is a pre-requisite for many programs. Other pro-grams may require mathematics or chemistry. However, the principal cut-off mechanism is a single score, the Tertiary Entrance Rank (TER). For students with an OP, there is a straight translation: an OP of 1 equals a TER of 99, and an OP of 25 corresponds to a TER of 50. Stu-dents with other qualifications, such as those with vocational training or high school graduates from other states, are given TERs calculated by QTAC.
In deciding among students with the same OP, some universities use their FPs. A few high-demand or specialised courses require an interview or the presentation of a portfolio. Medi-cine and dentistry generally also consider the student’s grade in a special nation-wide test, the Undergraduate Medicine and Health Science Admissions Test.
Nevertheless, admission based solely on previous academic performance remains the norm rather than the exception. The process is transparent – universities cannot be accused of bias or have their decisions easily challenged. The process is also efficient for universities, and a large number of admission decisions can be made without tying up staff in some form of evaluation.
Undergraduate students in Australian universities are classified into two broad groups: do-mestic and international. Dodo-mestic students are Australian citizens, Australian permanent residents and New Zealand citizens. International students are students from other countries. The Australian Commonwealth (federal) government subsidises approximately 450,000 (Aus-tralian Vice Chancellors Committee, 2005, Table c5) Commonwealth Supported Places (CSPs) a year, distributed among Australian universities, for domestic students. Universities may also enrol a limited number of domestic students and an unlimited number of interna-tional students who pay full fees. Domestic full fee paying students are those who could not get a CSP in their program/university of choice. The cohort studied by this paper consists en-tirely of domestic CSP students.
Undergraduate study is broadly similar across different Australian universities, but with slightly different terminology. This paper uses the terminology of the university at which the cohort being studied was enrolled. Undergraduates enrol in one or more courses in a term. There are two major terms, and typically four courses in a term are considered a full load. However, a substantial number of students study in more than two terms each year.
Literature Review
sum-mary of the range of international practices. Pascoe, McClelland and McGaw’s (1997) subse-quent report focused solely on Australia. Both are freely available on the web.
Andrich and Mercer (1997) report that “Little direct information on the reliability of prediction was found. However, there is again evidence that previous relevant performance is the best predictor” (p. 8). Of interest are data from the Netherlands, showing that students with lower entrance examination scores take on average longer to complete their first year requirements. 96% of students with an entrance examination average mark above 8.5 completed their first year’s requirements in 12 months, compared to 15% of students with a tertiary entrance score below 6.4.
In the United States, the measure of a high school student’s academic performance is her or his High School Grade Point Average (HSGPA). However, there is no overarching mecha-nism to ensure that the HSGPA from different schools are consistent or comparable. Universi-ties therefore, while using the HSGPA, generally require the students to take an independent test, the most common of which is the Scholastic Achievement Test (SAT), organised by a non-profit consortium set up by a group of educational institutions.
Reported US studies are reasonably consistent. For example, Bridgeman, Jenkins and Ervin (1999) report a coefficient of correlation of 0.54 between the HSGPA and the College Grade Point Average (CGPA) and 0.52 between the SAT and the CGPA, which rises to 0.61 when both the SAT and HSGPA are combined and correlated with the CGPA (Table 1, p. 17).
In the United Kingdom, Boyle, Carter and Clark (2002) comment that “There is much aca-demic hearsay and gossip that school level qualifications provide a poor indicator of eventual university performance” (p. 1). Their study of computing science students at two universities reports the correlation between entry score and first year average grades as 0.55 and 0.24, dropping to 0.32 and 0.17 in the third year.
In Australia, Vialle and Halle (1996) studied the relationship between the Victorian Tertiary Entrance Rank (VTE) (equivalent to Queensland’s TER) and university grades (first year GPA) across different disciplines. They reported correlation coefficients ranging from a high of 0.551 in Engineering to a low of 0.262 for Health Sciences. They also reported correlation coefficients between the VTE and the GPA in subsequent years. There was a gradual reduc-tion in the coefficient correlareduc-tion in most disciplines, though this is by no means consistent.
McKenzie and Schweitzer (2001), in studying factors predicting academic performance in a cohort of first year Queensland students in the faculties of Science and Information Technol-ogy, reported that the university entry score accounted for 39% of the variance in the GPA (i.e., a correlation coefficient of 0.62).
Method and Results
The study examined the records of students who gained admission to a single Queensland university between 2003 and 2005 through QTAC. The university to which this study relates serves a domestic student catchment area in regional Queensland. The area is roughly the size of California, but with a population of only about 330,000. It has a high number of dis-tance education and part-time students included in the cohort.
All admission records were obtained for the period. Where a student had multiple admission records, the last record was used. There were 7,708 students: 29% with OPs; 66% non-OP students with a TER; and 5% admitted under special consideration (e.g., on the basis of an artistic portfolio or a recommendation). The latter students are not significantly analysed in this paper as no range of entrance scores was available.
Nearly all the OP students are between 16 and 19 years old. About half the other students are less than 24. Just over 60% of students were female. The percentage of students in each TER decile (OP students reported to the TER equivalent) is given in Table 1.
The admission records were matched with course records to identify those students who had enrolled in one or more subsequent courses in these three years. Students are given letter grades at the university. The database had 21 types of grades recorded. Approximately 1.4% of the grades recorded were not specified in the university’s
grad-Table 1: Entrance Grades
TER OP % Non-OP %
49 - 59 6% 2%
60 - 69 27% 11%
70 - 79 27% 22%
80 - 89 26% 45%
ing policy, and a further 0.6% indicated that the grades had not been finalised. Eliminating these two groups left a total of 76,996 course records. Numerical values were assigned to the
letter grades as outlined in Table 2 for correlation calculations.
The Australian Standard Classification of Educa-tion (Trewin, 2001) is a method of categorising different fields of study published by Standards Australia. The coding structure has three hier-archical levels: broad fields of education, nar-row fields and detailed fields. There are 12 broad fields (hereinafter called “disciplines”), and this paper groups the courses offered by the university to these 12 disciplines. No courses were classified as Field 12, Mixed Field Programmes. Only one course, with six students, was classified to Field 11, “Food Hospitality and Personal Service”. Therefore our analysis was based on 10 disciplines (Table 3).
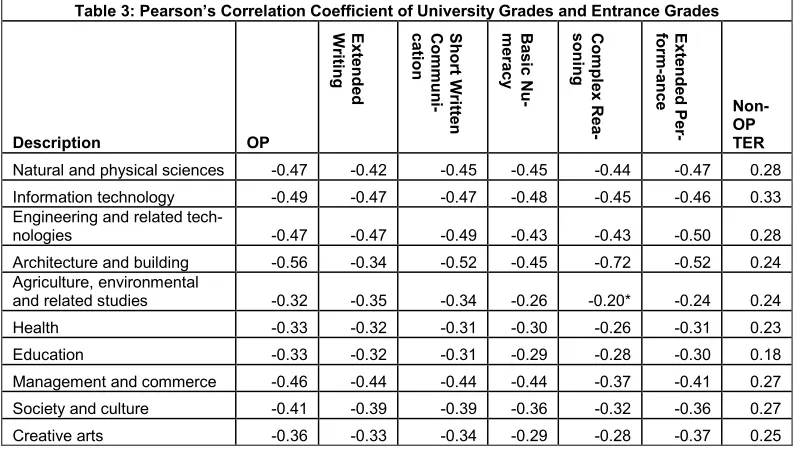
Pearson’s coefficient of linear correlation was calculated for each of the disciplines. Correla-tions were calculated between university grades and (i) OPs (ii) TERs of students without OPs and (iii) the FPs of students with OPs. The data indicate a significant linear relationship at the 99% confidence level, except for the relationship between complex reasoning and uni-versity grades in agriculture and related studies(*), where the confidence level is 95%.
As expected from other research, the correlation between OP and university grades was strongest in those disciplines most closely linked to mathematics and the physical sciences. The highest correlation, 55%, was found in Architecture and Building, with the sciences, in-formation technology, engineering and management and commerce having scores in the mid 40s. The lowest were in Agriculture and environmental studies, health and education, all in the low 30s (Table 3).
Table 3: Pearson’s Correlation Coefficient of University Grades and Entrance Grades
Description OP
E x te n d e d W ri tin g S h o rt W ri tt e n C o m m u n i-c a tio n B a s ic N u -m e ra c y C o m p le x R e a -s o n in g E x te n d e d P e r-fo rm -a n c e Non-OP TER
Natural and physical sciences -0.47 -0.42 -0.45 -0.45 -0.44 -0.47 0.28
Information technology -0.49 -0.47 -0.47 -0.48 -0.45 -0.46 0.33 Engineering and related
tech-nologies -0.47 -0.47 -0.49 -0.43 -0.43 -0.50 0.28
Architecture and building -0.56 -0.34 -0.52 -0.45 -0.72 -0.52 0.24 Agriculture, environmental
and related studies -0.32 -0.35 -0.34 -0.26 -0.20* -0.24 0.24
Health -0.33 -0.32 -0.31 -0.30 -0.26 -0.31 0.23
Education -0.33 -0.32 -0.31 -0.29 -0.28 -0.30 0.18
Management and commerce -0.46 -0.44 -0.44 -0.44 -0.37 -0.41 0.27 Society and culture -0.41 -0.39 -0.39 -0.36 -0.32 -0.36 0.27
Creative arts -0.36 -0.33 -0.34 -0.29 -0.28 -0.37 0.25
A coefficient of 0.45 gives a coefficient of determination (r2) of 0.20, which is interpreted as
meaning that 20% of the university grade is predictable by OP. A coefficient of 0.32 gives a variance of 0.10, implying that 10% of the university grade is predictable by OP. The coeffi-cient of correlation of non-OP students is significantly and uniformly lower, though of a similar pattern.
[image:4.595.89.489.434.660.2]An examination of the correlations for the FPs (skill groups) and OP reported in Table 4 shows that, in general, the numbers are quite similar for any disciple group. An examination of the correlation between OP and the FPs shows very high correlation, between .90 and .94,
Table 2: Student Grades
Grade Description Value As-signed
%
High Distinction 4 10
Distinction 3 22
Credit 2 25
Pass in a course without grades (i.e., student either passes or fails)
2 06
Pass 1 18
Marginal Pass (e.g., supplementary exam) 1 01
suggesting that the FP scores may be in general too closely linked to the OP to provide sub-stantially new information for university selection. There is a significantly higher correlation (0.72) between complex reasoning scores and university grades for architecture and building.
Table 4: Correlation of FPs with OP Extended Writing Short Writen Communiction Basic Nmeracy Complex Reasoning Extended Performance Correlation
with OP 0.90 0.92 0.92 0.91 0.94
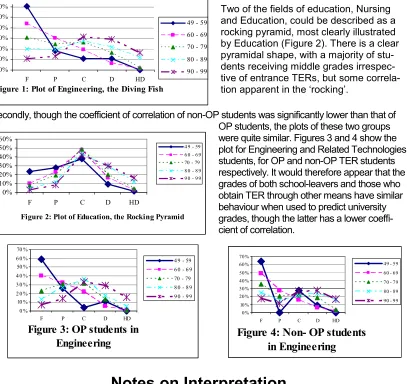
A plot of the students’ TER decile with their university grades gave two unexpected results. Firstly, two distinct types of patterns emerged. The majority of fields of education (disciplines) had what could be described as a diving fish, most clearly illustrated by Engineering and Re-lated Technologies (Figure 1). The tail of students who failed their course shows high varia-tions, with low-TER students failing most often, students in the next TER band failing less of-ten and the students in the highest TER, failing the least ofof-ten. The highest band of students then moved to draw the top of the fish, with the majority receiving credits and distinctions, with proportions reducing for high distinctions.
Two of the fields of education, Nursing and Education, could be described as a rocking pyramid, most clearly illustrated by Education (Figure 2). There is a clear pyramidal shape, with a majority of stu-dents receiving middle grades irrespec-tive of entrance TERs, but some correla-tion apparent in the ‘rocking’.
Secondly, though the coefficient of correlation of non-OP students was significantly lower than that of OP students, the plots of these two groups were quite similar. Figures 3 and 4 show the plot for Engineering and Related Technologies students, for OP and non-OP TER students respectively. It would therefore appear that the grades of both school-leavers and those who obtain TER through other means have similar behaviour when used to predict university grades, though the latter has a lower coeffi-cient of correlation.
Figure 3: OP students in
Engineering
0 % 10 % 2 0 % 3 0 % 4 0 % 50 % 6 0 % 70 %
F P C D HD
4 9 - 59 6 0 - 6 9 70 - 79 8 0 - 8 9 9 0 - 9 9
Notes on Interpretation
[image:5.595.99.506.270.654.2]Cohen (1988) points out that in the physical sciences variables can be controlled and more precisely measured, while in the social sciences important variables are often poorly under-stood, difficult to measure and impossible to exclude. He therefore suggests that correlations above 0.5 are quite respectable. We argue, however, that even a coefficient of correlation of 0.65 corresponds to a variance of 0.4, meaning that 60% of the variance is from other sources. We cannot be satisfied with such a degree of accuracy, particularly since the deci-sion to admit or not to admit has such an important effect on the student.
Figure 1: Plot of Engineering, the Diving Fish 0% 10% 20% 30% 40% 50% 60%
F P C D HD
49 - 59 60 - 69 70 - 79 80 - 89 90 - 99
Figure 2: Plot of Education, the Rocking Pyramid
0% 10% 20% 30% 40% 50% 60%
F P C D HD
4 9 - 59 6 0 - 6 9 70 - 79 8 0 - 8 9 9 0 - 9 9
Figure 4: Non- OP students
in Engineering
0% 10% 20% 30% 40% 50% 60% 70%F P C D HD
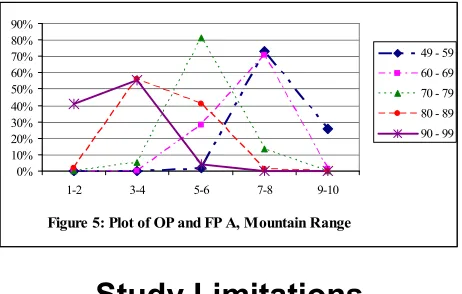
To appreciate better the plots of TER deciles, we give below the graph for variables with a strong correlation, that between OP (as expressed as TER deciles) and FP A (Extended Writ-ing), which had a correlation of 0.90. It shows each of the TER deciles with a strong triangular
[image:6.595.183.414.125.272.2]shape but with the apexes in adjacent bands, similar to a mountain range (Figure 5).
Figure 5: Plot of OP and FP A, Mountain Range 0%
10% 20% 30% 40% 50% 60% 70% 80% 90%
1-2 3-4 5-6 7-8 9-10
49 - 59 60 - 69 70 - 79 80 - 89 90 - 99
Study Limitations
Though it relates to a relatively large cohort, this study is only of students who entered one university. Furthermore, confounding factors such as those studying part-time and through the distance mode were not accounted for.
As in any large data studies, a certain amount of cleaning and rationalisation had to be done, and these are all discussed in this paper. The authors do not believe that any were such as to affect significantly the conclusions of the paper. However, it should be noted that 6% of the students passed in courses that were not graded (i.e., they either passed or failed). This grade was equated to a credit. The majority of these courses were in the Education discipline. This grading accentuates the pyramid shape described in this paper, but the shape is still ap-parent if these grades are removed.
Many subjects may fall into more than one discipline (field of education). For example, the course “Legal Issues in Nursing” could be classified as Society and Culture (Law) or Health (Nursing). The classification decided upon affects funding, and therefore academic logic is probably spiced with a pinch of pragmatism.
Discussion
There is a significant linear correlation between entrance scores and subsequent university grades. This correlation is higher for school-leavers than for those gaining entrance through other means. The correlation varies by field of education.
When plotting entrance score deciles against university grades, two patterns emerge for the disciplines. The more common, similar to a diving fish, shows a relatively high failure rate for students in the lower decile entrance scores. The second pattern, similar to a rocking pyra-mid, shows relatively low failure rates even among the lower TER deciles. This may indicate two cultures, what Simpson (2003) has labelled the “survivalist” and the “remedialist” cultures.
The plot of entrance scores against deciles indicates that the pattern of achievement for OP and non-OP students is quite similar. The correlation between entrance ranks and subse-quent university grades would suggest that the former is a poor predictor of the latter, being able to explain only up to 20% of the variance in university grades. Nevertheless, students with very poor entrance scores are much more likely to perform poorly at university in most disciplines.
Of concern is the relatively flat performance of students in the highest decile of TERs. This may either suggest that the entrance rank is not a good predictor of high performance at uni-versity or that the uniuni-versity is not challenging its most capable students.
Systems Perspective
An analysis of the question “Whom do we want to select to enter university?” suggests a range of possible answers:
1. Those who deserve the reward of university study, having worked the hardest to gain it;
2. Those who will succeed most at university;
3. Those who will gain most from a university education; and/or
4. Those whose education will deliver the most to society.
Though these answers are not necessarily mutually exclusive, they do have subtle differ-ences. We suggest that they represent different stages of maturity in selection processes, and that we are, by and large, operating a method that is designed to deliver for the first stage.
This paper shows that selecting students on the basis of their entrance scores is somewhat of a hit and miss affair in terms of its ability to predict university grades. This is particularly true with higher cut-off scores.
The third level adds two subtle differences. Firstly, it takes an external approach, suggesting that what matters is not university grades but success (however success is defined) outside university. Secondly, it suggests that, if two candidates achieve equivalent success, then uni-versities should select the candidate who enters from a lower point. It also puts pressure on universities, rather than simply teaching curricula, to identify those skills and competencies that most add value, and to teach them.
Conclusion
We live in a knowledge society, where university degrees are the admission tickets that pre-scribe the type of seats one gets. Deciding who is granted admission to what program needs to be done well, from both an ethical perspective and the perspective of public good.
Selecting university students purely on school-leaving academic qualifications is both eco-nomical and transparent. However, as this paper and others show, only at most 40% of a stu-dent’s university grades can be predicted by a school-level qualification, and even this only for some academic disciplines. Our research suggests that different disciplines adopt different teaching strategies, and these may make traditional selection methods even less relevant. Furthermore, the massification of higher education is opening up universities to non-traditional students. Our data suggest that the predictability of non-traditional students’ university grades may be lower but of a similar pattern.
The true success of our students is not in their university grades, but in the value they add to society 10 to 20 years after they leave our influence. What matters most is what works best, for our society and for our students, those who are admitted to university as well as those who are refused. The answers to how to get university selection right is complex and situated, and requires much further research and debate. The transformation of higher education for the knowledge society is likely to require the transformation of our selection processes, and we need to attend to this transformation with a balance of sound science and ethics.
References
Adelman, C. (1999). Answers in the tool box: Academic intensity, attendance patterns, and bachelor's degree attainment. Washington, DC: United States Department of Education. Retrieved April 11, 2006, from http://www.ed.gov/pubs/Toolbox/index.html
Andrich, D., & Mercer, A. (1997). International perspectives on selection methods of entry into higher education. Canberra, ACT: Australian Government Publishing Service. Retrieved 14 May, 2006, from
http://www.dest.gov.au/NR/rdonlyres/482AC5E6-E67D-4790-9F85-FC9F615EAE26/3950/97_10.pdf
Australian Vice Chancellors Committee. (2005). Key statistics – students. Canberra, ACT: Author. Retrieved April 11, 2005, from
http://www.avcc.edu.au/content.asp?page=/publications/stats/students.htm
Boyle, R., Carter, J., & Clark, M. (2002). What makes them succeed? Entry, progression and graduation in computer science. Journal of Further and Higher Education, 26(1).
Bridgeman, B, Jenkins, L., & Ervin, N. (1999). Variation in the prediction of college grades across gender within ethnic groups at different selectivity levels. Paper presented at the annual conference of the American Education Research Association. Montreal, Canada.
Cohen, J. (1988). Statistical power analysis for the behavioral sciences (2nd ed.). Hillsdale, NJ: Lawrence Erlbaum Associates.
Danaher, P. A., Bowser, D. R., & Somasundaram, J., (under review). The student departure puzzle: Do some faculties and programs have answers? Submitted to Higher Education Research &
Development.
McKenzie, K., & Schweitzer, R. (2001). Who succeeds at university? Factors predicting academic performance in first year Australian university students. Higher Education Research & Development, 20(1).
Pascoe, R., McClelland, A., & McGaw, B. (1997). Perspectives on selection methods for entry into higher education in Australia. Canberra, ACT: Australian Government Publishing Service. Retrieved 14 May, 2006, from
http://www.dest.gov.au/NR/rdonlyres/37F1B0B3-7F8C-4011-A502-E68E94358211/3952/97_18.pdf
Simpson, O. P. (2003, November 5-7). Mature student retention - the case of the UK Open University. Paper presented at the international student retention conference, Amsterdam, The Netherlands. Trewin, D. (2001). Australian Standard Classification of Education (ASCED). Canberra, ACT: Australian
Bureau of Statistics. Retrieved April 3, 2006, from
http://www.abs.gov.au/ausstats/[email protected]/be4aa82cd8cf7f07ca2570d60018da27/c5696493783187 caca256aaf001fcac6/$FILE/ATT7EZVM/12720_2001.pdf