BONE MINERAL DENSITY AND BONE
TURNOVER MARKERS IN HEALTHY PRE
AND POSTMENOPAUSAL WOMEN AND
THE INFLUENCE OF MULTIPLE FACTORS
ON THEM
Dissertation submitted to the
The Tamil Nadu Dr. MGR Medical University,
Tamil Nadu
in partial fulfillment of the rules and regulations for the degree of
DM Endocrinology examination to be held in August 2015,
BONE MINERAL DENSITY AND BONE
TURNOVER MARKERS IN HEALTHY PRE AND
POSTMENOPAUSAL WOMEN AND THE
INFLUENCE OF MULTIPLE FACTORS ON THEM
by
Dr. Sahana Shetty
D i s s e r t a t i o n s u b m i t t e d t o
THE TAMIL NADU DR. MGR MEDICAL UNIVERSITY,
In partial fulfillment of the requirements for the degree of
DM in ENDOCRINOLOGY
Under the Guidance of
Prof. Thomas V Paul
Co-Guidance of
Prof. Nihal Thomas
DECLARATION
I hereby declare that this dissertation titled “Bone Mineral Density and Bone
Turnover Markers in Healthy Pre and Postmenopausal Women and the influence
of multiple factors on them” was carried out by me under the direct supervision and
guidance of Prof. Thomas V Paul and co-guidance of Prof. Nihal Thomas, Professor and
Head, Department of Endocrinology, Diabetes & Metabolism, Christian Medical
College, Vellore.
This dissertation is submitted to The Tamil Nadu Dr. MGR Medical University, in
partial fulfillment of the requirements for the degree of DM in Endocrinology.
I also declare that this dissertation has not been submitted by me to any other university
or for the award of any other degree.
Vellore
CERTIFICATE
This is to certify that this research work titled“Bone Mineral Density and Bone
Turnover Markers in Healthy Pre and Postmenopausal Women and the influence
of multiple factors on them” was done by Dr. Sahana Shetty, DM in Endocrinology,
Christian Medical College, Vellore.
This study was undertaken in the Department of Endocrinology, Diabetes and
Metabolism, Christian Medical College, under my direct supervision, guidance and
to my complete satisfaction, as a part of the requirement for the award of the degree
DM in Endocrinology.
Dr. Thomas V Paul, MBBS, MD(Gen Med), DNB(Endo), PhD(Endo), Professor & Guide,
Department of Endocrinology, Diabetes & Metabolism, Christian Medical College, Vellore – 632 004.
Dr. Nihal Thomas,
MBBS, MD, MNAMS, DNB(Endo), FRACP(Endo), FRCP(Edin), FRCP(Glasg), Professor & Head,
Co-Guide,
CERTIFICATE
This is to certify that this research work titled “Bone Mineral Density and Bone
Turnover Markers in Healthy Pre and Postmenopausal Women and the influence
of multiple factors on them” was done by Dr. Sahana Shetty, DM in Endocrinology,
Christian Medical College, under the guidance of Professor Thomas V Paul and
co-guidance of Professor Nihal Thomas, Professor and Head, Department of
Endocrinology, Diabetes & Metabolism, Christian Medical College, as a part of the
requirement for the award of the degree DM in Endocrinology.
Professor Alfred Job Daniel, MBBS,D.Ortho, DNB(Ortho), MS(Ortho), Principal,
Acknowledgement
Expression of gratitude and thankfulness in words is a rare opportunity one can avail. Penning down this acknowledgement, I take the opportunity to express my gratitude to my mentors, colleagues, family and friends, who helped me accomplish this task that seemed prodigious but ended as a gratifying journey.
Words won’t suffice to express my thankfulness to my guide and mentor for this research venture, Dr. Thomas V Paul, Professor, Department of Endocrinology, Christian Medical College, Vellore. I thank him for his exceptionally versatile guidance, valuable suggestions, critical appreciation and keen interest that led to successful compilation of this thesis. I deeply admire the freedom of expression and thought that I was given while working under him, which helped me redefine my approach towards all aspects of life. I am much indebted to my co-guide Dr. Nihal Thomas, Professor and Head, Department of Endocrinology, Christian Medical College, Vellore for his guidance, support and suggestions. His unflinching courage, prudence and conviction for accomplishing any task will always inspire me. I thank him for his considerate help and solace throughout.
I take this opportunity to thank Dr. Simon Rajaratnam, Dr. H.S. Asha, Dr. Dukhabandhu Naik and Dr D.M. Mahesh, Department of Endocrinology, Christian
Medical College, Vellore, for their encouragement, guidance and kind support.
A special thanks to Dr. Nitin Kapoor, Department of Endocrinology, Christian Medical College, Vellore for his concern, help and motivation for executing this study.
I would like to thank Dr. Joe Fleming, Dr. Victoria and Mr. Joseph, Department of Clinical Biochemistry, Christian Medical College, Vellore for their help in rapid processing of the samples and for their kind co-operation throughout the study.
A special thanks to all my Colleagues of Department of Endocrinology, Christian Medical College, Vellore for their cooperation and enthusiastic help during the time of study tenure.
Very special thanks to Ms Banu, for her utmost help throughout the study from recruiting the subjects to formulating this thesis with utmost dedication and sincerity and for all the care and affection during my study period.
My appreciation also goes to Mr. Kali, Mr.Thanigachalam, Mr.Magesh, Mr. Mohan,
and Mrs.Sudha for their cooperation and enthusiastic help during recruitment of subjects,
sample collection and for always being amenable, whenever I needed their help.
My special thanks to all staff members, Department of Endocrinology, Christian Medical College, Vellore for their cooperation during the period of my research.
I take this opportunity to sincerely acknowledge CMC Fluid Research for providing financial assistance that helped me to perform my work comfortably.
No choice of words would suffice to adequately register my love and gratitude to my
Parents. I thank them for their unconditional love, support and care. I take this moment
to promise them that I would always keep up their faith in me. I also take this opportunity to express my admiration for my brother, who has always been my strength to fall back on. It is impossible to express thanks in any words to my husband Dr RaghavendraNayak, who has been my confidence and kept me strong through all odds. I thank him for his encouragement to perform my best at each step.
Most importantly, I owe my gratitude to all the subjects who consented to be a part of my study and made this work possible.
Last but not the least; I bow in gratitude to Almighty who has always blessed me with his choicest bounties. I thank Him for always guiding me through this endeavour.
All may not be mentioned, but no one is forgotten.
TABLE
OF
CONTENTS
S.No.
Contents
Page number
1.
Introduction
1
2.
Aims and Objectives
6
3.
Review of Literature
7
4.
Materials and Methods
40
5.
Results
52
6.
Discussion
75
7.
Conclusions
85
8.
Recommendations
87
9.
Bibliography
i-xvi
10.
Annexure-I
i-vii
11.
Annexure-II
viii-xiii
12.
Annexure-III
xiv
13.
Annexure-IV
xiv-xix
LIST O F FI GURES
Figure no.
Contents Page
No. 1. The influence of peak bone mass and rate of bone loss on BMD with age. 3
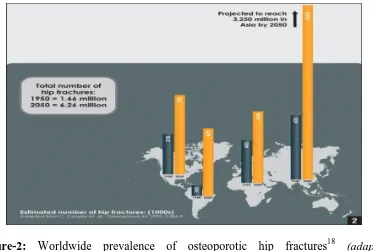
2. Worldwide prevalence of osteoporotic hip fractures18 10
3. Role of peak bone mass on fracture risk 16
4. Prevalence of vitaminD deficiency across the globe 17
5. Life style factors affecting bone health and other risk factors 20
6. BTMs in different phases of bone remodelling 25
7. Meta- analysis showing the effect of calcium and calcium with vitamin D combination on the fracture risk.
38
8. Modified Kuppuswamy’s socioeconomic scale 42
9. Physical activity assessment using IPAQ 43
10. A. Flowchart showing the recruitment protocol
B. Recruitment area – Velapadi area of Vellore district, Tamil Nadu, India
49 49
11. Recruitment of study subjects 52
12. Socioeconomic stratification of subjects using kuppuswamy classification 55
13. Categorization of physical activity using IPAQ 56
14. Distribution of BTMs before and after log transformation 58
15. Graphical representation of the clear demarcation with no overlap in the reference interval of all BTMs before and after menopause
60
16. A. Correlation of CTX & Spine BMD B. Correlation of P1NP & Spine BMD C. Correlation of OC & Spine BMD D. Correlation of DPD & Spine BMD
63 63 64 64
17. A: ROC curve of BTMs in relation to LS BMD T-score B: ROC curve of BTMs in relation to FN BMD T-score
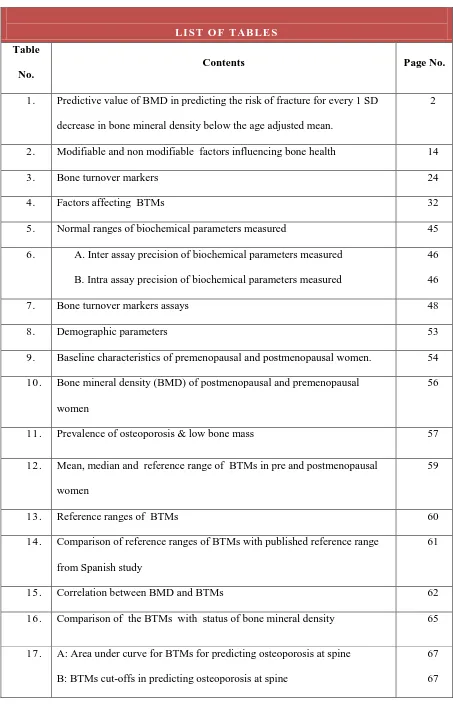
LIST O F TAB LE S
Table No.
Contents Page No.
1. Predictive value of BMD in predicting the risk of fracture for every 1 SD decrease in bone mineral density below the age adjusted mean.
2
2. Modifiable and non modifiable factors influencing bone health 14
3. Bone turnover markers 24
4. Factors affecting BTMs 32
5. Normal ranges of biochemical parameters measured 45
6. A. Inter assay precision of biochemical parameters measured B. Intra assay precision of biochemical parameters measured
46 46
7. Bone turnover markers assays 48
8. Demographic parameters 53
9. Baseline characteristics of premenopausal and postmenopausal women. 54 10. Bone mineral density (BMD) of postmenopausal and premenopausal
women
56
11. Prevalence of osteoporosis & low bone mass 57
12. Mean, median and reference range of BTMs in pre and postmenopausal women
59
13. Reference ranges of BTMs 60
14. Comparison of reference ranges of BTMs with published reference range from Spanish study
61
15. Correlation between BMD and BTMs 62
16. Comparison of the BTMs with status of bone mineral density 65
17. A: Area under curve for BTMs for predicting osteoporosis at spine B: BTMs cut-offs in predicting osteoporosis at spine
[image:15.595.107.560.64.790.2]18. A: Area under curve for BTMs for predicting osteoporosis at femoral neck B: BTMs cut-offs in predicting osteoporosis at femoral neck
68 69 19. Comparison of the BMD of daughters with osteoporotic mothers vs
daughters of non-osteoporotic mothers
69
20. Comparison of the BTMs of daughters with osteoporotic mothers vs daugthers of non-osteoporotic mothers
70
21. Correlation between various factors influencing bone health and BMD 72
22. Association between the risk factors for osteoporosis and BTMs 73
ABBREVIATIONS
ALP Alkaline Phosphatase
AUC Area Under Curve
BMD Bone Mineral Density
BMI Bone Mass Index
BTM Bone Turnover Marker
CV Coefficient of Variation
CI Confidence Interval
COL1 A1 Collagen 1 Alpha 1
CTX C-Terminal Telopeptides Type I Collagen
CLIA Chemiluminescent immunoassay
DXA Dual Energy X-ray Absorptiometry
DPD Deoxy Pyridinoline
DCI Dietary Calcium Intake
DKKI Dickkopf-related protein 1
ELISA Enzyme linked immunosorbent assays
ECLIA Electrochemiluminescentimmunoassay
FA Forearm
FN Femoral Neck
FRAX Tool Fracture Risk Assessment Tool
ICMR Indian Society for Bone & Mineral Research
IOF International Osteoporosis Foundation IFCCLM International Federation of Clinical
IPAQ International Physical Activity Questionnaire
iPTH Intact Parathyroid Homone
LS Lumbar Spine
OR Odds Ratio
OC Osteocalcin
OPG Osteoprotegerin
PA Physical Activity
P1NP Procollagen type I N-terminal propeptide
QCT Quantitative Computed tomography
QU Qualitative Ultrasound
RANKL Receptor Activating Nuclear Factor Kappa B Ligand
ROC Receiver Operating Curve
RIA Radioimmunoassay
SD Standard Deviation
SES Socio Economic Status
SPPI Secreted Phosphoprotein-1
TRACP5b Tartrate resistant acid phosphatase isoform 5b
VDR Vitamin D Receptor
WHO World Health Organization
WnT Wingless-NT
YSM Years since Menopause
1
Introduction
Osteoporosis is an important public health problem worldwide and is
expected to increase with improved life span. The average life expectancy of an
Indian woman is 68 years as per the WHO health statistics (2011) and by 2021, an
increase to 73 years is expected.1 Thus non communicable diseases like diabetes, hypertension, coronary artery disease and osteoporosis are on the rising trend with
increasing longevity.
India has a high reported prevalence of osteoporosis; with one out of two
women and one out of five men above the age of 50 years at risk of
osteoporosis.2,3 As per census 2011, the number of women in India is 586.5 million. About 100 million of them are in the postmenopausal age group. Osteoporosis has
been reported in 50 percent of South Indian postmenopausal women.2 When considering the population in the postmenopausal age group and half of them having
osteoporosis, magnitude of problem seems to be huge with 50 million people
estimated to have osteoporosis or low bone mass according to International
osteoporosis foundation, Asia specific audit estimates.4
Osteoporosis is a silent disease till the occurrence of a fracture.
Complications of osteoporosis in the form of fracture, the most dreaded being hip
fracture contributes to increased morbidity and mortality in elderly population.5 With the increase in the life span, osteoporotic hip fractures are expected to increase
Introduction
2
The economic burden associated with the management of these fractures is
considerably high.3 Osteoporosis goes undiagnosed at an early stage due to factors like lack of awareness among the medical personnel and limited availability of DXA
scanners. There are no uniform guidelines regarding screening and use of other tools
like Fracture risk assessment (FRAX) in resource poor settings.
The current gold standard test for the diagnosis of osteoporosis is by bone
mineral density (BMD) assessment using Dual energy X ray absorptiometry (DXA).
Low BMD is a strong predictor of fracture at any site more specifically at the same
site.7
Table-1: Predictive value of BMD in predicting the risk of fracture for every 1 SD decrease in bone mineral density below the age adjusted mean.7
BMD measurement site
Relative risk of fracture
Hip Vertebrae Forearm
Hip 2.6 (2.0 to 3.5) 1.8 (1.1 to 2.7) 1.4 (1.4 to 1.6)
Lumbar spine 1.6 (1.2 to 2.2) 2.3 (1.9 to 2.8) 1.5 (1.3 to 1.8)
Distal radius 1.8 (1.4 to 2.2) 1.7 (1.4 to 2.1) 1.7 (1.4 to 2.0)
However, about 50% of women who sustain a fragility fracture may not have
BMD in the osteoporotic range.8
Hence there is a need for assessment of other risk factors of osteoporosis and
also use of bone turnover markers (BTMs) which reflects the underlying bone
turnover process.
Bone is a dynamic tissue which undergoes constant remodeling throughout
Introduction
3
turnover. The peak bone mass is attained by third decade and is dependent on
genetic and environmental factors like adequate nutrition, physical activity and
systemic illness. Once peak bone mass is attained, there is a gradual decline in bone
mass with advancing age, which is a dynamic process and is dependent on both bone
formation and resorption.
Figure-1: The influence of peak bone mass and rate of bone loss on BMD with age.9 (Modified from: Mitchell B D et al. J Clin Endocrinol Metab, May 2011)
Bone turnover is balanced with coupling of bone formation and resorption at
various rates leading to continuous remodeling of bone. Age related and pathological
state (e.g. corticosteroid use, hyperparathyroidism, inflammatory arthritis etc.)
induced imbalance in the process of bone turnover may lead to accelerated bone loss.
The resulting increased bone turnover leads to deterioration of bone
microarchitecture and thus contributes to increased risk of fracture independent of
low BMD. This microarchitectural alterations affecting the bone quality can be
assessed by BTMs and thus serve as a complementary tool to BMD in the assessment
Introduction
4
Bone turnover markers are important investigation tools for the diagnosis,
treatment and monitoring of various metabolic bone disease, most importantly
osteoporosis. Bone turnover markers (BTMs) may be utilized for assessing the
response to treatment in short term after initiation of therapy for osteoporosis as
BMD increment may not be evident if the DXA scan is repeated in 6-12 months.
Various automated assays of bone turnover markers are available with manufacturer
provided reference ranges. International Osteoporosis Foundation (IOF) and also
International Federation of Clinical Chemistry & Laboratory Medicine (IFCCLM)
have proposed serum CTX -1 and serum P1NP to be used as reference markers of
bone resorption and formation respectively in clinical settings for assessment of
fracture risk and monitoring therapeutic response to osteoporosis treatment.11 Hence, we attempted to study the correlation of the BTMs with the BMD which is the
current gold standard test in the management of osteoporosis.
There is a paucity of literature with regards to the normative data of bone
turnover markers from India. The manufacturer provided reference range may not be
the same for various ethnicities and may also depend upon various preanalytical
variables like age, gender, race, diurnal and seasonal variations. In this study, we
attempted to derive the reference range of the following bone turnover makers:
serum C-Terminal Telopeptides Type I Collagen (CTX), serum Procollagen type I
N-terminal propeptide (P1NP), serum Osteocalcin (OC) and urine Deoxy
Pyridinoline (DPD) in healthy south Indian postmenopausal women and their
daughters.
Osteoporosis is a multifactorial disease with various modifiable and
non-modifiable risk factors contributing to the pathogenesis of osteoporosis. Genetic
Introduction
5
bone loss and the risk of osteoporotic fracture in an individual. Parental hip fracture
is shown to be one of the major risk factor for fragility fracture. The familial
predisposition to the fracture risk could be secondary to both genetic susceptibility
and the environmental risk factors shared by the family members. Genetic influence
on osteoporosis is complex with multiple candidate genes implicated to have small to
moderate effects in the attainment of peak bone mass and bone loss.12 Hence, we attempted to study the difference in bone mass and BTMs in daughters whose
mothers had osteoporosis.
Apart from genetic and other non-modifiable factors, bone mass is also
determined by various modifiable life style factors. Life style factors comprise of
nutritional factors like calcium, vitamin D, proteins and the behavioural factors
which includes physical activity, smoking and chronic alcoholism. The literature on
the risk factors for osteoporosis in Indian subjects is limited. Hence, we studied
various factors which would influence bone health in daughters and mothers who
were representative of premenopausal and postmenopausal women from the
community.
Low BMD is a proxy indicator for osteoporotic fracture which can be
objectively measured. Hence, we looked at the influence of dietary calcium intake,
the physical activity, parity, socioeconomic status on the bone mineral density in pre
and postmenopausal women. We also looked at the association of these factors with
6
Aims & Objectives
Aim of the study
To study the Bone health (including Bone Mineral Density and Bone
Turnover Markers) and factors influencing them in postmenopausal women and their
premenopausal daughters of urban Vellore in Southern India.
Objectives
To study the correlation between BTMs and BMD (Bone mineral density) at
various sites.
To study the reference range for various bone turnover markers (BTMs) in
healthy premenopausal and postmenopausal women.
To compare the BMD and BTMs among daughters of mothers with
osteoporosis with those whose mother’s did not have osteoporosis.
To look at various factors which influence BMD and BTMs in
7
Review of Literature
Introduction to Osteoporosis
Magnitude of osteoporosis in Indian population
Incidence and economic burden of osteoporotic fractures
Peak bone mass
Osteoporosis –definition
Modifiable and Non modifiable risk factors pertaining to bone health
Calcium, Vitamin D status and BMI
Physical activity
Socioeconomic status
Tools for diagnosing osteoporosis
DXA Scan
Bone turnover markers
Assays for Bone turnover markers
Factors determining pre-analytical variability of BTMs
Role of Bone markers in the assessment of fracture risk
BTMs and osteoporotic treatment monitoring
Ethnicity specific reference range for BTMs
Primary prevention of osteoporosis
Review of Literature
8
Introduction to osteoporosis
Osteoporosis is the most common metabolic bone disorder characterized by a
structural deterioration of bone tissue leading to an increased risk of fracture.2 Osteoporosis is an important public health problem worldwide and is expected to
increase with an improved life span.
Osteoporosis being a silent disease may present with dreaded complication like
hip fracture if periodic screening and preventive strategies are not taken in the
postmenopausal women and elderly men. Hip fracture secondary to osteoporosis
contributes to an increased morbidity and mortality in elderly population.
Osteoporosis (a state of low Bone Mineral Density) has been reported in about 50%
of healthy Indian postmenopausal women.1,2
Bone mineral density (BMD) assessment using Dual-energy X-ray
absorptiometry (DXA) scan is the current gold standard test for the diagnosis of
osteoporosis.13 However, DXA scan has its own limitations being a static measure and an expensive investigation with limited availability in many parts of our country.
BTMs are novel tools which provide insights into the dynamics of the different
phases of bone remodeling. The wider availability of reliable, cost effective,
sensitive and specific assays for bone turnover markers (BTMs) would complement
the measurement of BMD in the management of osteoporosis especially in the follow
Review of Literature
9
Magnitude of osteoporosis in Indian population
The prevalence of osteoporosis in an ambulant south Indian postmenopausal
population shown by a study published in 2008 was 48% at the lumbar spine, 16.7%
at the femoral neck, and 50% at any site. In addition, over half of study population
also had vitamin D deficiency.1 Around 50 million postmenopausal women in India are estimated to be affected by osteoporosis.14
Incidence and economic burden of osteoporotic fractures in India
Untreated osteoporosis in postmenopausal women and elderly men can result
in a fracture usually following a trivial fall. Common sites of osteoporotic fractures
include wrist, spine and hip which carry significant morbidity and mortality.
In a north Indian study, the crude incidence of hip fracture was 129 per 1 lakh
population with further subdivision showing 105 per 1 lakh in men and 159 per 1
lakh in women, which is similar to studies from other Asian countries.15 Incidence of hip fractures are shown to vary with the ethnicities and geography.16
Osteoporotic fractures in Indians seem to occur 10-20 years earlier as
compared to Caucasians.15 In a study by Dhanwal DK et al, the mean age of hip fracture in Indian women was 63.6±9.9 years.17 Vitamin D deficiency and secondary hyperparathyroidism have been reported in about two thirds of the hip fracture
Review of Literature
[image:28.595.135.508.107.358.2]10
Figure-2: Worldwide prevalence of osteoporotic hip fractures18 (adapted from Shuler FD et al. Orthopedics. 2012).
It is estimated that worldwide over 200 million people have osteoporosis. The
health care services costs are already considerable and are predicted to double by
2050 based on the current trends.17 The life expectancy of an Indian woman is 68 years as per WHO health statistics (2011) and by 2021, an increase to 73 years is
expected.1
Osteoporotic fractures are worrisome to the patient and the family due to the
associated increased mortality, morbidity and poor quality of life. They also carry a
huge economic burden to the society and nation as a whole. The minimum
expenditure incurred in the treatment of an osteoporotic hip fracture is around 90,000
rupees, which will have a significant impact on the economy, considering the number
of osteoporotic subjects in the Indian community.3 Therefore, osteoporosis is a significant problem in the elderly and its prevalence in the society is expected to
Review of Literature
11
In a follow up study of postmenopausal subjects (n=104) with surgically
treated hip fracture from southern India, one year mortality was 4 times (20% versus
5%) more than age and BMI matched controls.5 The mortality of a patient after sustaining a hip fracture increases by 24 to 30% within one year of the hip
fracture.19,20
Of those who survive, almost 50% are permanently incapacitated and about
20% need long term nursing home care.21 This not only adds on to the morbidity but also to the cost of health care at the patient, community and national level. The
mortality, morbidity and cost associated with osteoporotic fractures are reduced to a
great extent by early identification of risk factors and treatment of osteoporosis in the
high risk group in addition to maintaining recommended calcium and vitamin D
nutrition.22
Peak bone mass
“Peak bone mass is defined as the amount of bone acquired at the end of
maturation of skeleton”.23
The acquisition of peak bone mass occurs by about 30 years of age after
which there is a gradual decline in the bone mass. Bone turnover occurs at a maximal
rate at birth with both high bone formation and resorption, after which, it rapidly
declines. The bone mass is gradually increased through child and adolescent phases
with peak bone mass generally achieved by third decade of life, after which, there is
constant resorption of bone at slow rate, which may be exacerbated with estrogen
Review of Literature
12
Both genetic and environmental factors determine the peak bone mass.
Nutritional factors like calcium, vitamin D, protein and physical activity are
important environmental factors which determine the bone mass achieved.24
The two important determinants of bone strength are bone density and bone quality.
a)Bone mineral density
Bone density is expressed as density of bone mineral per area or volume.
Bone mineral density of an individual depends of peak bone mass acquired during
first three decades of life which is influenced by the genetic and environmental
factors and rate of bone loss. Various techniques are available for the measurement
of BMD, which is used to define osteoporosis. Indian subjects seem to have low
BMD as compared to Caucasians in view of smaller skeletal frame, vitamin D
deficiency, early menopause, poor sunlight exposure.25
b) Bone quality:
Bone quality depends on micro architecture of bone, trabecular connectivity,
size of cortical and trabecular bone which determine morphometry and dynamic
processes occurring in the skeleton like bone turnover, micro-fracture accumulation
and mineralisation.
Osteoporosis
Osteoporosis is defined as “a condition characterized by a low bone mass
and microarchitectural deterioration of bone tissue leading on to increase in the bone
Review of Literature
13
Osteoporosis is defined based on the bone mineral density (area density in
g/cm2) by using T scores and Z scores.
WHO definition of osteoporosis: (based on Bone mineral density) is as follows:
Osteoporosis T score : < -2.5
Osteopenia T score : 1- to -2.4
Normal T score : > -1
For premenopausal women, a term “low bone mass” is used to describe a
subject who’s BMD Z score is less than minus 2.27
In a meta-analysis by Marshall D et al, the relative risk of hip fracture for 1
SD decline in the bone mineral density at hip was 2.6.7 The predictive ability of decline in BMD for sustaining a fracture is comparable to increased BP for stroke
and Hypercholesterolemia for cardiovascular disease.28
On the other hand, among those who sustain a fracture, 50% women and 70%
men do not have BMD in the osteoporotic range.8 There are several factors which influence bone mineral density either favorably or adversely (Table-2).
T score
: Number of standard deviations above or below BMD of age
matched control
Review of Literature
[image:32.595.108.550.169.683.2]14
Table -2: Modifiable and Non modifiable factors influencing bone health
1. Genetic factors
2. Nutritional factors
a)Calcium b) Vitamin D c)Protein d) role of BMI
3. Physical activity
4. Socioeconomic status
5. Hormonal factors – sex hormones deficiencies, thyroid hormone and
glucocorticosteroid excess, parathyroid hormone excess , growth hormone excess or deficiency etc
6. Chronic systemic diseases like chronic liver disease, chronic kidney disease, malabsorption syndrome
7. Inflammatory conditions like inflammatory arthritis, inflammatory bowel
diseases, connective tissue disorders etc
8. Smoking
9. Alcoholism
Review of Literature
15
Genetic factors
Genetic factors play an important role in determining peak bone mass as well
as rate of bone loss of an individual. Genetic factors like estrogen receptor alpha and
vitamin D polymorphism, COL1 A1, SPP1 have been shown to be associated with
low bone mass.29 The other candidate genes implicated in low BMD and rapid bone loss based on genome wide studies and linkage analysis is related to one of the
below pathways:
1. Receptor activator of nuclear factor k B –RANK lignad- osteoprotegerin
(RANK/RANKL/OPG pathway)
2. Wnt B catenin pathway
3. Estrogen endocrine pathways
4. Chromosome 1p36 9
Epigenetic modification in RANK/RANKL/OPG pathways and WNT/ β
catenin pathways through DNA methlyation, micro RNA expression and post
translational modification of histones are also postulated to contribute to
pathogenesis of osteoporosis.30
Parental hip fracture is one important factor which increases the fracture risk
in the offspring and thus used in in FRAX, highlighting the influence of the genetic
Review of Literature
16
Figure- 3: Role of peak bone mass on fracture risk24 (adapted from Rizzoli et al. Best Practice & Research Clinical Endocrinology & Metabolism. 2014)
Calcium, Vitamin D status and BMI
Dietary calcium, vitamin D and proteins are well established nutritional
factors positively influencing bone health. They help not only in accruing bone mass
and maintaining bone mass but also reduces the rate of bone loss.
a. Dietary calcium and protein
Higher calcium and protein intake result in accrual of higher peak bone mass.
About 5% increase in peak bone mass may result in 50% reduction in fractures, thus
highlighting the importance of peak bone mass.24 Lee at al showed a positive correlation between daily calcium intake, phosphorus intake, calcium / phosphorus
ratio and BMD both at the spine and femoral neck in postmenopausal women and
only at the femoral neck in premenopausal women.31 Many epidemiological studies have documented low dietary calcium intake in India. Daily dietary calcium intake of
Review of Literature
17
South India.1 Indian council of medical research recommends a daily calcium intake of 1000mg/day in premenopausal women and 1300mg/day in postmenopausal
women.32
Protein intake and physical activity have been shown to increase the bone
strength by increasing the cross sectional area and also by increasing the number of
trabeculae.33
IGF1 is another important factor which not only determines the longitudinal
growth but also in bone matrix mineralisation by stimulating the transport of
inorganic phosphate into osteoblastic cell linages, renal tubular resorption of
phosphate and calcitriol synthesis. The synthesis of IGF1 in osteoblastic lineages is
stimulated by dietary proteins like arginine, thus implicating the role of proteins in
bone health.34,35
b. Vitamin D deficiency
Figure-4: Prevalence of vitamin D deficiency across the globe36 (adapted from:Wahl DA et al Arch Osteoporos. 2012)
Review of Literature
18
A higher prevalence of vitamin D deficiency has been shown in all age
groups in India.37 About 50 % prevalence of vitamin D deficiency and insufficiency in cohort of healthy postmenopausal women has been reported from south
India.1 Subjects with vitamin D deficiency had a significantly lower BMD at femoral neck (0.657 vs 0.694, p=0.03).1
Vitamin D deficiency contributes to low bone mineral density by:
a. Decreasing the bone mineral content by reducing the mineralisation and
b. Increased bone resorption as a result of secondary hyperparathyroidism.37
c. Body Mass Index (BMI)
A high BMI has been considered as a protective factor in terms of
osteoporotic fractures, mainly for the hip and pelvis fracture. However the
relationship between BMI and BMD has raised controversies in recent times as few
studies showed increased risk of leg and ankle fracture in obese subjects.38
A recent meta-analysis of relationship of fracture and BMI, showed a
complex association with increased risk of hip fracture with low BMI when adjusted
for BMD, however it was protective for osteoporotic fractures involving tibia, fibula,
distal forearm and upperarm.39
Physical activity (PA)
PA has been associated with higher BMD and reduction in fracture incidence
through different roles across the age groups. PA in children and adolescents
promote incurring maximum peak bone mass, in adults, reduces the age related bone
Review of Literature
19
neuromuscular function in elderly.40 Physical activity has a protective effect in reduction of fracture risk both by increase in BMD as well as by decreasing the risk
of fall by promoting muscle strength and coordination.32 Subjects with higher level of physical activity has been shown to have a higher BMD at hip.41
Physical activity can be assessed using tools like self-reported questionnaires,
direct observation, indirect calorimetry, heart rate telemetry and movement sensors
like accelerometers. International Physical Activity Questionnaire (IPAQ) is an
internationally validated self-reported questionnaire for assessment of physical
activity.42 IPAQ short and long forms have been validated across various population and age groups,43 however is limited by lengthy questionnaire and over estimation in some studies.44
Socioeconomic status (SES)
Postmenopausal women from lower socioeconomic status are shown to be at
increased risk of osteoporosis and fragility fractures which may be secondary to poor
nutrition with respect to protein and dairy products.45
SES has been shown to have significant association with the ten year risk
prediction of hip fracture in postmenopausal women as assessed by FRAX.46
Among the healthy school children from North India, those in lower
socioeconomic strata were found to have a lower BMD and vitamin D levels as
compared to higher socioeconomic strata children. There was also a significant
Review of Literature
[image:38.595.117.499.79.319.2]20
Figure-5: Life style factors affecting bone health and other risk factors 48(adapted from Zhu K et . Curr Osteoporos Rep. 2015)
Secondary causes of osteoporosis include systemic disorders which lead to
either increased bone resorption or decreased bone formation. The endocrinopathies
like hypogonadism, thyrotoxicosis, hyperparathyroidism, growth hormone excess or
deficiency etc, chronic liver disease, chronic kidney disease, chronic inflammatory
diseases like inflammatory arthritis, inflammatory bowel diseases, connective tissue
disorder, chronic alcoholism, smoking and medications like corticosteroids affect the
bone remodeling.
Fracture risk assessment tool (FRAX): Web based tool which incorporates
various risk factors of osteoporosis in addition to BMD in predicting the ten year risk
Review of Literature
21
Tools for diagnosing osteoporosis
Diagnosis of osteoporosis is based on assessment of bone mineral density using
various assessment tools like:
DXA scan
Single energy X ray absorptiometry (SEXA) scan
Quantitative Computed tomography (QCT)
Qualitative Ultrasound
Single photon absorptiometry
Double photon absorptiometry
DXA Scan
Among the various modalities currently available to diagnose osteoporosis,
assessment of the BMD by DXA is gold standard in clinical practice for the past two
decades.
Diagnosis of osteoporosis by DXA scan is by comparing the subjects BMD
with the normative data provided in the scanners. Most DXA scanners have
incorporated Caucasian based normative data. The ethnicity specific normative data
are also available for various populations. The performance of Indian council of
medical research reference data (ICMR data) was compared to Caucasian reference
data (Hologic Data) in Indian subjects and was found that even though there was an
almost perfect agreement in diagnoses of osteoporosis between the two databases,
23.5% hip fracture subjects defined to have osteoporosis by HD were classified by
Review of Literature
22
Advantages of DXA scan over other modalities:
1. Diagnosis of osteoporosis by using T-scores derived by BMD comparison
with available normative data
2. Reliable prediction of fracture risk as proven by various studies
3. Good precision and stable calibration
4. Good instrument quality control measures
5. Shorter scan times
6. Effective for follow up of osteoporosis treatment
7. Minimal radiation exposure
8. Noninvasive
Limitations:
1. Bone quality cannot be assessed which is also a important determinant of
bone strength.
2. Artifacts causing errors in BMD measurements by DXA like degenerative
diseases, extraneous calcification, metal implants, metastasis, barium contrast
media, radionuclide examinations
3. 2D assessment is affected by bone size and shape
4. Interference by soft tissue composition
5. High cost and availability
6. Inability to detect a change over shorter duration of follow up (<12-18months
in common clinical conditions)
In view of this, bone turnover markers are gaining widespread acceptance in the
Review of Literature
23
Bone turnover markers
Bone remodeling –Physiology of Bone turnover markers:
Bone is a dynamic tissue structure which undergoes through phases of
remodeling throughout once life time. After achieving peak bone mass, bone
undergoes constant remodeling through bone resorption followed by bone formation
sequentially at “Bone remodeling unit”, which is a basic multicellular unit of bone.
The initial process of bone resorption is osteoclast mediated formation of
resorption pits by the dissolution of bone mineral and matrix which result in the release of bone matrix components into the blood stream. This is followed by phase
of bone formation phase by osteoblasts which fill in the resorption cavity and cause
mineralisation. The biochemical substances released into systemic circulation during
these phases of bone resorption and formation are called bone turnover markers.51 Under normal circumstances, bone resorption takes place in about ten days and
subsequent bone formation in about 3 months.52 Upto 20 percent of bone may be replaced by remodeling every year. These two activities complement each other and
are brought about by bone cells namely the osteoclasts, osteoblasts and osteocytes
under the regulation of systemic (Parathormone, PTH related peptide and vitamin D)
and local mediators(cytokines like interleukins, prostaglandin E2 and growth
factors).53
The bone formation and resorption are tightly coupled processes with
osteocyte being the most important regulatory cell which responds to various
mechanical stresses by releasing signals to osteoblasts and osteoclasts to initiate the
Review of Literature
24
The bone remodeling is mainly mediated by RANKL/RANK /OPG mediated
pathways.55
The bone markers currently available include enzymes and non-enzymatic
peptides derived from the cellular and non-cellular compartments of bone.
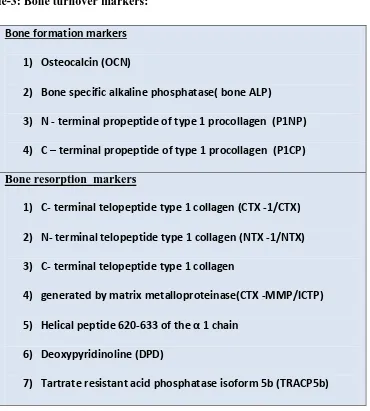
The bone turnover markers are grouped into 2 categories based on the
metabolic phase during which they are produced as:
1) Bone resorption markers
[image:42.595.136.506.339.750.2]2) Bone formation markers
Table-3: Bone turnover markers:
Bone formation markers
1) Osteocalcin (OCN)
2) Bone specific alkaline phosphatase( bone ALP)
3) N - terminal propeptide of type 1 procollagen (P1NP)
4) C – terminal propeptide of type 1 procollagen (P1CP)
Bone resorption markers
1) C- terminal telopeptide type 1 collagen (CTX -1/CTX)
2) N- terminal telopeptide type 1 collagen (NTX -1/NTX)
3) C- terminal telopeptide type 1 collagen
4) generated by matrix metalloproteinase(CTX -MMP/ICTP)
5) Helical peptide 620-633 of the α 1 chain
6) Deoxypyridinoline (DPD)
Review of Literature
25
A limitation of this classification is that some BTMs like hydroxyl proline
and osteocalcin may represent both formation and resorption phases. Also they may
have extra skeletal origin and are not always from the bone. Finally these markers are
not disease specific and only represent bone remodeling. 56
IOF and IFCCLM have proposed serum CTX -1 and serum P1NP to be used
as reference markers for the assessment of fracture risk and monitoring therapy in
[image:43.595.124.547.296.608.2]clinical settings.11
Figure- 6: BTMs in different phases of bone remodeling10
(adapted from:Wheater G et al. Journal of Translational Medicine 2013)
Bone formation markers
Bone resorption markers
Review of Literature
26 A) Markers of bone resorption
These are formed during the phase of bone resorption involving osteoclastic
activity. This includes byproducts of osteoclasts released during bone resorption and
osteoclastic enzymes.
The bone resorption markers are categorised as follows:
1) Carboxy terminal crosslinked telopeptides of Type 1 collagen (CTX - Beta cross lap)
CTX are degradation products of Type 1 collagen of bone. These non-helical
fragments containing cross linking regions are the carboxy terminal telopeptides of
the type 1 collagen, generated by the activity of the enzyme cathepsin K. The native CTX exists in two forms: α and β isomerised forms. These isomerised forms undergo
further isomerisation to form D and L forms. The spontaneous β isomerisation of α isoforms occurs with protein aging. Hence the altered ratio of : α and β isomerised
Review of Literature
27
children and pathological conditions like malignant bone diseases, paget’s disease of
bone and those receiving Parathyroid hormone treatment.57,58
The major problem with CTX measurement is its circadian variation, with peak
in the second half of night and nadir in the afternoon. Studies looking at the circadian
variation of CTX reported a peak level of CTX at 05.00 hr and nadir at 14.00 hr.59,60 CTX measurements is also affected by food intake with reduction in serum levels by
20% postprandial as compared to fasting state. Hence to reduce this preanalytical
variability, it is recommended to collect the sample in the morning after an overnight
fast. 61
2) Amino terminal crosslinked telopeptides of Type 1 collagen (NTX)
They are generated from the amino terminus of the type 1 collagen by cleavage
of N terminal region by cathepsin K during resorption phase of bone turnover. NTX
is measured using a monoclonal antibody against specific N terminal epitope. NTX
levels are usually altered in liver and renal failure. Urine NTX exhibit less circadian
and postprandial variability as compared to CTX, However, 24 hour urine collection
is more cumbersome.62
3) Pyridinoline (PYD) and Deoxypyridinoline (DPD)
These are covalent pyridinium compounds formed during the fibrillar collagens
maturation. These crosslinked collagens released into the circulation when mature
type 1 collagen is proteolytically degraded for mechanical stabilisation of the
molecule. They reflect the degradation of mature cross linked collagens and is
measure newly synthesized collagens. In addition, the urinary excretion of DPD is
Review of Literature
28
highly specific for skeletal tissues. While PYD is found in cartilage, bone, ligaments
and vessels, DPD is almost exclusively found in bone and dentin. These can be
measured in a 24 hour urine collection or as creatinine corrected spot urine
measurements Thus, the PYD and DPD are one of the good indices for bone
resorption.63
Novel biomarkers: Tartrate-Resistant Acid Phosphatase (TRAP, TRAcP5b),
Cathepsin K, Receptor Activator of Nuclear factor Kappa B Ligand (RANKL),
Osteoprotegerin(OPG) , Dickkopf-related protein 1 (DKK1) and sclerostin
These are novel biomarkers of bone resorption currently used in research setting
to study bone remodeling and the efficacy, safety, mechanism and mode of action of
drugs used in osteoporosis and other metabolic bone diseases.
TRACP5b is the isoform of acid phosphatase which is resistant to degradation by
tartarate, cleaved by protease into isoform 5b, most specifically expressed in the
ruffled border of osteoclast and cleaves type 1 COL into fragments during bone
resorption.64
Cathepsin K is an osteoclastic enzyme, cysteine proteinases present at active
osteoclasts ruffled border, which is specific of osteoclastic activity.65
RANKL are osteocytes markers which reflect bone microenvironment. They are
produced on activation of osteoclasts by activated by B and T cells and stimulate the
differentiation and activity of osteoclasts after binding to RANK.
Osteoprotegerin is another marker of osteocyte activity, synthesized by
Review of Literature
29
binding to RANK and thus reduce bone resorption. Dickkopf-related protein 1
(DKK1) and sclerostin are markers of osteocyte activity secreted by osteocytes and
inhibit bone formation by inhibiting WNT signalling by binding to LRP -5 in the
osteoblasts.
B) Markers of Bone Formation
Bone formation markers are products of active osteoblasts expressed during
different phases of their development and bone formation. They are considered to
reflect different aspects of osteoblast function and bone formation. All markers of
bone formation are measured in serum or plasma.
Bone formation markers are categorised as:
1) Procollagen Type I Propeptides
PINP and PICP are peptides produced from type I procollagen by proteases
mediated posttranslational cleavage at N and C terminal respectively. PINP and PICP
are predominantly synthesized from bone (proliferating osteoblasts and fibroblasts)
followed by tendon, dentin skin, and cartilage.66 Since skeletal tissues undergo a higher rate of turnover than non-skeletal tissues, they contribute a preponderance of
collagen propeptides to circulation.66 PINP is cleared by the mannose receptor, which • By products of collagen synthesis
Propeptides of type 1 collagen: (C terminal: P1CP, N terminal: P1NP) • Matrix proteins
Osteocalcin
• Osteoblast enzymes
Review of Literature
30
in turn can be regulated by growth hormone and thyroid hormones, thus complicating
interpretation in subjects with pituitary or thyroid dysfunction. P1NP exists in serum
as trimeric form or its thermal degradation product product in the monomeric form.
Immunoassays detect either the trimeric forms (automated IDS ISYSS assays) or
both forms which is called total P1NP assays (automated Roche Elecsys assay).67 Various studies using P1NP have shown a low intra-individual variability, lesser
circadian variability, stability at room temperature and good assay precision. P1NP is
proposed as a reference bone formation marker by IOF in view of reliability of P1NP
assays and its response to treatment .11
2) Serum Alkaline Phosphatase (total and bone specific):
Alkaline phosphatase is a ubiquitous, membrane-bound tetrameric enzyme
present in the plasma membrane of the osteoblasts. Its major function is formation of
osteoid and mineralisation mediated by enzymatic degradation of pyrophosphate, an
inhibitor of mineralisation, at an alkaline pH.68 ALP is the first bone turnover marker utilised in both research and clinical practice.
3) Osteocalcin (OC):
OC is a hydroxyapatite-binding protein exclusively synthesised by osteoblast,
odontoblasts and hypertrophic chondrocytes. It is also called as the bone gla protein
and constitutes 15% of the non-collagenous bone matrix. OC is an active molecule
involved in the organization of the extracellular matrix which is bound to
hydroxyaptite in the mineralised matrix of bone and is released during both bone
Review of Literature
31
OC is considered a specific marker of osteoblast function. Mineral binding of osteocalcin requires γ carboxylation of three glutamate residues of OC. The
undercarboxylated OC has been shown to have a negative correlation with hip
fracture in elderly women.The undercarboxylated OC has also shown to have effect
on metabolic processes like increasing insulin secretion and action.70
Being a late marker of osteoblastic activity, it has been labelled as a bone
formation marker but is limited by short half-life, unstable intact molecule and
influence of vitamin K, renal function and variations associated circadian rhythm.
OC has been found to be a useful biomarker in steroid induced osteoporosis.71
Bone turnover markers assays
Various methods available for measurements of bone turnover markers include:
1. Radioimmunoassay (RIA)
2. Immunoradiometric assays (IRMA)
3. Enzyme linked immunosorbent assays (ELISA)
4. Chemiluminescent immunoassay (CLIA)
5. Electrochemiluminescent immunoassay (ECLIA)
Factors determining preanalytical variability of BTMs:
BTMs exhibit significant intraindividual and preanalytical variability. These
variability must always be kept in mind while interpreting the BTMs in clinical
scenario. Thus various factors affecting BTMs need to looked for, while interpreting
Review of Literature
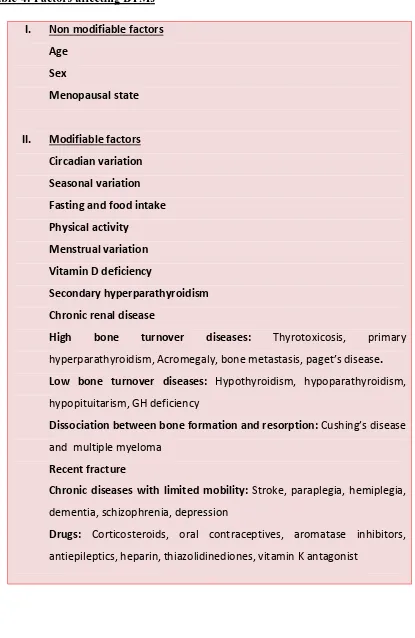
[image:50.595.126.541.122.760.2]32
Table-4: Factors affecting BTMs72
I. Non modifiable factors
Age Sex
Menopausal state
II. Modifiable factors
Circadian variation Seasonal variation Fasting and food intake Physical activity
Menstrual variation Vitamin D deficiency
Secondary hyperparathyroidism Chronic renal disease
High bone turnover diseases: Thyrotoxicosis, primary
hyperparathyroidism, Acromegaly, bone metastasis, paget’s disease.
Low bone turnover diseases: Hypothyroidism, hypoparathyroidism,
hypopituitarism, GH deficiency
Dissociation between bone formation and resorption: Cushing’s disease and multiple myeloma
Recent fracture
Chronic diseases with limited mobility: Stroke, paraplegia, hemiplegia, dementia, schizophrenia, depression
Drugs: Corticosteroids, oral contraceptives, aromatase inhibitors,
Review of Literature
33
In view of analytical and pre analytical variability of BTMs assays,
appropriate sample collection and storage conditions must be followed. To reduce
the biological variability, samples must be collected in fasting state. Subsequent
serial measurements must be done on the same time and same season to account for
the diurnal and seasonal variation.
The preanalytical variability can be reduced by appropriate sample collection
with proper preparation of patient and by standarised specimen handling, storage and
specimens. For BTMs with predominant renal excretion (ex:OC), correction for renal
function is required.
Changes in the BTMs must be large for monitoring clinical response in view
of biological and analytical variations. While interpreting the BTM response “Least
significant change” (LSC) for each BTM must be utilised which is derived by
product of the each BTMs precision error provided by the laboratory by 2.77(95%
confidence interval).73
A. Role of BTMs in assessment of fracture risk
The high BTMs may predict the risk of sustaining osteoporotic fracture in
postmenopausal women independent of BMD. State of increased bone turnover leads
on to deterioration of bone micro architecture and thus contributes to low BMD and
also an increased risk of fracture. This micro architectural alteration affecting bone
quality can be assessed by BTMs and thus serve as a complementary tool to BMD
measurement in assessing the fracture risk. The state of increased bone turnover
Review of Literature
34
may be less mineralised with decreased post translational modification in terms of
decreased beta cross links and beta isomerisation of the type 1 collagen.74,75
i. OFLEY study (Os des Femmes de Lyon)
Garnero P et al, studied 435 healthy untreated younger postmenopausal
women aged 50–89 years (mean, 64 years) from OFLEY cohort comprising 1039
women (31–89 years of age). Baseline bone markers were compared in 55 women
who had sustained fractures(20 vertebral and 35 peripheral fractures) and 380
controls who were followed up for 5 years. Two fold increased risk of fracture was
seen in women with BTMs in highest quartile with relative risk of 1.8(CI: 1-3.4) for
urinary free pyridinoline, 1.7 (CI:0.9-3.2) for urinary NTX, 2.3 (CI:1.3–4.1) for
urinary CTX, 2.1 (CI:1.2–3.8) for serum CTX, 2.4 (CI:1.3–4.2).76
ii. The Rotterdam study
Urinary pyridinium cross links (including total pyridinoloine, free
pyridinoline, total deoxypyridinoline and free deoxypyridinoline) have been shown
to have a significant association with hip fracture risk with age adjusted RR of 3.3, 3,
2.2, 1.8 respectively in a nested case control.77
iii. EPIDOS (Epidemiologie de l’Ostéoporose) prospective cohort study
Vergnaud P et al studied 104 subjects over 75 years of age with hip fracture
versus 255 controls from a cohort of 7598 postmenopausal women. They found that
under carboxylated osteocalcin measured by ELISA predicted the increased fracture
risk with a odds ratio of 1.9 (1.2-3.0), which persisted even after adjusting for
Review of Literature
35
iv. Nested case control study from EPIDOS cohort on serum CTX
In a nested case control study from EPIDOS cohort of postmenopausal
women, which included 115 fracture subjects as cases and 293 controls, serum CTX
samples collected in the afternoon had a significant prediction of fracture, with
hazard ratio of 1.8( 1.01- 3.76), unlike whole group CTX which was not predictive.79 The most useful application of BTMs is in monitoring the compliance and
adherence to treatment. Adherence to treatment is the most challenging aspect in the
treatment of osteoporosis, especially for medication which requires strict precautions,
dosing, schedule and parental route of administration. Thus, BTMs could identify
poor compliance and therapeutic efficacy. Therefore, BTMs need to be measured
before starting treatment and subsequently at follow ups.80
Improving Measurements of Persistence on ACtonel Treatment (IMPACT) study
In a multinational prospective, open-label, cluster-randomized study of
postmenopausal women(IMPACT study), Urinary N-terminal cross-linked
telopeptide of type 1 collagen (uNTX) and serum C-terminal cross-linked telopeptide
of type 1 collagen (sCTX) levels were assessed at baseline and weeks 10 and 22 of
treatment with risedronate 5mg/day. In 2302 women, responses beyond LSC in
BTMs (uNTX and sCTX) and BMD (spine only) were associated with a reduced risk
of nonvertebral fractures (NVFs) and all fractures. The incidence of NVF was about
50% lower in patients with reductions of uNTX of 30% or more at 22 weeks (1.6%)
than in those with less than 30% reduction (3.2%) (p =0.015).
Chen P et al studied changes in five BTMs in a subset of women who
Review of Literature
36
Fracture Prevention Trial. Significant correlation was found between LS BMD
response and BTMs with correlation coefficients of 0.41 for PINP, 0.40 for NTX,
0.36 for PICP, 0.28 for bone ALP and 0.23 for DPD. Amongst these, PICP increase
at 1 month and PINP at 3 months correlated best with increases in LS BMD at 18
months (0.65 and 0.61, respectively; p < 0.05). 81
Changes in BTMs have also been seen with other antiresorptive medications
like raloxifene and strontium.(82,83)
The strong association of bone turnover markers seen with fracture risk
reduction in various studies (in subjects who had been on osteoporosis treatment)
supports the use of BTMs in the management of osteoporosis.
Limitations of BTMs
• Pre analytical and analytical variability
• Inadequate appreciation of sources of variability of each bone turnover
markers
• Lack of standardisation of the assays for bone turnover markers
• Ethnic variations of BTMs and lack of ethnicity based reference interval for
each population
• Nonavailability of data on response of various BTMs to different
Review of Literature
37
Ehinicity specific reference range for BTMs
BTMs are subjected to various pre-analytical variations. Studies have shown
ethnicity based variations in the distribution of BTMS. Lack of availability of
reference range of BTMs in different populations and lack of standardisation of
reference ranges reported by commercial labs in terms of pre-analytical variations
like age , gender, ethinicity, excercise, oestrogen treatment, diurnal and seasonal
variations that are known to affect BTMs measurement have necessitated the
establishment of ethnicity specific reference ranges for BTMs.84,85
Primary prevention of osteoporosis
Osteoporosis being considered as a major public health problem, attention
and measures for preventing fractures are needed at a primary health care level.
Creating awareness among the community regarding the bone health is of utmost
importance. Life style behavior pertaining to adequate calcium, vitamin D and
protein intake, physical activity and other risk factors like smoking and alcohol needs
to be addressed across all age groups for the attainment of peak bone mass and
prevention of bone loss. Calcium supplementation in pre-pubertal children to the
recommended daily level results in increased rate of BMD increments.86
Calcium with or without vitamin D supplementation has been shown to be
associated with a reduction in bone loss of 0.54% at hip and 1.19% at spine and 24%
Review of Literature
38
Figure-7: Meta- analysis showing the effect of calcium and calcium with vitamin D combination on the fracture risk.87
Physical activity is an important element which positively influences bone
health, as men and women who were physically active were found to have a higher
BMD and lower fracture rates compared to their sedentary counterparts.88
Encouraging people of all age group to be physically active not only
improves the bone health by achieving a higher peak bone mass and preventing bone
loss it also improves the muscle strength and postural balance leading to reduction in
falls in elderly.40,42
Cessation of smoking and chronic alcohol consumption also improves bone
health. Screening for osteoporosis using various tools for assessing low BMD, most
accepted being DXA scan identify subjects with osteoporosis will help in treating
these patients for preventing osteoporotic fractures. Application of FRAX:web based
tools which estimate the 10 year probability of sustaining a major osteoporotic
fracture and hip fractures based various risk factor assessment helps in identify at
risk subjects who needs intervention. Antiresorptive and anabolic medication which
Review of Literature
39
Secondary prevention of osteoporosis
Up to half of the hip fractures are secondary to potentially modifiable risk
factors like low calcium and vitamin D, low BMI, low physical activity, lower
sunlight exposure and higher consumption of tea.89
Addressing Life style factors by improving nutrition, promoting physical
activity, ensuring sunlight exposure and cessation of smoking and alcohol would
prevent a second fracture. Fall preventive measures are shown intervention reducing
the risk of fracture in elderly. Vitamin D supplementation may reduce the risk of fall
by 19%.90
Several group of drugs either preventing bone resorption or promoting bone
formation or both are available which are used in the treatment of osteoporosis.
Bisphosphonates are the most widely used agents for the treatment of
osteoporosis which are efficacious, safe and easy to use. Upto 70% reduction of
vertebral fractures, 41% reduction in hip fracture and 25% non-vertebral fracture
reduction have been seen with potent bisphosphonates like Zolendronic acid.91 Teriparatide and denosumab are the other most effective agents for preventing the
fragility fractures with small differences among the drugs in terms of
efficacy.92 Monitoring the response to anti-resorptive or anabolic agents is usually by repeating a DXA scan after 18-24 months (taking into consideration of duration
for the Least Significant Change to occur) to look at the increment in BMD.
However, changes in BTMs are seen as early as 8-12 weeks following initiation of
40
Materials & Methods
Study design
This was a cross sectional study conducted over a period of one year.
Institutional review board, IRB Min.No.8343 (OBSERVE dated 18.06.2013) approval
was obtained. Healthy premenopausal women and their mothers who had attained
menopause were recruited from the community from an urban area in Vellore district of
South India. Daughters and their mothers were recruited as they would be expected to
have similar environmental and genetic background. Subjects were recruited from the
community by random cluster sampling after obtaining an informed consent.
Inclusion Criteria
• Premenopausal group :
Healthy women between 25 and 45 years with cyclic monthly menses (cycles
occurring every 25 to 35 days within the past year).
• Postmenopausal group:
Mothers of the pre-menopausal women aged above 45 years who attained
Materials & Methods
41
Exclusion criteria
1. Systemic illnesses
2. Hyperthyroidism
3. Hyperparathyroidism
4. Cushing syndrome
5. History of fracture
6. Immobilisation
7. Either of postmenopausal women or their daughters residing outside the Vellore district.
8. Women who were on medications that may interfere with bone mineral metabolism.
These subjects were asked a detailed history regarding any physical ailments or
medication use and underwent a detailed physical examination, including
anthropometry.
The history included questions to assess their age, socioeconomic status, physical
activity, menstrual cycles, parity, any systemic illness and medication use.
Socioeconomic status was assessed using “Modified Kuppuswamy's
socioeconomic scale”, which takes into account education, occupation and family
Materials & Methods
42
Figure-8: “Modified Kuppuswamy’s socioeconomic scale” (Kumar N et al. Indian J
Materials & Methods
43
Physical activity was assessed using a internationally validated standardized
q