ABSOLUTE EOSINOPHIL COUNT AND ASTHMA
CONTROL IN ADULT PATIENTS IN GOVT
ROYAPETTAH HOSPITAL, CHENNAI - 14”
A Dissertation Submitted to
THE TAMILNADU DR. M.G.R MEDICAL UNIVERSITY
CHENNAI
In Partial Fulfilment of the Regulations
for the Award of the Degree of
M.D. (GENERAL MEDICINE)
BRANCH – I
GOVERNMENT KILPAUK MEDICAL COLLEGE
CHENNAI
This is to certify that “A STUDY OF CORRELATION
BETWEEN ABSOLUTE EOSINOPHIL COUNT AND ASTHMA
CONTROL IN ADULT PATIENTS IN GOVT ROYAPETTAH
HOSPITAL, CHENNAI - 14” is a bonafide work performed by
Dr.G.NARAYANAN, post graduate student, Department of Internal
Medicine, Kilpauk Medical College, Chennai-10, under my guidance and
supervision in fulfilment of regulations of the Tamil Nadu Dr. M.G.R
Medical university for the award of M.D. Degree Branch I (General
Medicine) during the academic period from May 2012 to April 2015.
Prof.Dr.R.SABARATNAVEL.M.D., Professor & H.O.D.
III Unit Chief, GRH
Department of Internal Medicine Kilpauk Medical College
Chennai
Prof.Dr.N.GUNASEKARAN,M.D.,DTCD The DEAN
I solemnly declare that this dissertation “A STUDY OF
CORRELATION BETWEEN ABSOLUTE EOSINOPHIL COUNT
AND ASTHMA CONTROL IN ADULT PATIENTS IN GOVT
ROYAPETTAH HOSPITAL, CHENNAI - 14” was prepared by me at
Government Kilpauk Medical College and Hospital, Chennai-10, under
the guidance and supervision of Dr.R.SABARATNAVEL.MD.,
Professor and Head of the Department of Internal Medicine, Government
Kilpauk Medical College and Hospital, Chennai.
This dissertation is submitted to The Tamil Nadu Dr. M.G.R.
Medical University, Chennai in partial fulfilment of the University
regulations for the award of the degree of M.D. Branch I (General
Medicine).
Place: Chennai
Behind every successful work there are hands of many people. I
would like to take this opportunity to thank all the people behind the
completion of this dissertation.
At the outset, I would like to thank my beloved Dean, Kilpauk
Medical College Prof. Dr.Dr. N. Gunasekaran M.D., DTCD., for her
enormous support given to the post graduates and for allowing us to
conduct the study in our hospital in a smooth and uninterrupted manner.
It gives me immense pleasure to express my sincere and deep
gratitude to Prof. Dr.S.Mayilvahanan, M.D., Medical
Superintendent and Director INCD, Professor, Department of Medicine,
Kilpauk Medical College, for rendering permission to do this dissertation.
I would like to thank wholeheartedly, Prof. Dr.R.Sabaratnavel.
M.D., my unit chief and HOD ,Professor of Medicine her constant
guidance, support, motivation and untiring efforts during the course of
my dissertation. Though he had given me enough freedom during my
research, he has always been concerned about the difficulties that I
encountered. I will always remember her calm and relaxed nature and the
assistants Dr.K.E.Govindarajulu. M.D., Dr.I.Rohini M.D.,
Dr.N.Jayaprakash. M.D., GRH, Kilpauk Medical College Hospital for
his continuous motivation, timely advice and valuable criticism which
enabled to complete the dissertation.
I also express my special thanks to Prof. Dr. S. Usha Lakshmi
M.D., Prof. Dr.T.Ravindran M.D., DNB., Dip Diabetology and
Prof.D.Balan, M.D. Prof. Dr.K.T.Jayakumar M.D., Dr.K.Manickam
M.D.Registrar, Dr.G.Kalaiselvi DGO., MD., Registrar GRH,I am
extremely thankful to All Assistant Professor of Medicine, GRH and
KMC for their assistance and guidance. I would always remember with
extreme sense of thankfulness for the co-operation and criticism shown
by my fellow post graduate colleague and friends.
I Cannot Imagine my current position without the Love and
support from my parents. I Thank my parents Mr P.C..R Gopal and
Lovable Mrs.G.Kannammal, in-laws Mr.A. Marimuthu Arulsami
and Mrs.N.Banumathi for providing me good health and education. I
always fall short of words and felt impossible to describe their support in
words. If I have to mention one things about them, among many, then I
are Great”
I pray Almighty God to give me strength to achieve in all my
endeavours. Finally, I wholeheartedly thank all my patients for their
active co-operation in this study, without which this would not have
become a reality.
Last but not least, I Would Like to pay high regards to my Lovable
wife Dr.M.A.Manopavithra.MBBS, my Lovable Child Hershina
Adithi and my sisterDr.G.Maragatham MBBS, my brother G.Prabhu,
Ramya, for their sincere encouragement and inspiration throughout my
research work and lifting me uphils this phase of life. I Owe everything to
them.
I Would also like to extend huge, warm thanks to my UG
Batchmates Dr.R.Nithiyanantham, M.D.,(Paed), Dr.P.Senthilkumar
DM., (Neo), Dr.B.Kathirvel M.S., MCh (Cardiothoracic), my units
Dr.M.Karthikeyan MD., PG. My friends Dr.J.Harikrishnan MD.,
PG. Dr.H.Vasanthakumar MD., Dr.Ramesh MD., PG.PG.
ourbatchmates and our units PGs for their valuable help and support.
Besides this, several people have knowingly helped me in the
A Study of “Correlation Between Absolute Eosinophil Count And
Asthma Control In Adult Patients In Govt Royapettah Hospital,
Chennai-14”
Introduction :
Bronchial Asthma is one of the most common disorders of
inflammatory reactions of the respiratory tract, characterized by
breathlessness, wheezing, minimal cough and expectoration.
Aim:
To study the correlation of absolute eosinophil count with asthma
control in adult
Methods and methodology:
This study was conducted on the patient who attended the Asthma
op in Govt Royapettah Hospital, Kilpauk Medical College, Chennai. The
patients of 18-75 years were selected for the study. Both the sexes were
included and who belong to different socio-economic groups was taken as
per inclusion criteria. A total of 40 cases were selected minimum of study
was 6months. The statistical analysis made here is based on the data
Fifty seven and half percent (57.5%%) of the asthmatic had
increased eosinophil count(more than 450 cell per cumm) and forty two
and half percent (42.5%) had normal absolute eosinophil count and p
value 0.000.
Conclusion :
Our study shows that serum absolute eosinophil count have a
significant impact(p value 0.000) on asthma control, higher levels
correlating with poor control ,so increased dose or frequent steroid
inhalation and dose adjustment, lower absolute eosinophil count well
control of asthma.
Measurement of absolute eosinophil count can be useful in
assessing the severity of such inflammation. So the evaluation of absolute
eosinophil count is a useful baseline investigation and its serial
measurements can be taken as a marker for adjusting the dose of inhaled
S.No Title Page no
1 Introduction 1
2 Review of Literature 3
3 Aims of the Study 52
4 Materials and Methodology 53
5 Proforma 56
6 Results 59
7 Discussion 94
8 Study limitation 99
9 Conclusion 100
10 Recommendation 102
11 Bibliography
Annexure - 1 Master chart
INTRODUCTION
Asthma has an alarmingly increasing incidence in the past few decades1and is one of the leading causes of morbidity in adults. Bronchial Asthma is a very common chronic disorder of the airways which affects individuals at almost any age and is an important cause of respiratory morbidity and mortality. The World health organization estimate is that there are 15 to 20 million people with asthma in India and affects 7% of the population and 300 million people worldwide2
Bronchial asthma is a predisposition to chronic inflammation of the lungs in which the bronchi are reversibly narrowed3It creates a substantial burden on individuals and families as it is more often under diagnosed & undertreated. Though effective screening, evaluation and management strategies are well established in developed countries, these are not fully implemented in India. Thus asthma appears to be increasing in prevalence despite considerable improvements in management and numerous drugs for treatment of asthma. So, it is essential to study the
smooth muscle cells in the bronchi constrict the airways and become inflamed and swollen thereby breathing become difficult.
In modern system of medicine, drugs are used for long term prevention, starting with inhaler, corticosteroids and then long acting -2 agonists if necessary.
Absolute eosinophil count is shown to be a risk factor for allergic asthma and can be used as a marker of disease severity in adult with asthma4.So, in the present study our aim was to study of correlation between absolute eosinophil count and asthma control in adult patients5.
REVIEW OF LITERATURE
Framework:
1. Historical aspects of bronchial asthma
2. Magnitude of asthma in adults
3. Definition of asthma
4. Classificationof asthma
5. Pathogenesis
6. Absolute eosinophil count and its role in asthma
7. Diagnosis of asthma
8. Management of asthma
1. Historical aspects:
hippocraticum’6in 450BC.In the 17th century, ‘Bernardino Ramazzini7’, identified and noted a connection between asthma and organic dust. In 19th century, initially it was considered as psychosomatic illness and was treated based on psychoanalysis. Later Henry Hyde Salter in his treatise “on asthma & its treatment” has refined the term asthma as “Paroxysmal dyspnoea of a peculiar character with intervals of healthy respiration between attacks.” He found that aduquate amount of theobromine content in black coffee gives relief in asthmatic spasms.8At the end of 19th century physicians concluded that asthma was a distinct disease with specific manifestations.
DEVELOPMENT OF THE RESPIRATORY SYSTEM:
At about four weeks of development, the respiratory tracts begins as an elongated outgrowth of the foregut. “This out growth is called as the respiratory diverticulum9”.The respiratory diverticulum have endodermal lining and its gives rise to the epithelium and glands of the trachea, bronchi and alveoli ducts and sac . The Musles, connective tissue and cartilage, in “relation to the organs of respiration are derived from splanchnopleuric mesoderm10”.
By 24weeks, respiratory bronchioles will develop11. During 6to16weeks, lungs will be formed, except those of gaseous exchange.
During 16 to 26 weeks, lung tissue becomes highly vascular and respiratory bronchioles, alveolar ducts and alveoli develop12.
At 30th week, mature alveoli develop before birth, remaining will develop afterbirth. Infants13 born before this time tend to exhibit infant respiratory distress syndrome resulting from inadequate surfactant production. During fetal life, the lungs are filled with fluid and all respiratory exchanges are made by the placenta. Vascular shunts cause circulating blood to largely bypass the lungs. At birth, the filled fluid pathway empties, and therespiratory passageways are filled with air. As the PCO2 in the baby’s blood rises, the respiratory centres are excited, causing the baby to take its first breath. “The alveoli becomes inflate and begins to function in gas exchange, but it is nearly two weeks before the lungs are fully inflated14”.
RESPIRATORY SYSTEMFUNCTIONAL ANATOMY:
composed of the respiratory bronchioles, alveolar ducts, and alveoli, all of which are microscopic structures16. The conducting zone contain all other respiratory passage, which provides fairly rigid conduits for air to reach the gas exchange sites.
Conducting Zone Structures:
The right and left main (primary) bronchi are formed by the division of the trachea approximately at the level of T7 in an erect position. Each bronchus runs obliquely in the mediastinum before plunging into the medial depression (hilum) of the lung on its own side. The right main bronchus is shorter , wider and more vertical than the left and is the more common site for an inhaled foreign object to become lodged17. By the time incoming air reaches the bronchi, it is warm, cleansed of mostpathogenes, dust, and saturated with water vapour.
bronchioles, are less than 0.05 cm in diameter. Because of this branching pattern, “the conducting network within the lungs is often called the bronchial or respiratory tree18”.
Respiratory Zone Structures:
It is composed of a respiratory bronchioles, alveolar ducts, atria,sac and alveoli. There are about more than “300 million alveoli in the two lungs19“and each alveolus has an average diameter of about 0.02 centimetres. The alveolar walls are extremely very thin and between the alveoli is an almost solid networks of interconnecting capillaries.
The Respiratory Membrane:
Gas exchanges occur mainly by simple diffusion across the respiratory Membrane,(o2) oxygens passes from the alveolus into the blood and CO2 leaves the blood to enter the gas-filled alveolus.
2. Magnitude of asthma:
Asthma has become an increasingly common problem with a global prevalence of 1-18% in different countries. It is estimated that around 300million people, worldwide, suffer from asthma. The prevalence increases by 50% every decade.
disability adjusted life year (DALY) lost worldwide. A worldwide increase in the prevalence of asthma is being reported at an alarming rate of 5% per year. In India the estimated prevalence is 5-10%.20
Asthma may have its onset at any age before puberty and is twice more common in boys in the pre pubertal age21. But the sex ratio equalized by age 30. Fifty percent of all asthmatic children are asymptomatic from 10-20 years of age but recurrences are common in adulthood.
The cost of treating asthma in patients places a considerable burden on the health resources owing to the cost of medications, hospitalizations and the time spent by parents or caretakers in looking after them.
BRONCHIAL ASTHMA
3.Definition:
The manner in which asthma has been defined has changed significantly over time.
In 1960’s asthma was viewed as an episodic disease in which airflow obstruction was caused by bronchial hyper responsiveness23.
In 1970’s the concept of preventing bronchospasm and managing disease progression was considered.
In 1990’s asthma was redefined as a chronic inflammatory disease characterized by reversible airflow obstruction and bronchial hyper responsiveness.24
Asthma can be classified as
Three groups based on etiology
Atopic (IgE mediated, triggered by allergens),
Non Atopic (non IgE mediated, triggered by infection),
Mixed and exercise or aspirin induced
ALLERGIC ASTHMA
Asthma is characterized by paroxysmal attacks of difficulty in breathing Accompanied by a sense of suffocation. In between the episodes the patient is symptom-free. An asthmatic attack can be provoked by a variety of factors which include allergens, emotional factors, physical strain, infections and exposure to sudden changes in temperature, climate and weather factors.
PREVALENCE:
An estimated 20 million Americans suffer from asthma, and 50% of asthma cases are “Allergic asthma”. “About one half of the cases develop before age of 18 and another third occur before age 40”27.
ALLERGEN INDUCED ASTHMA:
In atopic asthmatic individuals with experimental inhalation of allergen leads to development of different types of reaction.
Immediate asthma (early reaction)
Airflow limitation begins within minutes of contact with the allergen, reaches its maximum in around 15-20 minutes and subsides byarounds 1 hour.
Dual and Late Phase reactions:
Recurrent asthmatic reactions:
The development of the late phase reaction is associated with an increase in the underlying level of airway hyper-responsiveness such that individuals may showcontinuing episodes of asthma on subsequent days28.
ETIOLOGY:
Etiology factors of asthma are of two types. Some factors, called inducing factors cause initial development of asthma, whereas some other factors provoke an episode inpredisposed individuals suffering from asthma and these are called provoking factor or triggerfactors29.
INDUCING FACTORS: Genes:
Genetic factors are important inducing factors, where atopic individuals go in to risk factor for developing allergic asthma. A distinct gene for atopy on chromosome 5q,11q and 12q has been identified30.
PREDISPOSING FACTORS: Allergens:
commonest allergen. Pollens, molds, animal dander and cockroaches are other common allergens provoking asthma. This typeof asthma is named as ‘allergic asthma’.
Infection:
It is well recognized that viral infections commonly cause attacks of asthma. Secondary bacterial infection is widely held to occur and perpetuate the inflammatory reactions which give rise to prolonged airway narrowing31.
Environment:
Many patients with allergic asthma experience worsening of symptoms on contact with cigarette smoke, car exhaust fumes, strong perfumes or high concentrations of dust in atmosphere.
Allergic asthma exacerbations increase in both summer and winter, air pollution, episodes associated with climate temperature inversions, NO2 in presence of high concentrations in summer, No2 and So2 in the winter32.
Occupation:
cells. This is called occupational asthma. It is characterized by a cyclic history, with symptoms becoming prominent towards the end of a work shift and an increase of symptoms after leaving the work site33.
Exercise:
It is provoked by various forms of exercise such as running or climbing stairs34.
Food:
Among Indians, ice and cola drink are reported to be more sensitive and causes bronchoconstriction. In some cases egg, milk and wheat also act as a triggering factor for allergic asthma35.
Psychological Factors:
It is well known emotional factors may been influence asthma, but there is no evidence that patients with the disease are any more psychologically disturbed than theirnon-asthmatic peers36.
Nocturnal:
Drugs:
Beta blocking drugs, cholinergic drugs used for myasthenia gravis, and Prostaglandins (PGF2) usedforinducingabortion and drug induce gastritis areknowntoinduced bronchoconstriction37.
NON ATOPIC ASTHMAOR IDIOSYNCRATIC ASTHMA38:
It also called as Intrinsic or late – onset asthma.
A significant fraction of patients with asthma present with no family or personal history of allergy, with skin tests was negative and with normal serum levels of IgE and therefore have disease that cannot be classified on the basis of currently defined immunological mechanisms. These patients are said to have idiosyncratic asthma or non-Atopic asthma.
Non-Atopic asthma, is divided into two groups
i. Mechanical obstruction groups ii. Bacterial infection groups
5. Pathophysiology:
The complex mechanisms involved in pathophysiology of asthma include:
1. Airway inflammation
2. Intermittent airflow obstruction 3. Airway hyper responsiveness
Asthma Pathogenesis
Airway obstruction is mainly due to
Edema and inflammation reponses of mucous membrane lining the airways
Increased secretions of mucus and inflammatory cells Contraction in the smooth muscles of bronchi
Airway obstruction is usually diffuse but not uniform. In many adults with asthma, both larger and smaller airways are obstructed, though some patients may have exclusive smaller airway disease.
Airway obstruction results in increased resistance to airflow and decreased flow rates contributing to hyperinflation. Overinflated lungs compensate for pulmonary obstruction to some extent, but when the tidal volume exceeds the pulmonary dead space, it leads to alveolar hypoventilation.
The pulmonary blood flow is affected in hyperinflation because of increased intra alveolar and intra pleural pressure leading to uneven pulmonary circulation. Thus increased intra alveolar pressure along with
Ultimately all these factors contribute to the development of hypoxia. CO2 retention occurs only in the later stages when the obstruction is more severe.
HYPERSENSITIVITY
Immunologic tissue injury in response of allergen exposure. Classified in to following types are
1) Type 1 immediate or reaginic 2) Type 2 cytotoxic
3) Type 3 IgG or IgM mediated
4) Type 4 antibody dependent cell mediated cytotoxicity 5) Type 5 stimulatory/ blocking reactions
Type 1 Hypersensitivity pathophysiology
Clinical classification
Four groups based on frequency of symptoms,number of time emergence visit and hospitilization, severity of attack and pulmonary function tests abnormality
1) Intermittent asthma
2) Persistent asthma
3) Acute exacerbation: mild, moderate, severe asthma,
4) Specialvariants: there are 5 types
a) Cough variant asthma
b) Exercise induced asthma,
c) Occupational asthma,
d) drug-induced asthma (aspirin, other NSAID, beta blocker
Pathophysiological mechanisms at the level of molecule:
Inhalation of allergens leads to biphasic response by early and late phases
EARLY LATE
1.Occurs in 30 min-2 hour
2.Mast cell degranulation and release of preformed mediators
3.Histamine, LTC4, D4, E4, Platelet
Activating factor.
4.Broncho constriction
1. Occurs in 6-8 hrs.
2. Release of cytokines & newly generated
Mediators.
3.Eosinophilic cationic protein,
eosinophilic chemotactic factor.
4. Continued airway hyper responsiveness,
Mucus secretion and
6. Diagnosis of asthma:
CLINICAL EVALUATION OF ASTHMA:
HISTORY:
The key to the detection and clinical evaluation of asthma is a careful history. Notonly can the physician usually elicit a description of symptoms that are sufficiently characteristic to make a diagnosis, but it may be possible to obtain important information about agents that is responsible for worsening symptoms, so that they can be avoided.
Physician also establishes trusting relationship with the patient, so that therapeuticprogram will be followed by the positive effect of the physician’s optimism and reassurance.
PRESENTING SYMPTOMS:
symptoms mainly wheezing and breathing difficulty, nocturnal cough in asthma patients.
Dyspnoea:
Shortness of breath is extremely common but not invariable complaint of patients with asthma. It is likely related to the scene of effort for ventilation and function of the severity of airway obstruction. Dyspnoea is paroxysmal and most commonly occur late night. The patient may be restless agitated, anxious, sweating, orthopnoic and tachypnoeic, breathing through pursed lips with a prolonged expiration and using accessory muscles of respiration.
Wheeze:
The high velocity of flow through narrowed large airways produces wheeze which is often first audible to the physician. Many patients may not have wheeze during periods of asthma, but its absence should not exclude consideration of diagnosis.
Tightness:
excessive activity of the vagal receptors known to be a fundamental feature of asthma.
Cough:
Cough is usually non-productive, frequently associated with expectoration ofmucoid sputum, at times quite frothy and liquid.
Upper Airways Symptoms:
Although asthma is primarily a disorder of the intrathoracic airways, some patients do indicate that their symptoms originate in the region of larynx. There are evidences that this is narrowing of the extra thoracic upper airways in asthma and that may contribute to the reduction of inspiratory and expiratory flow rate. Although this may not be a frequent cause of flow limitation in patients, inspiratory stridor may be present in asthma or may be the presenting complaint and needs to be evaluated.
ACUTE SEVERE ASTHMA / STATUS ASTHMATICUS:
supervene without warning. The attacks usher in either as progressive worsening of an existing paroxysm or sudden onset of severe dyspnoea and air hunger in a mild or moderate asthmatic.
Widening of intercostal spaces, decrease in lateral expansion of the chest, tachynoea, tachycardia and fatigue are features of asthma during attack. And decrease in cardiac output, pulses paradoxus, tachycardia, hypoxemia, respiratory acidosis are features of asthma during severe attack.
Physical Examination:
i) Position of patient in which shoulder girdle is fixed.
ii) Accessory respiratory muscles are actively involved in respiration.
iii) The chest is held in near to end inspiratory position.
iv) Percussion note may be unaltered or it may become hyper resonant with Progression of disease.
v) Breath sounds will be obscure with lots of added sounds, rhonchi.
vi) Expiration will be prolonged.
CHRONIC ASTHMATIC:
(i) Chest is barrel shaped (ii) Shoulders are rounded,
(iii) Usually the patient is of small stature,
(iv) Usually the patient breathes from his mouth,
(v) He/She is a daily wheezer (He coughs more at night with varying amounts of mucous and plugs).
LABORATORY INVESTIGATION:
Blood for Absolute Eosinophil Count:
It one of components of white blood cells is called eosinophils, in the blood, where there is increase in eosinophils in the circulating blood is called eosinophilia.it ranges from 1-6% of eosinophils and 40-450/cumm of absolute eosinophil count40.
It is calculated by percentage of eosinophils multiplied by the white blood cell count to give the absolute eosinophil count.
Significance:
Other blood investigations finding includes,
Leucocytosis, indicates infection, serum IgE levels will also be high. But these are not specific for asthma, until and unless other infections are ruled out.
Sputum Examination:
A wet preparation of sputum of many asthmatic patients contains spiral casts (Curschmann’s spirals), eosinophilia and Charcot Leyden crystals. Presence of sputumand blood eosinophilia is suggestive of the diagnosis of asthma41.
X-ray chest:
Usually normal x-ray
It may show hyper-inflation. It also reveals complications of severe asthma such As Rib fracture, Pneumothorax and Pneumo mediastinum.
Arterial blood gas Analysis:
Pulmonary Function Test42:
It’s also lung function test are useful in assessing the functional status of the respiratory system both in physiological and pathological condition.
Types
1) Static lung function tests
Based on volume of air that flow in to or out of lungs.
2) Dynamiclung function test
Based on time ,i.e. the rate at which air flows into or out of lungs.
LUNG VOLUMES:
1) Tidal volume
2) Inspiratory reserve volume 3) Expiratory reserve volume 4) Residual volume
LUNG CAPACITIES:
1) Inspiratory capacity 2) Vital capacity
Spirogram :
It is the graphical record of lung volumes and capacities using spirometer. Upward deflection of the spirogram denotes inspiration and the downward curve indicates expiration.
Disadvantages :
Volume, which cannot be measured by spirometry, is the residual volume.
Plethysmography
It is a technique used to measure all the lung volumes and capacities.
Measurement of functional residual capacity and residual volume:
1) Helium dilution technique 2) Nitrogen washout method
During the attack, the lung volume is reduced; with a decrease in the forced vitalcapacity (FVC); the maximal mid expiratory flow rates (MMF) and the forced expiratory volume in one second (FEV1).The FEV1 / FVC ratio is usually less than 75%. The RV/TLC ratio increased owing to air trapping.
1. Skin Sensitivity Testing’s:
These tests are done to find out the possible allergens to which he or she is Allergic. A small quantity of allergen is put on skin which is pricked. In positive cases, a wheal is seen at the site after 20-40 minutes of introduction of the allergens in minute doses, in skin by pricking the skin.
2. Radio-Allergosorbent Test (R.A.S.T.):
The importance of these tests comes to play when dermal reactivity tests are Inconclusive. In allergic individuals, the levels of IgE are raised, when exposed to allergens. When skin reactivity tests are inconclusive, one can come to significant Conclusion by measuring IgE specific to individual allergens by RAST.
3. Challenge tests:
a. Allergen / antigen challenge tests:
These tests are done in emergency. The antigens are introduced through inhalation with the help of a nebulizer. Within few minutes (7 to 15 minutes) in positive cases, there will be a fall of 20% or more in FEV1 PEFR indices.
b. Exercise challenge tests:
In positive cases there is a decrease in FEV and PEFR indices after physical Exercises. This decrease is of about 20% of more and is maximal 5-10 minutes, after exercise and recovers to normal over a course of time of 30-60 minutes13.
Though asthma is diagnosed by clinical symptomatology, lung function tests are helpful in supporting the diagnosis in doubtful cases and also for monitoring the control of asthma.
Grading and classification of Asthma:
1. Grading of Severity of Asthma
Grading can be done based on
(1) Symptoms of air flow obstruction
(2) Night symptoms
Based on the severity, asthma can be graded as:
Grade 1: Mild intermittent asthma
Grade 2: Mild persistent asthma
Grade 3: Moderate persistent asthma
Grade 4: Severe persistent asthma
Classification based on severity43 GINA
Classification Days with Symptoms
Nights with
symptoms PEFR
PEFR variability (%)
Mild intermittent
<2/week <2/month >80% <20%
Mild persistent >2/week
but <1/day >2/month >80% 20-30% Moderate
persistent
Daily >1/week 60-80% >30%
Severe persistent
Continuous Frequent <60% >30%
Assessment and monitoring
1. Asthma Clinic examination 2. Lung function testing • Spirometry
• Peak expiratory flow monitoring
PEFR is the maximum flow rate generated during a forceful expiration. PEFR primarily reflects large airway flow. FEV over one second is a dynamic measure of flow used in formal spirometry. Although peak flow rate usually correlate well with FEV1,this correlation decreases in patients with asthma as airflow limitation is diminishes.
Daily PEFR monitoring may assist the early changes in asthma that may require therapy, evaluating responsiveness to changes in therapy and giving a quantitative measurement of improvement.
PEFR was pioneered by Martin Wright for assessing lung function.
should be noted as the final value. Variation in PEF >20% between morning and evening value is consistent with the diagnosis of asthma.
Procedure for using Peak Flow Meter:
1. Move the indicator to the bottom of the numbered scale.
2. Patient is asked to stand up and take a deep breath,airflow filling the lungs
3. Mouth piece is placed in the mouth and the patient is asked to firmly close his lips around it without putting the tongue inside the hole.
4. Then the patient is asked to blow out as hard and fast as possible in a single blow. The value should be written down. The steps 1 to 4 should be repeated 2 more times to get the personal best peak flow reading
Predicted PEFR values according to height in male:
Ht (cm) PEFR(Lt/min)
Boys Ht (cm)
PEFR(Lt/min)
Boys Ht (cm)
PEFR(Lt/min) Boys
101 120 134 235 167 351
102 123 135 239 168 354
103 127 136 242 169 358
104 130 137 246 170 361
105 134 138 249 171 365
106 137 139 253 172 368
107 141 140 256 173 372
108 144 141 260 174 375
110 148 142 263 175 379
111 151 143 267 176 382
112 155 144 270 177 386
113 158 145 274 178 389
114 162 146 277 179 393
115 165 147 281 180 396
116 169 148 284 181 400
117 172 149 288 182 403
118 176 150 291 183 407
119 179 151 295 184 410
120 183 152 298 185 414
121 186 153 302 186 417
122 190 154 305 187 421
123 193 155 309 188 424
124 197 156 312 189 428
125 200 157 316 190 431
126 204 158 319 191 435
127 207 159 323 192 438
128 211 160 326 193 442
129 214 161 330 194 445
130 218 162 333 195 449
131 221 163 337 196 452
132 225 164 340 197 456
133 228 165 344 198 459
Predicted PEFR values for according to height in female
Ht (cm) PEFR (lt/min)
Girl Ht (cm)
PEFR (lt/min)
Girl
Ht (cm) PEFR (lt/min)
Girl
101 116 134 225 167 334
102 120 135 229 168 337
103 123 136 232 169 341
104 126 137 235 170 344
105 130 138 238 171 347
106 133 139 242 172 351
107 136 140 245 173 354
108 139 141 248 174 357
110 143 142 252 175 361
111 146 143 255 176 364
112 149 144 258 177 367
113 153 145 262 178 370
114 156 146 265 179 374
115 159 147 268 180 377
116 163 148 271 181 380
117 166 149 275 182 384
118 169 150 278 183 387
119 172 151 281 184 390
120 176 152 285 185 394
121 179 153 288 186 397
122 182 154 291 187 400
123 186 155 295 188 403
124 189 156 298 189 407
125 192 157 301 190 410
126 196 158 304 191 413
127 199 159 308 192 417
128 202 160 311 193 420
129 205 161 314 194 423
130 209 162 318 195 427
131 212 163 321 196 430
132 215 164 324 197 433
133 219 165 328 198 436
Asthma were divided into three groups depending on levels of control (GINA guidelines 2012)
Characteristics Controlled (All of the following)
Partly controlled (Any measure
present)
Uncontrolled
Daytime symptoms None (twice or less/week) More than twice/week Three of more features of partly controlled Limitation of activities None Any
Nocturnal symptoms /awakening
None Any
Need for reliever/ rescue treatment
None (twice or less/week)
More than twice/week Lung function (PEFR) Normal <80%predicted or
personal best(if known)
7. Role of EOSINOPHIL in Asthma
Chronic airway inflammation as evidences by cellular infiltration of airway by activated t lymphocytes, mast cells and macrophages and mainly eosinophils and other mediators. Eosinophils are white blood cells and immune system components responsible and also control mechanisms associated with allergy and asthma.
approximately more than 200 large granules containing enzymes and proteins with variable functions.
Eosinophils are one of the components of white blood cell, where there is increase in eosinophils in the circulating blood called eosinophilia.it ranges from 1-6% of eosinophils and 40-450/cu mm of absolute eosinophil count.
It is calculated by percentage of eosinophils multiplied by the white blood cell count to give the absolute eosinophil count.
Eosinophils increased in parasite infection, allergy, asthma, etc. Its are response for disintegration, detoxification, removal of foreign proteins and other inflammatory responses.
Mechanism of action of eosinophils
Eosinophils are neither markedly motile nor phagocytic like the neutrophils. Still eosinophil attack them by some special type of cytotoxic substances present in their granules. The lethal and released at the time of exposure to parasite or foreign protein are
2) Major basic protein (MBP): Very active against helminths.its causing distension (ballooning) and detachment of tegumental sheath (skin like covering) of these organisms.
3) Eosinophil cationic protein (ECP): This substance is major destroyer of helminths and 10 times more toxic than MBP. It’s also neurotoxin.
4) Eosinophil-derived neurotoxin: its destroys the nerve fibre mainly myelinated nerve fibers.
5) Cytokine: like IL-4,IL-5 accelerate inflammatory responses.
Mechanism of eosinophil:
8. Management of asthma:
Goals of therapy:
Themain goals for the prevention and management of asthma are as follows:
2. Maintaining nearly normal pulmonary function.
3. Maintaining normal activity levels (including exercise).
4. Preventing recurrent exacerbation and minimizing the need
for emergency care and hospitalization.
Successful management of asthma patient depends on various factors
2. Asthmatic have varying degrees of symptomatology at different points of time hence a close monitoring is required for appropriate adjustment of therapy.
Management of asthma practically divided into two parts
A. Non pharmacological therapy B. Pharmacological therapy
A. Non pharmacological therapy
Recent studies suggest that educating the patient /parent about the disease along with measures to implement environmental control programs are very effective in reducing asthma morbidity and mortality.
Education:
Counselling the patients about nature of the disease and the importance of compliance for its successful management has rendered fruitful results.
Environmental control:
Vaccination:
Inactivated influenza vaccine may safely be given to asthmatic , in order to reduce asthma exacerbations.
Immunotherapy:
Allergen immunotherapy also appears to be of benefit in some patients with defined allergic triggers.
Pharmacological therapy
Medications
1. Corticosteroids
Inhaled corticosteroids are the mainstay of treatment for long term control of asthma. Glucocorticoids are not bronchodilators but reducing bronchial hyperreactivity, inflammatory effect like antigen: antibody reaction, mucosal edema, other trigger stimuli
Inhaled corticosteroids (ICS):
Systemiccorticosteroids:
hydrocortisone, prednisolone, dexamethasone,etc
it’s useful in severe chronic asthma, statusasthmaticus/acute severe asthma
2. Leukotriene antagonists.
It is usually given as an add on therapy with low dose ICS in insufficiently controlled patients. Drugs are Montelukast, Zafirlukast,
3. Short acting and Long acting inhaled beta 2 agonists
Short durations are epinephrine, isoetharine, isoproterenol
Intermediate duration are salbutamol, terbutaline, metaproterenolalbuterol, pirbuterol, bitolterol, fenoterol, etc.
long duration are salmeterol, formoterol, etc.
4. AntiIgE (omalizumab)
This recently introduced drug is shown to be effective in moderate and severe persistent asthma .dose 30-700 iu/ml based on IgE level
5. methylxanthines
a. oral theophylline b. IV Aminophylline 6. Anticholinergics:
Ipratropium bromide by MDI,mainly useful in drug induced asthma e.g. Beta blockers
7. Lipoxygenase inhibitor:
Zileuton 600mg qid reserved for severe asthma. 8. Alternative medication:
Methotrexate, cyclosporine, tacrolimus, mycophenolate mofetil,
Reliever medications:
Pregnant Women
Pregnant women with asthma must control the disease and ensure a good supply of oxygen to their babies. Poor asthma control also the risk of preeclampsia, and also develops high blood pressure and proteinuria.
Differential diagnosis for asthma:
1) Its may be Airway Foreign Body, but localized sign and symptoms 2) Its may be Allergic reaction
3) Its may be Alpha1-Antitrypsin Deficiency, its main associated with COPD
4) Aspergillosis,fungal infection with high eosinophil levels
5) Bronchiectasis, Its associated with productive sputum with postural Chances and signs
6) its can be Bronchiolitis
7) Chronic Obstructive Pulmonary Disease, similar to asthma. 8) its may be Churg-Strauss Syndrome
9) its can be Cystic Fibrosis
10) Gastrooesophageal Reflux Disease, main associate with peptic ulcer diseases
11) Heart Failure its associate with sign and symptoms
12) Pulmonary Embolism its associate with cardiac or renal or other precipitating factors
13) its may be Pulmonary Eosinophilia associated with increased eosinophils count, sputum eosinophilia, worm infection
AIM OF THE STUDY
Aim:
MATERIALS AND METHODOLOGY
a) Study design:
Cross sectional study
b) Place:
Asthma Clinic,
Govt Royapettah Hospital,
Kilpauk Medical College, Chennai c) Period of study:
April 2014 to September 2014
d) Study population:
Aged 18 to 75 years attending asthma clinic.
e) Sample size: 40 patients
f) Inclusion criteria:
All patients with asthma, aged 18 to 75 years.
g) Exclusion criteria:
1. pulmonarytuberculosis, drug allergy patients,
3. Immunocompromide state,
4. cardiac failure, pulmonary edema, pulmonary embolism, COPD,
5. Systemic Fungal infection, worm infestation, etc
h) Methodology:
1. All asthma patients aged between 18 to 75 years .
2. Detailed history and clinical examination was done.
3. Peak expiratory flow rate (PEFR) was measured by using peak flow meter.
4. Asthma control was assessed based on the parameters of GINA guidelines.
5. Informed consent was obtained and blood samples were taken for measuring serum absolute eosinophil count.
6. Under strict aseptic precautions, 5 ml of venous blood was drawn.
7. Absolute eosinophils count in peripheral blood.
i) Statistical analysis
1. One way Anova followed by TUKEYHSD method for quantitative variables
2. Chi square test for qualitative variable
3. Correlation was done.
PROFORMA
1. SR. No.
2. Name:
3. Age:
4. Sex:
5. Address:
6. Occupation
7. Chief Complaints:
i. Cough /wheeze
ii. Nighttime symptoms and awakening iii. Daytime symptoms
iv. Limitation of activities
v. Need for reliever medications
8. Similar complaints in the past:
9. Hospitalisation: ----times
11. Seasonal variation: Yes/No
12. Sleep disturbed due to cough, breathlessness: Yes/No
13. Nature of attack: After exercise/ Cough/ Cold/ Associated with
fever.
14. Associated conditions: Rhinosinusitis/ GERD/ obesity
15. Socio economic condition
16. Precipitating factors
Allergen
Indoor : Domestic mites, cockroach,
Furredanimals (dogs, cats, mice)
Outdoor: Pollens, fungi, molds, yeasts Infections (predominantly viral)
Occupational
Diet
Tobacco smoke (active and passive)
Indoor/outdoor air pollution
Strong odours(perfumes), Smoke, mosquito repellents
GENERAL EXAMINATION
- Built & nourishment:
- Height: weight: BMI:
- P/I/CY/CL/LN/PE
- VITALS- PR.BP,RR,TEMPERATURE
SYSTEMIC EXAMINATION
RESPIRATORY SYSTEM Inspection :
Palpation : Percussion : Auscultation:
Cardiovascular system Central nervous system Abdominal system 18. Investigations:
X – Ray chest
Spirometry /PEFR
ECHO
Sputum microscopic exam
Absolute eosinophil count
19. Asthma medications
RESULTS
Chart : 1 - Sex distribution with level of asthma control
Levels of Asthma Control
Total Uncontrolled Partly controlled Controlled S ex Male
Count 6 5 10 21
% within
Sex 28.6% 23.8% 47.6% 100.0%
% within Levels of Asthma Control
50.0% 41.7% 62.5% 52.5%
F
e
male
Count 6 7 6 19
% within
Sex 31.6% 36.8% 31.6% 100.0%
%with in levels of
Asthma control
50.0% 58.3% 37.5% 47.5%
Total
Count 12 12 16 40
% within Sex 30.0% 30.0% 40.0% 100.0%
% within Levels of Asthma
Control
Totally 40 patients, male 21, female 19 uncontrolled asthma 6 for
male 6 for female. Partly controlled male 5, female 7.
Impression: Absolute eosinophil count more than 450 cells per
cumm seen in 2/3 of patients. (uncontrolled and partially controlled).
Sex wise difference: male-sum of uncontrolled and partly
controlled(11) equal to controlled group(10).Female- sum of uncontrolled
and partly controlled (68%)(13) 2 times greater than controlled group(6)
Chart 2 : Chi-Square Tests
Value Df Asymp. Sig.
(2-sided)
Pearson Chi-Square 1.236(a) 2 .539
Likelihood Ratio 1.246 2 .536
Linear-by-Linear
Association .511 1 .475
N of Valid Cases 40
A 0 cells (.0%) have expected count less than 5. The minimum expected count is 5.70.
Chart 3 : This show male ,female sex with levels of asthma control
Sex
Female Male
Count
11
10
9
8
7
6
5
4
Levels of Asthma Con
Uncontrolled
Partly controlled
Chart - 4 : This show socio economic status with levels of asthma control Equal in both social economic status.
Levels of Asthma Control
Total Uncontro lled Partly controlled Contr olled Soci o ec o n omi c s tat us L ow
Count 8 5 7 20
% within Socio economic status
40.0% 25.0% 35.0% 100.0%
% within Levels of Asthma Control
66.7% 41.7% 43.8% 50.0%
H
igh
Count 4 7 9 20
% within Socio economic status
20.0% 35.0% 45.0% 100.0% %within levels of
asthma control 33.3% 58.3% 56.3% 50.0%
Total Count 12 12 16 40
% within Socio economic status
30.0% 30.0% 40.0% 100.0%
% within Levels of Asthma Control
100.0% 100.0% 100.0
% 100.0%
Chart 5 : Chi-Square Tests
Value df Asymp. Sig. (2-sided)
Pearson Chi-Square 1.917(a) 2 .384
Likelihood Ratio 1.945 2 .378
Linear-by-Linear
Association 1.272 1 .259
N of Valid Cases 40
Chart 6 : This show level of asthma control with low and high social economic status. High social economic and low social economic are
equal disturbance with level of asthma control
Socio eosinomic status High Low
Count
10
9
8
7
6
5
4
3
Levels of Asthma Con
Uncontrolled
Partly controlled
Chart 7 : This tables show relation between Precipitating factor with Levels of Asthma Control
Levels of Asthma Control
Total Uncontrol led Partly controlled Control led Nil
Count 0 5 8 13
% within
Precipitating factor .0% 38.5% 61.5% 100.0%
% within Levels of
Asthma Control .0% 41.7% 50.0% 32.5%
Pet an
ima
ls
Count 3 3 4 10
% within
Precipitating factor 30.0% 30.0% 40.0% 100.0%
% within Levels of
Asthma Control 25.0% 25.0% 25.0% 25.0%
Vir
al infectio
ns
Count 2 1 1 4
% within
Precipitating factor 50.0% 25.0% 25.0% 100.0%
% within Levels of
Asthma Control 16.7% 8.3% 6.3% 10.0%
Mosqu
ito re
pell
ents
Count 3 1 2 6
% within
Precipitating factor 50.0% 16.7% 33.3% 100.0%
% within Levels of
Asthma Control 25.0% 8.3% 12.5% 15.0%
Pollens % within
Precipitating factor 50.0% 33.3% 16.7% 100.0%
% within Levels of
Asthma Control 25.0% 16.7% 6.3% 15.0%
Smoke
Count 1 0 0 1
% within
Precipitating factor 100.0% .0% .0% 100.0%
%with in levels of
asthma control 8.3% 0% 0% 2.5%
Total
Count 12 12 16 40
% within
Precipitating factor 30.0% 30.0% 40.0% 100.0%
% within Levels of
Asthma Control 100.0% 100.0% 100.0% 100.0%
This chart show precipitating factor with asthma control. Precipitating factors are pet animals, mosquito repellants, viral infections, pollens, smoke.
1) pet animals - 10(3*3*4)(25%)
2) mosquito repellents - 6(3*1*2)(15%)
3) viral infections - 4(2*1*1)(10%)
4) pollens - 6(3*2*1)(15%)
5) smoke - 1(1*0*0)(2.5%)
Out of 40 patients,
1) 27 had precipitating factors (67.5%),
CHART 8 : Chi-Square Tests
Value df
Asymp. Sig. (2-sided)
Pearson Chi-Square 11.704(a) 10 .305
Likelihood Ratio 15.419 10 .118
Linear-by-Linear
Association 8.182 1 .004
N of Valid Cases 40
A 17 cells (94.4%) have expected count less than 5. The minimum expected count is .30.
CHART 10 : This show allergens 67.5%, nil precipitating factor 12.5%, Allergen mainly pet animals in city cultures compares with
rurals (25%) Precipitating factor Sm oke Polle ns Mos quito repe llants Vir al infe ctins Pet an imal s Nil Count 10 8 6 4 2 0
Levels of Asthma Con
Uncontrolled
Partly controlled
CHART 11 : This table show X ray chest with Levels of Asthma Control.
Levels of Asthma Control
Total Uncontrol led Partly controlled Controlle d C hes
t x r
ay
N
o
r
mal
Count 4 12 16 32
% within X ray chest
12.5% 37.5% 50.0% 100.0%
% within Levels of Asthma Control
33.3% 100.0% 100.0% 80.0%
Hype
rin
fla
tion
Count 8 0 0 8
% within X ray chest
100.0% .0% .0% 100.0%
% with in levels of asthma control
66.7% .0% .0% 20.0%
Total
Count 12 12 16 40
% within X ray chest
30.0% 30.0% 40.0% 100.0%
% within Levels of Asthma Control
Chart 12 : Chi-Square Tests
Value Df Asymp. Sig. (2-sided)
Pearson Chi-Square 23.333(a) 2 .000
Likelihood Ratio 24.756 2 .000
Linear-by-Linear
Association 17.098 1 .000
N of Valid Cases 40
A 3 cells (50.0%) have expected count less than 5. The minimum is 2.40.
CHART 13 : This show relation between x ray chest and level of asthma control.
Normal x ray chest - 32(80%)
Hyperinflation chest x ray- 8(20%) mainly uncontrolled patients
Normal chest x ray had 32 mainly controlled group-16(40%),partly controlled -12(30%)uncontrolled -4 (10%)
X ray chest
Hyperinflation Normal
Count
18
16
14
12
10
8
6
4
2
Levels of Asthma Con
Uncontrolled
CHART14 : Sputum microscopic examination with Levels of Asthma Control
Levels of Asthma Control
Total Uncontrolled Partly controlled Controlled Sputum exam inatio n Nor mal
Count 1 0 11 12
% within Sputum microscopic
8.3% .0% 91.7% 100.0%
% within Levels of Asthma Control
8.3% .0% 68.8% 30.0%
Eo
snophils
Count 11 12 5 28
% within Sputum microscopic
39.3% 42.9% 17.9% 100.0%
% with in level of asthma control
91.7% 100.0% 31.3% 70.0%
Total Count 12 12 16 40
% within Sputum microscopic
30.0% 30.0% 40.0% 100.0%
% within Levels of Asthma Control
Chart - 15 : Chi-Square Tests
Value df
Asymp. Sig. (2-sided) Pearson Chi-Square
19.266(a) 2 .000
Likelihood Ratio 22.110 2 .000
Linear-by-Linear
Association 13.027 1 .000
N of Valid Cases 40
3 cells (50.0%) have expected count less than 5. The minimum expected count is 3.60.
CHART 16 : This show relation between sputum microscopic examinations with level of asthma control
1) normal sputum examination -12 (30%) mainly controlled group(27.5%)
2) Sputum eosinophilia - 28(70%)
A) Controlled group - 5 (12.5%)
B) Partly controlled group - 12 (30%)
C) Uncontrolled group - 11 (27.5%)
Sputum microscopic Eosinophils Normal C ount 14 12 10 8 6 4 2 0
Levels of Asthma Con
CHART 17 : This table show ECHO with Levels of Asthma Control
Levels of Asthma Control
Total Uncontrolled Partly controlled Controlled ECHO N ormal
Count 6 12 16 34
% within
ECHO 17.6% 35.3% 47.1% 100.0%
% within Levels of Asthma Control
50.0% 100.0% 100.0% 85.0%
Mi ld p ulm o na ry h yp er te n si
on Count 6 0 0 6
% within
ECHO 100.0% .0% .0% 100.0%
% within levels of asthma control
50.0% .0% .0% 15.0%
Total
Count 12 12 16 40
% within
ECHO 30.0% 30.0% 40.0% 100.0%
% within Levels of Asthma Control
100.0% 100.0% 100.0% 100.0%
Table 17 : Chi-Square Tests
Value df
Asymp. Sig. (2-sided)
Pearson Chi-Square 16.471(a) 2 .000
Likelihood Ratio 17.181 2 .000
Linear-by-Linear
Association 12.069 1 .001
N of Valid Cases 40
3 cells (50.0%) have expected count less than 5. The minimum expected count is 1.80.
CHART - 18
ECHO 1) Normal study - 34 (85%)
2) mild pulmonary HT - 6 (15%) mainly uncontrolled group
ECHO
Mild pulmonary hyper Normal
Count
18
16
14
12
10
8
6
4
Levels of Asthma Con
Uncontrolled
Partly controlled
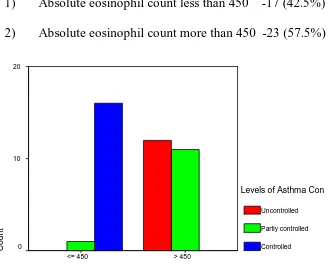
CHART 19 : Absolute eosinophil count with Levels of Asthma Control
Levels of Asthma Control
Total Uncontr olled Partly controlled Controlle d ABS OLUTE EOSINO P H IL C OUNT < 45 0
Count 0 1 16 17
% within Absolute eosinophil count
.0% 5.9% 94.1% 100.0%
% within Levels of Asthma Control
.0% 8.3% 100.0% 42.5%
> 45
0
Count 12 11 0 23
% within Absolute eosinophil count
52.2% 47.8% .0% 100.0%
%within levels of asthma
control 100.0% 91.7%% 0% 57.5%
Total Count 12 12 16 40
% within Absolute eosinophil count
30.0% 30.0% 40.0% 100.0%
% within Levels of Asthma Control
Table 20 : Chi-Square Tests
Value df Asymp. Sig. (2-sided)
Pearson Chi-Square 36.249(a) 2 .000
Likelihood Ratio 47.664 2 .000
Linear-by-Linear
Association 29.560 1 .000
N of Valid Cases 40
0 cells (.0%) have expected count less than 5. The minimum expected count is 5.10.
CHART - 21
These show 40 patients had
1) Absolute eosinophil count less than 450 -17 (42.5%)
2) Absolute eosinophil count more than 450 -23 (57.5%)
Absolute eosinophil count
> 450 <= 450
Count
20
10
0
Levels of Asthma Con
CHART 18
One way Descriptive
Age in years
N Mean Std.
Deviation Std. Error
95% Confidence Interval for Mean
Minimum Maximum
Lower Bound
Upper Bound
Uncontrolled 12 34.33 8.574 2.475 28.89 39.78 23 52
Partly
controlled 12 33.42 5.418 1.564 29.97 36.86 22 42
Controlled 16 37.44 10.302 2.575 31.95 42.93 20 54
Total 40 35.30 8.549 1.352 32.57 38.03 20 54
ANOVA
CHART 19
Age in years
Sum of
Squares df
Mean
Square F Sig.
Between
Groups 126.879 2 63.440 .862 .431
Within
Groups 2723.521 37 73.609
CHART - 20
One way -Descriptives
Weight in kg
N Mea n Std. Deviatio n Std. Error 95% Confidence Interval for Mean
Mini mum Maxi mum Lower Bound Upper Bound
Uncontrolled 12 63.50 12.072 3.485 55.83 71.17 46 86
Partly
controlled 12 60.67 9.039 2.609 54.92 66.41 44 76
Controlled 16 67.06 10.529 2.632 61.45 72.67 45 80
Total 40 64.08 10.683 1.689 60.66 67.49 44 86
CHART 21
ANOVA
Weight in kg
Sum of
Squares df
Mean
Square F Sig.
Between
Groups 286.171 2 143.085 1.271 .292
Within
Groups 4164.604 37 112.557
CHART 22
Oneway
Descriptives : Height
N Mean Std.
Deviation
Std. Error
95% Confidence Interval for Mean
Minimu m
Maximu m Lower
Bound
Upper Bound
uncontrolled 12 165.75 5.643 1.629 162.16 169.34 156 174
Partly controlled 12 160.50 7.728 2.231 155.59 165.41 146 170
Controlled 16 166.56 4.546 1.136 164.14 168.98 160 174
Total 40 164.50 6.397 1.011 162.45 166.55 146 174
CHART – 23
ANOVA
Height
Sum of
Squares df
Mean
Square F Sig.
Between
Groups 278.813 2 139.406 3.916 .029
Within
Groups 1317.188 37 35.600
CHART - 24 - Post Hoc Tests:Multiple Comparisons -Dependent Variable: Height -Tukey HSD
(I) Levels of Asthma Control
(J) Levels of Asthma Control
Mean Difference
(I-J)
Std. Error Sig.
95% Confidence Interval Lower Bound Upper Bound Uncontrolled Partly
controlled 5.25 2.436 .093 -.70 11.20
Controlled -.81 2.279 .932 -6.38 4.75
Partly controlled
Uncontrolled
-5.25 2.436 .093 -11.20 .70
controlled -6.06(*) 2.279 .030 -11.63 -50
Controlled Uncontrolled .81 2.279 .932 -4.75 6.38
Partly
controlled 6.06(*) 2.279 .030 .50 11.63
The mean difference is significant at the .05 level.
CHART 24 : Homogeneous Subsets Height-Tukey HSD
Levels of Asthma Control N
Subset for alpha = .05
1 2
Partly controlled 12 160.50
Uncontrolled 12 165.75 165.75
Controlled 16 166.56
Sig. .076 .935
CHART 26 : Hospitalisation * Levels of Asthma Control
Levels of Asthma Control
Total Uncontrolle d Partly controlle d Controlle d HOSP ITA LIZA TION
0 Count 0 3 8 11
% within
Hospitalisation .0% 27.3% 72.7% 100.0% % within Levels of
Asthma Control
.0% 25.0% 50.0% 27.5%
1
Count 2 7 8 17
% within Hospitalisation
11.8% 41.2% 47.1% 100.0%
% within Levels of Asthma Control
16.7% 58.3% 50.0% 42.5%
2
Count 3 2 0 5
% within Hospitalisation
60.0% 40.0% .0% 100.0%
% within Levels of Asthma Control
25.0% 16.7% .0% 12.5%
3
Count 7 0 0 7
% within Hospitalisation
100.0% .0% .0% 100.0%
%within level of
asthma control 58.3% .0% 0% 17.5%
Total Count 12 12 16 40
% within Hospitalisation
30.0% 30.0% 40.0% 100.0%
% within Levels of Asthma
CHART 27 : Chi-Square Tests
Value df
Asymp. Sig. (2-sided)
Pearson Chi-Square 29.077(a) 6 .000
Likelihood Ratio 34.448 6 .000
Linear-by-Linear
Association 22.183 1 .000
N of Valid Cases 40
CHART 28
Hospitalisation
3 2
1 0
Count
9
8
7
6
5
4
3
2
1
Levels of Asthma Con
Uncontrolled
Partly controlled
CHART - 29 : Emergency visit * Levels of Asthma Control
Levels of Asthma Control
Total Uncontrolle d Partly controlled Controlled E MERGENCY V ISIT
0 Count 0 2 14 16
% within Emergency
visit .0% 12.5% 87.5% 100.0%
% within Levels of
Asthma Control .0% 16.7% 87.5% 40.0%
1
Count 2 8 2 12
% within Emergency visit
16.7% 66.7% 16.7% 100.0%
% within Levels of
Asthma Control 16.7% 66.7% 12.5% 30.0% 2
Count 8 2 0 10
% within Emergency visit
80.0% 20.0% .0% 100.0%
% within Levels of Asthma Control
66.7% 16.7% .0% 25.0%
3
Count 2 0 0 2
% within Emergency visit
100.0% .0% .0% 100.0%
% within levels of
asthma control 16.7% .0% .0% 5.0%
Total Count 12 12 16 40
% within Emergency visit
30.0% 30.0% 40.0% 100.0%
% within Levels of Asthma
CHART 30 : Chi-Square Tests
Value df Asymp. Sig.
(2-sided)
Pearson Chi-Square 40.514(a) 6 .000
Likelihood Ratio 44.226 6 .000
Linear-by-Linear
Association 27.746 1 .000
N of Valid Cases 40
11 cells (91.7%) have expected count less than 5. The minimum expected count is .60.
CHART 31
Emergency visit
3 2
1 0
Count
16
14
12
10
8
6
4
2
0
Levels of Asthma Con
Uncontrolled
Partly controlled
CHART 32 : Oneway : Descriptives
PEFR
N Mean Std. Deviation
Std. Error
95% Confidence Interval for
Mean Minimum Maximum
Lower Bound
Upper Bound
uncontrolled 12 184.25 15.088 4.356 174.66 193.84 160 200 Partly
controlled 12 260.33 29.137 8.411 241.82 278.85 200 290 Controlled 16 346.56 21.062 5.265 335.34 357.79 310 378 Total 40 272.00 71.877 11.365 249.01 294.99 160 378
CHART 33
ANOVA
PEFR
Sum of
Squares df
Mean
Square F Sig.
Between
Groups 182987.146 2 91493.573
183.01
8 .000
Within
Groups 18496.854 37 499.915
CHART - 34 Post Hoc Tests:Multiple Comparisons
Dependent Variable: PEFR
Tukey HSD
(I) Levels of
Asthma
Control
(J) Levels of
Asthma Control Mean Difference (I-J) Std. Error Sig.
95% Confidence Interval
Lower Bound Upper Bound Uncontrolled Partly controlled
-76.08(*) 9.128 .000 -98.37 -53.80
Controlled
-162.31(*) 8.538 .000 -183.16 -141.47
Partly controlled
Uncontrolled
76.08(*) 9.128 .000 53.80 98.37
Controlled -86.23(*) 8.538 .000 -107.08 -65.38
Controlled Uncontrolled 162.31(*) 8.538 .000 141.47 183.16 Partly
controlled
86.23(*) .8.538 .000 65.38 107.08
CHART 35 : Homogeneous Subsets:PEFR
Tukey HSD
Levels of Asthma Control N
Subset for alpha = .05
1 2 3
Uncontrolled 12 184.25
Partly controlled 12 260.33
Controlled 16 346.56
Sig. 1.000 1.000 1.000
Means for groups in homogeneous subsets are displayed.
a Uses Harmonic Mean Sample Size = 13.091.
b The group sizes are unequal. The harmonic mean of the