A Dissertation on
“ASSESSMENT OF HEARING LOSS IN HIGH RISK INDIVIDUALS
USING HIGH FREQUENCY PURE TONE AUDIOMETRY”
Dissertation submitted to
THE TAMIL NADU Dr.M.G.R. MEDICAL UNIVERSITY
CHENNAI
With partial fulfillment of the regulations For the award of the degree of M.S. OTORHINOLARYNGOLOGY
BRANCH-IV
UPGRADED INSTITUTE OF OTORHINOLARYNGOLOGY
MADRAS MEDICAL COLLEGE
CHENNAI
BONAFIDE CERTIFICATE
This is to certify that this dissertation is a bonafide record of work done by Dr. MANJU JOSEPH on “ASSESSMENT OF HEARING LOSS IN HIGH RISK INDIVIDUALS USING HIGH FREQUENCY PURE TONE AUDIOMETRY”, during her M.S. ENT course from 2011 to April at 2014 UIORL, the Madras Medical College and Rajiv Gandhi Government General Hospital, Chennai. She is appearing for her M.S. Branch-IV Degree examination in April 2014 and her work has been done with partial fulfillment of the regulations of The Tamil Nadu Dr.M.G.R. Medical University, Chennai. I forward this to The Tamil Nadu Dr. M.G.R. Medical University, Chennai, Tamil Nadu, India.
DIRECTOR & PROFESSOR, DEAN
Upgraded Institute of Otorhinolaryngology, Madras Medical College,
Madras Medical College, Rajiv Gandhi Govt. General Hospital Rajiv Gandhi Govt, General Hospital, Chennai - 600 003.
DECLARATION
I solemnly declare that the dissertation entitled “ASSESSMENT OF HEARING LOSS IN HIGH RISK INDIVIDUALS USING HIGH FREQUENCY PURE TONE AUDIOMETRY” is done by me at Madras Medical College, Chennai-3 during October 2012 to October 2013 under the
guidance and supervision of Prof. G. GANANATHAN M.S, DLO., to be
submitted to The Tamilnadu Dr.M.G.R Medical University towards the partial
fulfillment of requirements for the award of M.S DEGREE IN
OTORHINOLARYNGOLOGY BRANCH-IV
DR.MANJU JOSEPH,
Post Graduate, M.S ENT, MMC & RGGGH, Chennai – 600003 Place: Chennai
ACKNOWLEDGEMENT
I owe my great gratitude to Prof. V.Kanagasabai, M.D., The Dean, Madras Medical College, for allowing me to undertake this dissertation, “ASSESSMENT OF HEARING LOSS IN HIGH RISK INDIVIDUALS USING HIGH FREQUENCY PURE TONE AUDIOMETRY” with much avidity.
I would like to express my deep and sincere gratitude to Prof. and Director Dr.G.Gananathan, M.S., D.L.O., Upgraded Institute of Otorhinolaryngology, for guiding me from the very beginning of the study. His constructive comments and personal guidance have provided a good basis for the present thesis.
I am immensely thankful to Prof.Dr.R.Muthukumar, M.S., D.L.O., DNB for the support extended to me. It was from him I learnt how to question thoughts and express ideas.
I am greatly thankful to Prof. Dr.M.K. Rajasekar, M.S. D.LO.,
Upgraded Institute of Otorhinolaryngology, for his immense support throughout this work.
I express my sincere thanks to respected Prof.Dr.G.Selvarajan, M.S. D.L.O., Upgraded Institute of Otorhinolaryngology. He was always willing to help me and give his best suggestions.
I am greatly indebted to all the Assistant Professors, Upgraded Institute of Otorhinolaryngology, for their thoughtful guidance throughout the work.
I thank The Secretary and The Chairman of The Institutional Ethical Committee, Rajiv Gandhi Government General Hospital and Madras Medical College, Chennai.
I thank the team of audiologists of our department for their help in performing this study.
I express my sincere thanks to The Traffic Police Commissioner of Chennai, for his immense support throughout this work.
I would be failing in my duty if I don’t place my sincere thanks to those patients who were the subjects of my study.
ABSTRACT
INTRODUCTION
Exposure to loud noise is the most common cause of sensori neural hearing loss in adults. It is an irreversible type of hearing loss typically affecting higher frequency initially then gradually progressing to lower frequency. NIHL is a preventable type of hearing loss through early intervention. Early detection of hearing loss is possible with the help of high frequency pure tone audiometry which may be undetected by a conventional audiometry.
AIMS OF STUDY
• Early detection of Hearing loss in high risk individuals, exposed to noisy environment
• To compare the efficacy of conventional audiometer with the high frequency audiometer in early detection of hearing loss
• Early intervention and prevention of noise induced hearing loss
• To evaluate the relationship between duration of noise exposure and hearing loss
The study was conducted in the department of otorhinolaryngology Government General Hospital Madras Medical College Chennai 60003. A total of 50 subjects were examined within the age group 25 to 55 years .30 people were traffic police and 20 people were drivers in the Central Chennai exposed to nose of an average of 105dB .All the cases
subjected to PTA, impedance ,OAE,high frequency pure tone audiometry.
RESULTS
- In my study 83% of subject in the age group 30-40years have high frequency hearing loss and 75% cases above the age 40 years have high frequency hearing loss
-82.5% of cases with normal PTA had high frequency hearing loss
-All the subjects with PTA with dip at 4kHz had high frequency hearing loss
-96.5 %of cases have absence of OAE
-There is considerable relation between duration of exposure and hearing loss and it is proven
COCLUSION
By the time hearing loss is detected using conventional audiometry damage has already been affect the speech frequencies. It will affect the verbal communication of the patient and affect the quality of Life .Therefore by using high frequency audiometry early detection of hearing loss in the high frequency can be detected. It will help us to take an early warning to those working in noisy environment to take preventive measures.
KEY WORDS
CONTENTS
1. INTRODUCTION 1
2 . AIMS OF THE STUDY 2 3. REVIEW OF LITERATURE 5 ANATOMY OF LABYRINTH 5 PHYSIOLOGY OF NOISE 26 NOISE INDUCED HEARING LOSS 29 4. MATERIALS AND METHODS 51
5. METHODOLOGY 53
6. RESULTS AND ANALYSIS 55
7. DISCUSSION 69
8. INTERPRETATION OF RESULTS 72 9. BENEFITS TO THE COMMUNITY 73 10. COMPARISON WITH OTHER STUDIES 74
11. CONCLUSION 80
12. BIBLIOGRAPHY 81
13. APPENDIX 82
ABBREVIATION PROFORMA CONSENT FORM
INSTITUTIONAL ETHICAL COMMITTEE CERTIFICATE MASTER CHART
INTRODUCTION
AIMS OF STUDY
• Early detection of Hearing loss in high risk individuals, exposed to noisy environment.
• To compare the efficacy of conventional audiometer with the high frequency audiometer in early detection of hearing loss.
• Early intervention and prevention of noise induced hearing loss.
The degree of hearing loss can range from mild to profound as per WHO grade2 (table 1)and as per biswas 3(table 2). The latter is widely used in India.
Table .1
WHO grades of hearing impairment1 Grades of impairment Audiometric ISO values(average 500,1000,2000,4000Hz) Impairment description
0(no impairment) 25Db HL No or very slight hearing problems. Able to hear whispers 1(slight impairment) 26-40dB HL Able to hear and
repeat words spoken in normal voice at 1 metre
2(moderate impairment)
41-60Dbhl Able to hear and repeat words using raised voice at 1 metre 3(severe
impairment)
61-80dBHL Able to hear some words when shouted into better ear
4(profound impairment)
Table.2
Widely accepted grading2
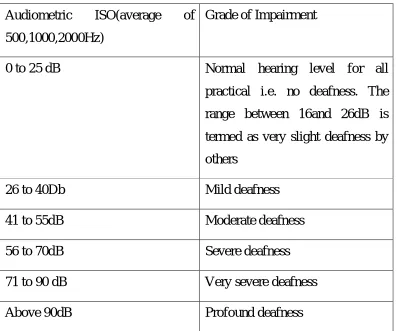
Audiometric ISO(average of 500,1000,2000Hz)
Grade of Impairment
0 to 25 dB Normal hearing level for all practical i.e. no deafness. The range between 16and 26dB is termed as very slight deafness by others
DESCRIPTIVE ANATOMY OF LABYRINTH
REVIEW OF LITETRATURE
ANATOMY OF LABYRINTH
Inner ear lies in the petrous part of temporal bone. Bony Labyrinth consists of cochlea, vestibule, saccule and membranous labyrinth lies within the bony labyrinth. It consists of cochlear duct, utricle, saccule, and three semicircular canals. The space between the inner periosteum of the bony labyrinth and membranous labyrinth is filled with perilymph which is rich in sodium and low in potassium like extracellular fluid. The membranous labyrinth contains endolymph which is rich in potassium and is similar to intracellular fluid .The ionic composition and potentials are essential for the primary function of inner ear because they provide the driving force for mechano transduction. In mammalian cochlea, organ of corti is the receptor organ. It transduces the sound stimuli to electrical signals for transmission to higher auditory pathway .
ULTRA STRUCTURE OF COCHLEA
MEMBRANOUS LABRYNTH
Pillars of corti lie between inner and outer hair cells, which originate from spiral lamina and basilar membrane and converge at the top to form the tunnel of corti. Three rows of outer hairs cells lies lateral to it and supported inferiorly by supporting Deiters cells. Deiters cells has phalangeal process and project apically. Nuels space, a fluid filled space that lies between outer hair cells and phalangeal process of deiters cells. Hensen’s cells and Claudius cells lie lateral to outer hair cells. Reticular lamina is formed by phalangeal cells, phalangeal process of deiter’s cells and superior surface of hair cells.
Reissner’s membrane separates scala media from scala vestibule. It stretches between the bony spiral lamina to the upper part of the lateral wall of cochlear duct. It consists of two layers of cells. Mesothelial layer facing the scala tympani and endothelial layer facing the scala media . The cells within each layer are joined by tight junctions which is impermeable to ions and small molecules.
HAIR CELLS
Schematic depictions of inner (left) and outer (right) hair cells
INNER HAIR CELLS
The stereocilia have dense rootlet and penetrate into apical cuticular plate. The stereocilia are connected together by lateral links and bind them both sideways and across the rows. The synaptic pole is at the basal end and afferent fibers make synaptic contact at the basal end. This region contain vesicle, coated and uncoated membranous tubules.
OUTER HAIR CELLS:
THE LATERAL WALL OF COCHLEAR DUCT.
It consists of three zones, stria vascularis above, spiral prominence below and transitional zone between the two and spiral ligament. Marginal cells facing scala media, intermediate cells and basal cells are the three layers of stria vascularis. Marginal cells have tight junctions connecting highly convoluted membranes of intermediate cells. It helps in maintaining ionic composition of the fluids within the scala media. It contains variety of ion pumps and enzymes.
Tectorial membrane over lays both inner and outer hair cells. It is attached to spiral limbus and loosely connected to supporting cells. The stereocilia of outer hair cells are embedded in the tectorial membrane. It enhances the frequency sensitivity of cochlea .It also contributes to the tonotopic organization of cochlea .They create micro phonics and helps in mechanical amplification.
Endolymphatic fluid is present within the membranous labyrinth. It has high concentration of potassium and low concentration of sodium which is maintained by stria vascularis. The Endolymphatic sac communicates with membranous labyrinth via endolymphatic duct and vestibular aqueduct.
SPIRAL GANGLION
It is located in the Rosenthal Canal. It contains cells bodies of afferent neurons. The dendrites get excited by neurotransmitters released by the organ of corti. There are two types of ganglion neurons namely type I and type II. Type I neurons innervate inner hair cell in a converging pattern while type II neuron innervate outer hair cells in a diverging pattern. The axon of these neurons project to the brain stem. The tonotopic organization of organ of corti is maintained in the afferent system also.
INNERVATIONS OF THE COCHLEA :
human beings and provide ascending information to central auditory pathway.
Cross section of the cochlea showing the passage of the cochlear nerve through the modiolus to the organ of Corti
The low frequency fibers occupy the centre and high frequency fibers occupy the periphery of the nerve.
dorsal and ventral pathways. The dorsal pathway project directly to inferior colliculus and ventral pathway projects to ipsilateral and contra lateral superior olivary complex. This makes binaural comparison of sound possible. SOC helps in sound localization.
Superior olivary complex contains ‘S’ shaped lateral olivary nucleus, medial olivary nucleus, medial nucleus of the trapezoid body together with smaller periolivary nucleus. Medial olivary nucleus helps in detecting interaural time differences. The ‘S’ shaped nuclei receives an excitatory input from the ipsilateral cochlear nuclei and inhibitory from the contra lateral cochlear nuclei. This helps in detection of difference of sound intensity.
Through the lateral lemniscus the input from the brain stem auditory nuclei is projected to inferior colliculi. The two pathways emerge from the cochlear nuclear complex and join in the inferior colliculus and further analysis is made.
outside. This map is the basis for recognizing patterns in sound and sound localizations. Inferior colliculus also involved in motor response like controlling middle ear muscle, turning head or moving eye in response to sound.
The thalamus receives information from the inferior colliculi.Thalamus has medial geniculate body, posterior nucleus and reticular nucleus, which are involved in auditory function. The ventral division is organized tonotopically into low frequency layers and receives input from the central nucleus of inferior colliculus. The dorsal division is not tonotopically organized and medial division receives multimodal inputs.
From the ventral division of the medial geniculate nucleus, fibers project to Brodmann area 41 within the lateral fissure of the temporal lobe and dorsal division project to non primary areas around A1.
DESCENDING PATHWAYS:
The descending pathway may participate in attention level and anticipation of signals. The major one is olivocochlear feedback loop which originate in SOC and projects back to cochlea. It projects to outer hair cells and is called medial efferent system. It helps in suppression of outer hair cell mobility to make the cell less sensitive and provides protection from loud sounds. The lateral efferent system from lateral superior olivary complex supply inner hair cells which helps in sound localization and binaural comparison.
VASULAR SUPPLY
Labyrinthine artery common cochlear artery spiral modiolar artery radial arteries. Cochlear branch of vestibular cochlear artery supply the spiral ganglion, osseous spiral lamina, limbus, spiral ligament.
VENOUS DRAINAGE:
Apical Region - Anterior spiral vein
These two joins with the anterior and posterior division of the vestibular vein in the region of the basal turn of cochlea, to form the vein of the cochlea which empties into jugular bulb.
PHYSIOLOGY OF SOUND TRANSMISSION
of the hair cell stereocilia. This reaches maximum at a particular place of the basilar membrane and decays. Molecular structure at that location of the basilar membrane determines the characteristic frequency. The cochlea is tuned for higher frequency upto 20kHz. This tonotopic gradient is manifested in hair cell height also.
TRANSDUCTION BY HAIR CELLS
the cell more positive inside and when channels shut cells become more negative during opposite phase of sound wave. K+ is the main ion involved in transducer mechanism. The main energy comes from the stria vascularis by ion pumping. All these mechanism produce a receptor potential. And neuro transmitters are released from the basolateral membrane of inner hair cell
INNER HAIR CELLS AND ELECTRICAL TRANSDUCTION
ELECTRICAL RESPONSE OF OUTER HAIR CELL
Outer hair cells are mainly for amplification and sharp tuning of basilar membrane. It is for amplification of sounds at a low pressure level. Outer hair cells act by changing it’s length. It will contract upon stimulation which leads to depolarization and pull the basilar membrane. It elongates its length which leads to hyperpolarisation. Prestin is the motor protein in the outer hair cells, responsible for the actions of OHC. On depolarization, the anions dissociate and the surface area decreases leading to contraction. Similarly on hyperpolarisation surface area increases.
Electron microscopic picture of the upper surface of the organ of corti shows single row of inner hair cells and four rows of outer hair cells, inner and outer pillar cells and deiters cells.
ELECTRICAL RESPONSE OF THE COCHLEA
In response to acoustic stimuli, electric potential can be recorded from the cochlea. Cochlear microphonic potentials represent the mass effects of the transducer currents flowing through outer hair cells. It is an AC response.
SUMMATING POTENTIAL
It may be either positive or negative, depends on the stimulus. It is the distortion component of the outer hair cell response and small contribution from inner hair cells also. It reaches maximum amplitude after the onset of stimulus.
NEURAL POTENTIAL:
RESPONSE OF AUDITORY NERVE FIBERS
Action potentials are generated in the auditory nerve fibers, when neurotransmitters are released at the base of inner hair cells. The auditory stimulus is excitatory. The transmitter release and action potential generation is in synchrony with the each cycles of stimulus. When the sound stimulus intensity increases the basilar membrane vibration also increase, mainly its amplitude. This result in activation of inner hair cells and auditory nerve firing rate increases. There is also non linear mechanical response present in cochlea.
PHYSIOLOGY OF NOISE
it is any sound which is unpleasurable and unwanted. The Psychological attribute includes pitch, loudness, timber intelligibility, annoyance. The physiological measurable attributes include potential to damage hearing.
The frequency of noise is measured in Hertz (Hz), intensity in sound pressure level (SPL) and expressed in decibel (dB). Since it is expressed in decibels it reduces the wide ranging of values to a manageable numbers. Noise may be continuous, fluctuating, intermittent or impulsive25. Continuous noise may be relatively constant. Fluctuating noise increases in level over time. Intermittent noise is interrupted for varying time. Impulsive or input noise may be caused by explosions, more common in military environment. It is characterized by short lasting rapidly changing wave fronts and followed by small reverberations and echoes.
The amount of noise, sound pressure level is measured by sound level meter in decibel (dB) using a frequency weighting formula called A-Scale. A-Weighted measurements are preferred in calculating noise exposure. It reduces the sensitivity of the sound level meter in both extreme ranges of audible spectrum.
specification for sound level meter type 0, 1, 2, 3. Type 0 sound level meter is used as a laboratory reference standard, type 1 mainly for laboratory and also field where acoustical environment in closely controlled. Type 2 is for general field application and type 3 is for field noise survey application. The frequency range responds for all types from 10Hz to 20000Hz. Sound level meter measures noise according to equal energy principle.
NOISE DOSIMETERS
This a small light and compact instrument worn by workers. It measures the total A-weighted sound energy and express it as a proportion of the maximum A-weighted energy received per day. It is useful whenever the exposure varies during working day. The personal noise dosimeter measures noise dose of percent exposure, experience by the worker. This instrument record on almost any increment of time equivalent level, peak level etc. The dosimeter provides a warning that user is approximately over exposure. The dosimeter works on the basis of equal energy principle.
level noise of long duration, provided that the total energy is the same in each case.
NOISE DOSIMETER
NOISE INDUCED HEARINNG LOSS
INTRODUCTION
obviously a serious impact on hearing and may cause hearing impairment in terms of hearing loss and tinnitus. The working environment is a major factor for noise-induced hearing loss and noise is the source of most prevalent occupational diseases in many countries. Although study about NIHL has been done over a long period, now only the pathomechanism behind it are clearly known. The increments in our knowledge about NIHL helps to improve the detection and prevention of NIHL.
NATURE OF HEARING LOSS
Noise is an undesirable sound. Noise may be continuous, fluctuating, intermittent or impulsive. Continuous means a constant steady noise. Fluctuating means noise varies over time, while intermittent noise are interrupted over time periods
Threshold Shift(PTS) will occur. PTS is due to the structural damage of cellular system of cochlea. Repeated episode of this TTS leads to PTS. In PTS focal loss of hair cells and degeneration of nerve fibers37 in acoustic trauma that is a single short lasting exposure of sound. NIHL occurs due to continuous chronic exposure of sound. Occupational noise is always sensorineural and affects mainly OHC. Typically the threshold shift occurs bilaterally.
PATTERN AND MECHANISM OF NOISE INDUCED COCHLEAR PATHOLOGY
Cochlea is a highly energy consumptive biological system. Each cellular system of cochlea is vulnerable to noise exposure. Basilar membrane is 200 times stiffer at the base3. It results in an impedance gradient from apex to base. So high frequency creates a maximum vibration at base and low frequency at the apex. The damage to pillar cells leads to abrupt change in the basilar membrane impedance gradient. It may lead to cell death.
SENSORY CELLS
IHC are more resistant to noise exposure. When complete loss of OHC in a region leads to loss of IHC and VIII nerve fibers. Temporary effect of noise can be seen in IHC and VIII nerve 6
Because of high rate of synaptic activity VIIIthnerve fibers swells up due to intense noise exposure. Failure to recycle glutamate accumulated in the dendrite terminal cause excitotoxic effect leads to swelling of postsynaptic cell bodies and dendrites 7
Phase-contrast views of outer pillar cells. Left panel shows normal anatomy.Right panel is after exposure to 50–155 dB SPL impulses. Notice (arrows) the detachment at the level of the cuticular plate.
COCHLEAR VASCULAR SYSTEM
within the cochlea. Systemic changes is influenced by the sympathetic8 influence and local auto regulation9. Sympathetic influence of cochlea is coming from the innervation of stellate ganglion and unilateral superior cervical ganglion. The response of the vascular system depends on the type of noise and duration of exposure10. With continuous noise exposure there will be an initial increase, followed by a decrease in cochlear blood flow. The interruption of the sympathetic innervations of cochlea reduces its susceptibility to noise. On exposure to loud noise, sensory cells detach from the organ of corti and result in a cleft between the 1st and 2nd rows of OHC. The endolymph enters the cleft and produces an osmotic and ionic changes which results in cell death. A combination of impact noise and continuous noise is more harmful to the ear.
DYNAMICS OF COCHLEAR PATHOLOGY.
After an exposure to loud noise, the cochlear pathology especially hair cell loss continues even for 30 days12. The lesion continues to expand in the basal direction and cells die by both apoptosis and necrosis. A study on Chinchillas that were exposed to loud noise for 24 hours over a period of 6 months showed that they developed a stable level of threshold shift which remained so for the 6 months study
ATS grew at a rate 1.7 db HL for each dB increase in noise level. Henderson and colleague showed that low level impact (95-115 db) produce HL of 1.9 dB and above 120dB, an increase of 3-5dB was recorded. When a peak level of noise exposure exceeds a critical level, the direct mechanical failure occurs and critical level varies with species.
NOISE AS A STRESSOR TO THE COCHLEA.
several days due to which hair cells continue to die after exposure to loud noise.
PATHWAYS OF SENORY CELL DEATH
Noise exposure produces both apoptosis and necrotic cell death18. Following noise exposure the level of phosphates, calcineurin and Bcl-xl/Bcl-2 associated death promoter level increases. There is a short latency before apoptosis starts following noise exposure and once started apoptosis continues. It may be converted to necrosis because of lack of energy to finish apoptosis. The apoptosis starts from the centre to basal end of cochlea and is driven by lipid peroxidation19. Impulse noise produce damage to OHC by ROS production. OHC are shortened and their nuclei migrate from basal pole to middle of the cell and finally it shrinks.
COCHLEAR RESPONSE TO STRESS FROM NOISE
Cochlea has several defense mechanisms to protect it from high level noise. It produces heat shock proteins20. It also increases the activities of antioxidant system namely glutathione reductase, catalase, gamma glutamyl cysteine synthatase. .
In short, noise damage cochlea and causes hearing loss up to 50dB. OHC are more vulnerable to noise exposure. Noise damage cellular system of cochlea by production of ROS which in turn initiates death by apoptosis and necrosis and this continues for few days after noise exposure.
PREDISPOSING FACTORS
Some patients are more prone to noise induced hearing loss suggesting a genetic basis for it i.e. physical characteristics and cochlear ultra structure, ahl gene26 have been proposed as contributing to susceptibility.
smoking27
Previous damage to cochlear28
Hypertension30
Recreational drug users
Ototoxic drug exposure
Single nucleotide polymorphism of catalase gene involved in oxidative stress are involved in noise susceptibility
CLINICAL FEATURES
The middle aged male people with complaints of tinnitus with or without hyperaccusis
In the early stage patients present with a history of hearing difficulty in the presence of background noise. They usually describe lack of clarity to speech.
OTHER ADVERSE EFFECTS BY NOISE EXPOSURE
Vestibular Dysfunctions31 can be associated with noised induced hearing loss, due to common arterial supply to cochlea and vestibular end organ and similarity in the ultra structure of vestibular and cochlear cells. Sometimes asymptomatic vestibulopathy can progress to severe disturbing vertigo under certain situation32.
Non auditory complication is impairment of general health33 due to prolonged activation of autonomic nervous system and pituitary adrenal complex.
It also affects gastro intestinal motility and can cause peptic ulcer34. Sometimes circulatory problems and hypertensions can occur in noise induced hearing loss.
Exposure to loud noise can affect task performance and cause emotional upset.
INVESTIGATIONS
Audiometric testing is the only diagnostic evaluation of NIHL.
HIGH FREQUENCY PURE TONE AUDIOMETRY
High frequency air conduction testing is done from 8000 to 20000 kHz. Routine PTA covers 125 to 8 kHz, although Human cochlea responds up to 24 kHz. Because most sounds occurring in our day to day life fall within 125 to 8 kHz. Secondly normative threshold data below 8 kHz are less affected by acoustic factors.
The high frequency pure tone is not used routinely due to the acoustic characteristics of the high frequency pure tone i.e. it covers only 1.5 octaves whereas conventional audiometry covers 6 octaves. The wavelength of high frequency tones are short, makes transducer mental coupling difficult. The standing waves may not allow true thresholds to be assessed. They may also cause threshold variation in the subject. The calibration of audiometer is found to be difficult. Different studies show that high frequency audiometry is valuable in early diagnosis of the traumatic effects of high intensity noise, ototoxic drugs, dietary factors35.
problem is now solved with using special probe microphone to measure the sound pressure at the level of drum.
Now special head phones are used HDA 200 sennheiser head phones. They are closed dynamic headphones specially designed for extended high frequency testing. They have excellent passive attenuation, very high quality sound reproduction with single side cable.
They have added headband with adjustable cushion, circum aural ear pads. Using this type headphones measurement is done with steady state sine wave signals, it has very high passive sound attenuation.
HIGH FREQUENCY PURE TONE AUDIOMETRY
TYMPANOMETRY - To Confirm Normal Middle Ear Functions
Cortically evoked response audiometry is the most valuable objective test because of the following reasons.
It has good frequency specificity
It is non invasive
OAE
Helps to detection of OHC damage
MRI - to evaluate vestibular sahawanomma
Tinnitus pitch and intensity matching can be done.
DIFFERENTIAL DIAGNOSIS
Inner ear autoimmune disease
Inner ear genetic sensorineural hearing loss
Inner ear ototoxicity
Inner ear presbycusis
Sudden sensorineural hearing loss.
DIAGNOSIS
History of prolonged unprotected exposure to loud noise and no history of other otological problems.
Audiogram shows High frequency hearing loss
MANAGEMENT
No well recognized and validated treatment is specifically available.
PREVENTION
Health and safety Act 1974 minimizes the risk to Employees. The 1989Noise Act work Regulation describes two action
Levels for daily noise exposure - first action level at 85 dB (A) and a Second at 90dB (A). In addition there was a peak action level of 140 dB.
Reduction of noise level at the source of production
Specific protection of the individuals who are at risk
Ear plugs - Approximately will provide protection 10to 15 dB of sound protection
Ear muffs- Provides at least 15to 30 dB sound protection
Health education about NIHL and preventive aspects
Both ear plugs and ear muffs should be worn in areas of loud noise exposure. These hearing protectors should be worn all the time of exposure. Even if they remove for 15mts in an eight hour work period, the efficacy is reduced to half.
Early detection - periodical audiological check up
Active noise reduction with electronic method of sound attenuation
Pharmacological Protection
induced excitotoxity and depletion of GSH. Based on this Acetyl L. Carnitine helps to maintain mitochondrial biosynthesis. Also carbamathione, a glutamate antagonist, GSH repletion agents D-methionine all improved hearing. Antioxidants also play on important role in noise exposed persons.
RECOMMENDATIONS FOR PREVENTION OF NOISE INDUCED HEARING LOSS BY THE WORLD HEALTH ORGANIZATION
The World Health Organizations Programme is concerned with prevention of Deafness and Hearing Impairment especially in developing countries. It also promotes strategies for the prevention of the major causes of hearing impairment and deafness which constitute public health problems. Prevention and management of Noise Induced Hearing loss should be started in primary health care and it should be appropriate, adequate and affordable.
Hearing loss can be attributed to noise by the following criteria
Tympanometry should be normal
By creating awareness about the adverse effects of noise exposure through school and all health educational programme and campaigns. Also create awareness about the importance of hearing in day to day life.
National programme - It is a multisectorial integrated approach .All the programme can be implemented through the PHC. It has the influence on local community.
Training - We have to train the persons to carryout noise surveys and audiometric testing.
Occupational Noise: It is a major problem for hearing loss in developing countries. Through programme, training the workers, education, and audiology testing and usage of protectors, we can control it.
Rapid urbanization of developing countries result in high level of traffic noise. This has to be reduced by devising regulations, proper use of silencers, effective land use planning.
We have to limit the high noise leisure pursuits Effective collaboration with NGO and WHO and its members Epidemiological data should be collected about the prevalence of NIHL Data should be for the better understand the development and progression of NIHL.
-Screening methods should be developed for early identification and intervention of NIHL.
Epidemiological Data.
There is a serious shortage of accurate epidemiological information relating to NIHL especially in developing countries. It is recommended that
- Representative surveys should be conducted for the prevalence of significant NIHL in less developed countries.
- High quality longitudinal data is gathered to better understand the development and progression of NIHL.
- Effective screening methods be developed for early identification of and intervention against NIHL.
means for its prevention. It is recommended that priority should be given to research on the following subjects
- Mechanical, metabolic and molecular mechanisms of NIHL;
- Investigation of low cost medications for prevention;
- Engineering research on technical measures for noise abatement and improving hearing protectors;
- Studies on the risk factors for NIHL including individual susceptibility to noise damage.
- Studies on the interaction of other toxic agents with noise
Assessing Noise Risk
Noise level 80dB or more for many years produce hearing impairment and noise 115 dB SPL produce permanent damage. The damage risk criteria depend on the intensity and noise duration.
more period is allowed and if it is greater than 90 dB this exposure time should be reduced.
For every 3 dB increase in SPL, working period should be reduced to half. According to OSHA every 5dB rise in noise level the exposure has to be reduced to 50%. The people with noise exposure during non work time should be careful as it may interact with work exposure and increase hearing loss.
Occupation safety health regulations
According to OSHA 80dB 8 hour work time in permitted. There are 5 regulations according to OSHA.
1) Identification and exposure leads.
2) Protection of workers from hazardous exposure.
3) Hearing test annually.
MATERIALS AND METHODS
AIMS AND OBJECTIVES:
• Early detection of Hearing loss in high risk individuals, exposed to noisy environment
• To compare the efficacy of conventional audiometer with the high frequency audiometer in early detection of hearing loss
• Early intervention and prevention of noise induced hearing loss
• To evaluate the relationship between duration of noise exposure and hearing loss
STUDY PLACE: Government General Hospital, RGGGH Chennai
Collaborative department: Upgraded Institute of Otorhinolaryngology :
Department of audiology
Study design : Prospective
INCLUSION CRITERIA
• Age : Above 20 years
• Sex : Both Males & Females
Individuals exposed to noisy environment
• Middle ear function should be normal
EXCLUSION CRITERIA – Age below 20 years
– External or middle ear abnormalities
– Individual with conductive hearing loss
– Actively discharging ear
– Individual with prior history of ear surgery.
– People with family history of HOH
INVESTIGATIONS
(1) Otoscopic Examination (2) Pure tone audiometry
(3) Examination under Microscope (4) Impedance audiogram
(5) OAE
METHODOLOGY
The study was conducted in the department of otorhinolaryngology Government General Hospital Madras Medical College Chennai 60003. A total of 50 subjects were examined within the age group 25 to 55 years .30 people were traffic police and 20 people were drivers in the Central Chennai exposed to noise of an average of 105dB . All of them working for more than 2 Years.
Relevant history noted. All persons were first examined by Otoscopy and under microscope. and ruled out any middle ear and external ear pathology. All cases subjected to pure tone audiometry. From 125 to 8 kHz’s the response were based on subject activation of Hand held response buttons. Steps of 5dB were used in obtaining results. The results were expressed in dB HL. Also bone conduction from 250 to 4 kHz.
RESULTS AND ANALYSIS
The following data were obtained from the study conducted at RGGGH Chennai in noise exposed individuals of Chennai central zone.
The following results and analysis were concluded from my study.
The following parameters were measured-Unilateral or bilateral noise induced hearing loss Duration of work
Age distribution
Normal PTA with high frequency hearing loss Otoaccoustic emissions
(If P-Value <0.05 then statistically significant)
Frequency Tables.
N %
Age group (years)
30 - 40 yrs 30 60.0 > 40 yrs 20 40.0 Total 50 100.0
PTA
WNL 40 80.0
WNL with dip at
4K 10 20.0
Total 50 100.0
IMPEDANCE
Normal 50 100.0 Total 50 100.0
OAE
Absent 48 96.0 Present 2 4.0 Total 50 100.0
HIGH
FREQUENCY
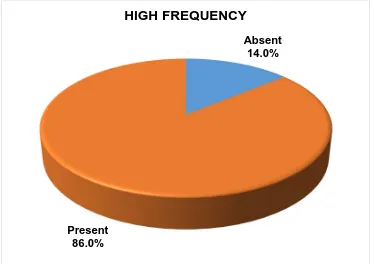
Absent 7 14.0 Present 43 86.0 Total 50 100.0
Man Whitney test to compare between PTA groups
PTA N Mean Rank P-Value
RE-8K WNL 40 25.15 0.043
WNL with dip at 4K 10 34.90
LE-8K WNL 40 25.11 0.051
WNL with dip at 4K 10 29.05
RE-9K WNL 40 24.68 0.04
WNL with dip at 4K 10 34.80
LE-9K WNL 40 25.18 0.049
WNL with dip at 4K 10 36.80
RE-10.2K WNL 40 23.30 0.028 WNL with dip at 4K 10 34.30
LE-10.2K WNL 40 24.75 0.457 WNL with dip at 4K 10 28.50
RE-11.2K WNL 40 21.80 <0.001 WNL with dip at 4K 10 40.30
LE-11.2K WNL 40 22.85 0.009 WNL with dip at 4K 10 36.10
RE-12.5K WNL 40 21.30 <0.001 WNL with dip at 4K 10 42.30
LE-12.5K WNL 40 22.11 0.001 WNL with dip at 4K 10 39.05
RE-14K WNL 40 22.24 0.001 WNL with dip at 4K 10 38.55
LE-14K WNL 40 23.55 0.053 WNL with dip at 4K 10 33.30
RE-16K WNL 40 24.23 0.224 WNL with dip at 4K 10 30.60
LE-16K WNL 40 25.31 0.056 WNL with dip at 4K 10 32.25
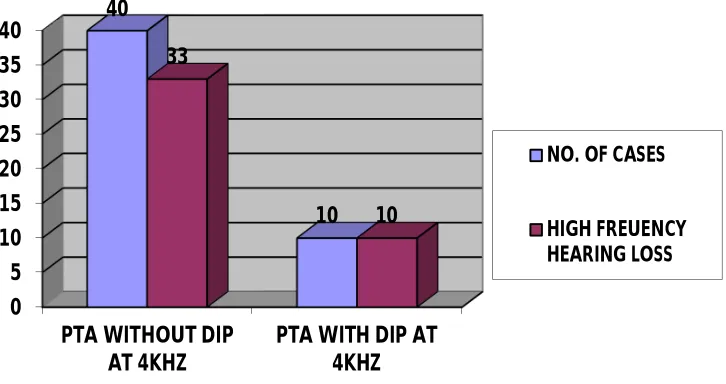
This picture shows cases with normal PTA and PTA with dip at 4kHz. 80% of cases shows normal PTA and 20.0% shows PTA with dip At 4 kHz
WNL 80.0% WNL with
dip at 4K 20.0%
0 5 10 15 20 25 30 35 40
PTA WITHOUT DIP
AT 4KHZ PTA WITH DIP AT4KHZ 40
10 33
10
NO. OF CASES
[image:75.612.144.507.97.289.2]HIGH FREUENCY HEARING LOSS
Figure 1 Relationship showing persons with normal PTA and PTA with dip at 4kHz to HF hearing loss
This Chart Shows that 82.5% (33 cases of 40) have a High Frequency Hearing Loss that is being misled by a normal PTA report whereas 100% of persons with dip at 4 KHz in PTA have a High Frequency Hearing Loss.
0 10 20 30 40 50 60 70 80
RE-8K LE-8K RE-9K LE-9K
RE -1 0 .2K LE -1 0 .2K RE -1 1 .2K LE -1 1 .2K RE -1 2 .5K LE -1 2 .5K
RE-14K LE-14K RE-16K LE-16K
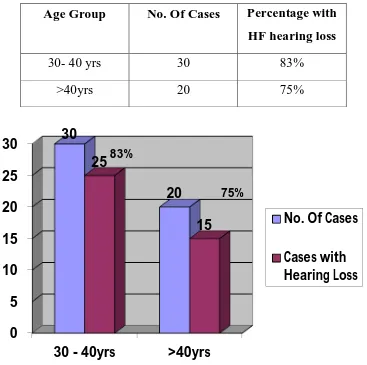
Comparison of Age Distribution and High Frequency Hearing loss Patterns
Age Group No. Of Cases Percentage with HF hearing loss
30- 40 yrs 30 83%
[image:76.612.129.496.145.510.2]>40yrs 20 75%
Figure 2 Comparison of Age distribution and High frequency Hearing Loss
83 % of subjects in the age group of 30-40 years have high frequency hearing loss while 75 % of subjects above 40 years of age have high frequency hearing loss.
0
5
10
15
20
25
30
30 - 40yrs
>40yrs
30
20
25
15
No. Of Cases
Cases with
Hearing Loss
HEARING LOSS AT DIFFERENT FREQUENCIES AT DIFFERENT AGE GROUP
0 10 20 30 40 50 60 70
M
e
an valu
e
Frequency
Age group 30 - 40 yrs
UNILATERAL / BILATERAL HEARING LOSS
Most of the subjects had symmetrical bilateral hearing loss in all high frequencies.
The bar diagram showing relationship high frequency hearing loss of right ear and left ear
0 10 20 30 40 50 60
8kHz 9kHz 10.2kHz 11.2kHz 12.5kHz 14kHz 16kHZ
DESCRIPTIVE STATISTICS OF HIGH FREQUENCY PURE TONES HEARING LOSS FOR EACH FREQUENCY
Variables Mean Std. Dev
Median 1st Quartile
3rd Quartile
DURATION OF
FIGURE SHOWING PERCENTAGE OF HIGH FREQUENCY HEARING LOSS
Absent 14.0%
Present 86.0%
High frequency in kilo hertz
This is the bar diagram showing hearing loss in decibels at corresponding high frequencies.
0
10
20
30
40
50
60
8
10.2
12.5
16
This pie chart shows that 4 % of subjects have otoacoustic emissions. While 96 % have absent otoacoustic emissions. Those subjects with absent otoacoustic emissions have comparatively worse hearing loss high frequency than those with present otoacoustic emissions.
Absent 96.0% Present
4.0%
DURATION OF WORK
DUATION OF WORK
NO OF PATIENTS PERCENTAGE
1-3 4 8
4-6 19 38
7-9 13 26
>10 14 28
CORRELATION BETWEEN DURATION OF WORK AND FREQUENCY
RE-8K Correlation -.098
P-Value .498
LE-8K Correlation -.081
P-Value .577
RE-9K Correlation .083
P-Value .568
LE-9K Correlation -.137
P-Value .344
RE-10.2K Correlation .335
P-Value .041
LE-10.2K Correlation .371
P-Value .025
RE-11.2K Correlation .323
P-Value .022
LE-11.2K Correlation .455
P-Value .052
RE-12.5K Correlation .389
P-Value .005
LE-12.5K Correlation .373
P-Value .008
RE-14K Correlation .460
P-Value .001
LE-14K Correlation .376
P-Value .042
RE-16K Correlation .377
P-Value .007
LE-16K Correlation .384
P-Value .006
DISCUSSION
A prospective study to detect hearing loss in noise exposed individuals at an early stage prior to affecting speech frequency. The study was conducted in RGGGH, Chennai, MMC. Traffic Police and drivers of central zone are subjected to study. The average sound level of central zone is 109dB.No persons in the study have any hard of hearing as their compliant .All patient are subjected to conventional pure tone audiogram.
PTA.
Total No of Cases : 50
Normal- PTA : 40
PTA with dip at 4KHz: 10
hence high frequency audiometry can be used as a preventive audiological tool.
100 % of patients with pure tone audiogram with dip at 4 kilo hertz developed high frequency hearing loss.
All patient had normal Tympanometry. All 50 have “A” type curve.
Ipsilateral and contralateral reflex present.
AGE DISTRIBUTION
83 % of subjects in the age group of 30-40 years have high frequency hearing loss while 75 % of subjects above 40 years of age have high frequency hearing loss.
DURATION OF EXPOSURE
Here we divide the work groups into four categories
< 3 years
4 to 6 years
7 – 9 years
Subjects who have worked for more than 4 years have more significant hearing loss compared to those who have worked for less than 4 years.
UNILATERAL/ BILATERAL HEARING LOSS
Most of the subjects had symmetrical bilateral hearing loss in All high frequencies.
OTOACOUSTIC EMISSIONS
All the cases were subjected to Ot acoustic emissions and only 4 % cases showed presence of Otacoustic emissions while 96 % show absence of otoacoustic emissions. Since only 2 cases show presence of OAE statistical comparison is difficult .All subjects with high frequency hearing loss showed absence of otoacoustic emissions. A few patients with absent OAE had no high frequency hearing loss. We have to follow up these cases along with those showed presence of OAE .
HIGH FREQUENCY PURE TONE AUDIOGRAM
INTERPRETATION OF RESULTS
A prospective study to detect hearing loss in those cases exposed to noisy environment before affecting speech frequency using high frequency audiometry. Study was conducted in RGGGH, MMC Chennai.
Traffic police and drivers of Chennai central were the subjects of study
- In my study 83% of subject in the age group 30-40years have high frequency hearing loss and 75% cases above the age 40 years have high frequency hearing loss
-82.5% of cases with normal PTA had high frequency hearing loss
-All the subjects with PTA with dip at 4kHz had high frequency hearing loss
-96.5 %of cases have absence of OAE
-There is considerable relation between duration of exposure and hearing loss and it is proven
-86% of the total cases have high frequency hearing loss with normal PTA.
BENEFITS TO THE COMMUNITY
This study helps in early detection of hearing loss those working in noisy environment before the speech frequency affected
Helps in early intervention and prevention of NIHL
Create awareness about noise exposure and hearing loss
DIFFERENT STUDIES AND THEIR INFERENCES
This table shows different studies conducted worldwide that demonstrates the predominantly affected frequency.
MY STUDY IS COMPARABLE WITH FOLLOWING STUDIES
“A study on early detection of noise induced hearing loss by using high frequency audiometry” by R.Singh, R.Saxena, S.Varshney Internet Journal of otorhinolaryngology showed detection of noise induced hearing loss in 62 % individuals using high frequency pure tone audiometry. 74% cases were detected in the younger age group.
“An article published on occup.med (London) 2001 June by Ahmedtio, Jerwoodo, Ballalsies et al. Showed that HFA can be used as an early indicator of noise induced hearing loss and acoustic trauma rather than conventional audiometry particularly for younger groups”.
E et al In Ear, Nose and Throat Department, National University of Athens, Hippokration Hospital, Greece published in B-ENT 2008. They conducted the study on 139 industry workers exposed to noise for a period of two years by using EHF audiometry in the frequency range 9-20 kHz. A statistically significant correlation was seqen between the elevation of puretone thresholds and time of exposure at all frequencies with the exception of 10,000 Hz.”
“Study by soma G1 pictroiusti, magrini A. Coppetice et al in Department of occupational medicine toversata University, Italy, Published rencon journal of Industrial medicine 2008 study on 184 Cement workers showed EHFA is more sensitive than conventional audiometry in detecting noise based hearing loss, suggesting that EHFA could represent a useful preventive investigation.”
“A study on application of extended high frequency audiometry in the early diagnosis of noise induced hearing loss by Wang Y, Yang B et al from Department of Otorhinolaryngology, Hospital of China First Automobile Group Corporation, Changchun 130011, China shows occurrence of threshold changes in the high frequency range is earlier than low frequency range. Ageing and working time also affect 10-20 Kilo Hertz hearing threshold.”
A study on “Audiometric evaluation in extended high frequencies of individuals exposed to occupational noise by Porto MA, Gahyva DL et al from Departamento de Fonoaudiologia da Faculdade de Odontologia de Bauru da Universidade de São Pauloc demonstrated the contribution of high frequency audiogram for early diagnosis as these threshold are affected before conventional frequencies”.
A study on “Extended high-frequency thresholds in noise-induced hearing loss by Hallmo P, Borchgrevink HM et al at Department of Otorhinolaryngology, Ullevål University Hospital, Oslo, Norway. Study on 167 male workers with history of noise exposure, shows age effect in the EHFA was present only in lowest grades of conventional frequency audiometry.”
A study on “Temporary threshold shift in military pilots measured using conventional and extended high-frequency audiometry after one flight by Kuronen P, Sorri MJ et al Finnish Air Force Headquarters, Finland International Journal of Audiology 2003 conducted study on 51 Finnish Air Force military personnel as subjects using HFA and conventional pure tone audiometry. A statistically significant temporary threshold shifts (TTS) at several frequencies and with all aircraft types involved was noted”.
textile workers with and without exposure to noise more than 85 dB. The hearing threshold was significantly higher at 16000 Hz ”
A study on “High-frequency audiometry- Normative studies and preliminary experiences by Laukli E, Mair IW published in Scandinavian Audiology 1985 on high-frequency audiometer and its use for measuring hearing thresholds between 8 and 20 kHz. It showed that audiometer can be used in the clinic with approximately the same degree of reproducibility as in conventional audiometry.”
A study on “High-frequency (10-18 kHz) hearing thresholds: reliability, and effects of age and occupational noise exposure by Dennis J H , Badran O, Ismail M et al from Department of Family and Community Medicine, College of Medicine, King Faisal University, Dammam, Saudi Arabia published a journal 2001 showed that high-frequency audiometry (HFA) was as reliable as the conventional procedure.”
They conducted a cross-sectional study involving 204 industrial noise exposed and 100 non-industrial noise-exposed workers which showed significant differences at EHFA were detected noise-exposed workers with normal findings at conventional audiometry
CONCLUSION
From my study the following conclusions were made. unprotected Exposure to loud noise for a long period of time produce hearing Impairment. Initially it affects high frequencies and gradually progress to low frequency.
By the time hearing loss is detected using conventional audiometry damage has already been affect the speech frequencies. It will affect the verbal communication of the patient and affect the quality of Life .Therefore by using high frequency audiometry early detection of hearing loss in the high frequency can be detected. It will help us to take an early warning to those working in noisy environment to take preventive measures.
The high frequency pure tone audiometry helps to diagnosis early noise induced hearing loss and for the assessment of the susceptibility of the individuals to noise damage. The high frequency audiometry can be used as a preventive and interventional method to prevent NIHL. Hereby to improve the quality of social life.
There is considerable relation between duration of exposure and hearing loss and it is proven.
REFERENCES
1. Donald Henderson, Bhoua Hu, Pattern and mechanism of noise induced cochlear pathology
2. Colin Mathers, Andrew Smith, Marisol Concha, Global burden of hearing loss in the year 2000
3. Anirban biswas page no 14 clinical audio- vestibulometry, third edition by Bhhalani publishing house ,Mumbai, India
4. Brownell WE (1984) Microscopic observation of cochlear hair cell motility. Scan ElectronMicrosc(Pt 3):1401–1406
5. Wangemann P (2002) K+ cycling and the endocochlear potential. Hear Res 165:1–9
6. Puel JL, Ruel J, Gervais d’Aldin C, Pujol R (1998) Excitotoxicity and repair of cochlear synapses after noise-trauma induced hearing loss. Neuro Report 9:2109–2114.
7 . Kandel ER, Schwartz JH, Jessell TM (2000) Principles of Neural Science, 4th ed. New York: McGraw-Hill Health Professions Division
9. Miller JM, Ren TY, Nuttall AL (1995) Studies of inner ear blood flow in animals and human beings. Otolaryngol Head Neck Surg 112:101–113.
10 Perlman H, Kimura R (1962) Cochlear blood flow in acoustic trauma. Acta Otolaryngolica 54:99–110
11. Borg E (1982) Protective value of sympathectomy of the ear in noise. Acta Physiol Scand 115:281–282
12. Hamernik RP, Turrentine G, Roberto M (1985) Mechanically induced morphological changes in organ of Corti. In Salvi RJ, Henderson D, Hamernik RP, Colletti, V (eds) Basic and Applied Aspects of Noise Induced Hearing Loss. New York: Plenum Press, pp. 69–84.
13. Bohne BA (1976) Mechanisms of noise damage in the inner ear. In: Henderson D, Hamernik RP, Dosanjh D, Mills, J (eds) Effects of Noise on Hearing. New York: Raven Press, pp. 41–68.
14. Thalmann R, Miyoshi T, Kusakari J, Ise I (1975) Normal and abnormal energy metabolism of the inner ear. Otolaryngol Clin North Am 8:313–333.
16 Miller JM, Brown JN, Schacht J (2003) 8-iso-prostaglandinF(2alpha), a product of noiseMiller JM, Brown JN, Schacht J (2003) 8-iso prostaglandin F(2alpha), a product of noiseexposure, reduces inner ear blood flow. Audiol Neurootol 8:207–221.Exposure, reduces inner ear blood flow. Audiol Neurootol 8:207–221
17. Halliwell, B, Gutteridge J (1999) Free Radicals in Biology andDisease. Oxford: OxfordUniversity Press
18. Hu BH, Henderson D, Nicotera TM (2002) Involvement of apoptosis in progression ofcochlear lesion following exposure to intense noise. Hear Res 166:62–71.
19. Yamashita D, Jiang HY, Schacht J, Miller JM (2004) Delayed production of free radicalsfollowing noise exposure. Brain Res 1019:201–209.
20 . Nicotera TM, Ding D, McFadden SL, Salvemini D, Salvi R (2004) Paraquat-induced hair cell damage and protection with the superoxide dismutase mimetic m40403. Audiol Neurootol 9: 353–362
22. Canlon B, Agerman K, Dauman R, etal: Pharmacological strategies for preventing cochlear damage induced by noise trauma. Noise Health 1998; 1:13-23.
23 . Wood WS Lipscomb DM(1972)Maximum available sound pressure levels from stereo components J Acoust Soc Am 52.4874-487
24 . Bredberg G:Cellular and nerve supply of the human organ of corti, Acta Otolaryngol Supl 236:1-135,1968 26 .25 .Occupational Safety and Health Administration, Department of Labor: Occupational noise exposure: hearing conservation amendment. Fed Reg 1981; 46:4078-4179.
26. Toppila E, Pyykk? II, Starck J, et al: Individual risk factors in the development of noise-induced hearing loss. Noise Health 2000; 2:59-70
28 Mizoue T, Miyamoto T, Shimizu T: Combined effect of smoking and occupational exposure to noise on hearing loss in steel factory workers. Occup Environ Med 2003; 60:56-69.
28 . Cantrell RW: Physiologic effects of noise. Otolaryngol Clin North Am 1979; 12:537-549oise on hearing loss in steel factory
29. Axelsson A, Lindgren F: Is there a relationship between hypercholesterolaemia and noise induced hearingloss?. ActaOtolaryngol 1985; 100:379-386
30 . Ising H, Babisch W, Kruppa B: Noise-induced endocrine effects and cardiovascular risk. Noise Health 1999; 1:37-48.
31. Ylikoski J, Juntunen J, Matikainen E, et al: Subclinical vestibular pathology in patients with noise-induced hearing loss from intense impulse noise. Acta Otolaryngol 1988; 105:558-563.
32 . Golz A, Westerman ST, Westerman LM, et al: The effects of noise on the vestibular system. Am J Otolaryngol 2001; 22: 190-196
33. Matheson MP, Stansfeld SA, Haines MM: The effects of chronic aircraft noise exposure on children's cognition and health: 3 field studies. Noise Health 2003; 5:31-40.
34 . Doring HJ, Hauf G, Seiberling M: Effects of high-intensity sound on the contractile function of the isolated ileum of guinea pigs
and rabbits. In: Tobias JV, Jansen G, Ward WD, ed.Noise as a
Public Health Problem: Proceedings of the Third International
Congress, Rockville, MD: American Speech-Language-Hearing
35. Northern,JDown M,Rudmose ,WGlorig A etal Recommended high frequency audiometric threshold levels (8000-18000hz) J.acoust Soc Am :52 :585-595(1972)
36. National Institute of Occupational Safety and Health: Available atAccessed January 28, 2009
37. Nordmann AS, Bohne BA, Harding GW : Histopathologica differences between temporary and permanent threshold shift. Hear Res 2000; 139:13-30.
38 Bies DA Hansen CH :An alternative mathematical d fescription of the relationship between noise exposure and hearing loss J Acoust soc88:2743-2754 ,1990.
39. Scott Brown’s Otorhinolaryngology, Head and Neck Surgery Volume – 3, page. 3549-3555.
ABBREVIATION
NIHL NOISE INDUCED HEARING LOSS TTS TEMPORARY THRESHOLD SHIFT PTS PERMANENT THRESHOLD SHIFT CN COCHLEAR NUCLEI
AVCN ANTEROVENTRAL COCHLEAR NUCLEI PVCN POSTERO VENTRAL COCHLEAR NUCLEI SOC SUPERIOR OLIVARY COMPLEX
PTA PURE TONE AUDIOMETRY
HFA HIGH FREQUENCY AUDIOMETRY SPL SOUND PRESSURE LEVEL
IHC INNER HAIR CELL OHC OUTER HAIR CELL
OAE OTOACOUSTIC EMISSION HOH HARD OF HEARING
PROFORMA
HISTORY OF THE PATIENT
NAME : AGE: SEX:
OCCUPATION, PERIOD OF JOB: HOURS OF WORK PER DAY:
ANY EAR COMPLAINTS: YES NO IF YES
HARD OF HEARING EAR DISCHARGE : RINGING SENSATION OF EAR:
GIDDINESS:
ANY CO MORBIDITIES: YES NO IF YES
1.FAMILY HISTORY OF HEARING LOSS SMOKING
THYRIOD DISORDERS
HISTORY OF ANY DRUG INTAKE
ENT EXAMINATION
EAR : NOSE THROAT:
TUNIC FORK TEST: Rinne :
Weber: ABC :
PURE TONE AUDIOMETRY :
IMPEDANCE AUDIOGRAM : ACOUSTIC REFLEX :
TYMPANOGRAM
OTOACOUSTIC EMISSION:
CONSENT FORM
STUDY TITLE : A STUDY ON “ASSESSMENT OF HEARING LOSS IN HIGH RISK INDIVIDUALS USING HIGH FREQUENCY PURE TONE AUDIOMETRY”
I ……… hereby give consent to participate in the study conducted by Dr.MANJU JOSEPH, Post Graduate in Upgraded Institute of Otorhinolaryngology, Madras Medical College & Rajiv Gandhi Govt. General Hospital, Chennai and to use my personal clinical data and result of investigation for the purpose of analysis and to study the nature of disease. I also give consent for further investigations.
Signature / Thumb impression Place Date of the patient / relative
Patient Name and Address
Signature of the Investigator
SL.
NO. AGE SEX DURATION PTA IMPEDANCE OAE
High frequency hearing loss in
dB 8kHz RE,LE 9kHz RE,LE 10.2kHz RE ,LE 11.2kHz RE,LE 12.5kHz RE,LE 14kHz RE,LE 16kHz RE,LE OF NOISE
Sl. No. EXPOSURE
1 48 M 7 Yrs WNL NORMAL
STUDY
ABSENT present 30,40 40,50 30,40 40,50 50,60 50,60 60,60
2 37 M 7 WNL NORMAL
STUDY
ABSENT present 35,25 35,30 20,20 25,30 40,40 65,65 70,70
3 31 M 6 WNL NORMAL
STUDY
ABSENT present 30,30 30,35 40,40 35,35 45,40 40,45 45,40
4 40 M 6 WNL NORMAL
STUDY
ABSENT present 50,,40 40,40 40,50 40,50 50,50 40,45 40,50
5 36 M 6 WNL NORMAL
STUDY
ABSENT present 30,35 40,40 35,30 40,40 45,45 50,50 55,55
6 39 M 8 WNL NORMAL
STUDY
ABSENT present 30,35 40,45 45,50 40,55 50,55 55,50 40,50
7 38 M 7 WNL NORMAL
STUDY
ABSENT present 35,35 40,45 45,45 45,50 45,55 55,50 55,60
8 38 M 7 WNL NORMAL
STUDY
ABSENT presnt 30,30 30,45 40,45 40,40 50,60 50,50 50,55
9 40 M 8 WNL NORMAL
STUDY
ABSENT absent 10,25 15,30 15,20 25,20 20,20 15.25 30,25
10 47 M 6 WNL NORMAL STUDY
ABSENT present 30,30 40,45 50,60 65,75 65,75 70,70 50,50
11 42 M 10 WNL NORMAL
STUDY
ABSENT present 45,40 45,30 40,30 50,50 60,60 65,65 70,70
12 47 M 6 WNL NORMAL
STUDY
ABSENT present 30,30 25,20 30,35 40,40 40,50 50,45, 60,60
13 46 M 8 WNL NORMAL
STUDY
ABSENT present 30,40 40,30 40,35 30,40, 35,40 45,50 50,50
14 35 M 15 WNL NORMAL
STUDY
ABSENT absent 25,10 25,25 25,25 25,30 20,25 25,25 25,25
15 39 M 5 WNL NORMAL
STUDY
ABSENT pesent 30,25 25,35 35,40 45,45 45,45 60,70 50,50
16 46 M 10 WNL WITH DIP
AT 4K
NORMAL STUDY
ABSENT present 35,40 35,30 45,45 65,60 70,75 70,70 70,70
17 49 M 10 WNL WITH DIP
AT 4K
NORMAL STUDY
ABSENT present 60,30 70,40 65,40 65,40 75,40 70,35 50,40
18 44 M 5 WNL NORMAL
STUDY
ABSENT absent 35,25 20,25 25,25 35,35 20,15 15,15 25,25
19 50 M 5 WNL NORMAL
STUDY
ABSENT absent 30,30 35,35 20,25 25,25 15,15 15,25 15.2
20 38 M 4 WNL NORMAL
STUDY
ABSENT present 15,15 35,20 30,15 35,20 35,20 4,35 50,45
21 54 M 33 WNL WITH DIP
AT 4K
NORMAL STUDY
ABSENT present 30,35 40,35 55,45 60,70 65,75 65,70,, ,70,70
22 43 M 7 WNL NORMAL
STUDY
ABSENT present 30,35 35,40 35,45 40,45 45,40 45,50 55,50
23 38 M 18 WNL NORMAL
STUDY
24 35 M 10 WNL WITH DIP AT 4K
NORMAL STUDY
ABSENT present 30,30 30,35 40,50 50,65 70,80 70,70 60,60
25 33 M 3 WNL NORMAL
STUDY
ABSENT present 30,35 40,45 45,40 45,45 45,50 55,50 55,60
26 31 M 10 WNL WITH DIP
AT 4K
NORMAL STUDY
ABSENT present 30,25 35,35 50,40 55,55 70,65 70,70 70,55
27 45 M 21 WNL NORMAL
STUDY
ABSENT present 25,15 30,20 60,20 60,35 70,50 70,50
70,70
28 50 M 15 WNL WITH DIP
AT 4K
NORMAL STUDY
ABSENT present 35.3 50,45 65,40 80,60 70,60 60,50 60,50
29 37 M 18 WNL NORMAL
STUDY
ABSENT present 35,35 40,40 45,40 45,45 50,50 50,60 70,70
30 39 M 10 WNL NORMAL
STUDY
ABSENT present 25,30 25,20 40,40 55,50 60,55 50,50 70,70
31 65 M 30 WNL WITH DIP
AT 4K
NORMAL STUDTY
ABSENT present 25,30 35,30 40,30 55,35 80,80 70,70 50,50
32 38 M 7 WNL NORMAL
STUDY
ABSENT present 65,20 75,30 70,30 80,40 80,50 70,70 50,50
33 37 M 20 WNL NORMAL
STUDY
ABSENT present 30 ,25 35,25 30,30 35,30 35,55 70,75 70,70
34 46 M 6 WNL NORMAL
STUDY
ABSENT absent 20,15 25,15 25,15 30,10 25,25 20,20 NR,NR
35 41 M 15 WNL NORMAL
STUDY
ABSENT absent 25,15 25,20 20,15 30,20 15,20 5015 25,25
36 49 M 25 WNL WITH DIP
AT 4K
NORMAL STUDY
ABSENT present 30,45 40,45 40,45 50,50 60,55 55,50 50,50
37 27 M 3 WNL NORMAL
STUDY
38 43 M 5 WNL NORMAL STUDY
ABSENT present 35,35 40,45 45,45 50,55 50,60 65,60 55,60
39 25 M 10 WNL NORMAL
STUDY
ABSENT present 40,40 40,45 50,50 45,40 50,55
50,55
60,55
40 48 M 5 WNL NORMAL
STUDTY
absent present 30,40 15,20 20,25 25,25 60,30 60,45 50,55
41 26 M 4 WNL NORMAL
STUDTY
ABSENT present 35,40 45,40 40,45 50,55 50,45 45,40 45,40
42 28 M 4 WNL WITH DIP
AT 4K
NORMAL STUDY
ABSENT present 40,30 35,35 45,40 46,50 55,50 45,45 50,55
43 33 m 1 WNL NORMAL
STUDY
present absent 20,25 20,40 15,60 20,60 25,15 30,25 25,20
44 43 M 7 WNL WITHDIP
AT 4K
NORMAL STUDY
ABSENT present 20,35 30,35 25,35 40,45 50,60 70,70 50,50
45 35 m 6 WNL NORMAL
STUDY
absent present 35,45 40,45 40,45 45,40 40,45 45,45
4545
46 30 m 5 WNL NORMAL
STUDY
ABSENT present 40,40 35,30 45,45 40,45 50,40 45,45 40,45
47 38 m 4 WNL NORMAL
STUDY
absent present 30,30 35,35 40,40 45,45 40,40 40,40 40,35
48 35 m 6 WNL NORMAL
STUDY
ABSENT present 35,35 40,45 40,45 35,40 45,50 50,50 45,45
49 30 M 6 WNL NORMAL
STUDY
ABSENT present 40,45 40,40 40,45 45,40 50,50 55,50 60,55
50 34 m 4 WNL NORMAL
STUDY
Your digital receipt
This receipt acknowledges that Turnitin received your paper. Below you will find the receipt information regarding your submission.
Paper ID 383964557
Paper title assessment of hearing loss in high risk individuals using high frequency
audiometry
Assignment
title Medical
Author 22112102 . M.s. Ent MANJU JOSEPH . JOSEPH
E-mail [email protected]
Submission
time 22-Dec-2013 09:58PM
Total words 10018
First 100 words of your submission
INTRODUCTION Exposure to loud noise is the most common cause of sensori neural hearing loss in adults. It is an irreversible type of hearing loss typically affecting higher frequency initially then gradually progressing to lower frequency. NIHL affects day to day life, leads to