Copyright © 2002, American Society for Microbiology. All Rights Reserved.
Direct and Quantitative Single-Cell Analysis of Human
Immunodeficiency Virus Type 1 Reactivation
from Latency
Olaf Kutsch,
1Etty N. Benveniste,
1George M. Shaw,
2,3and David N. Levy
2*
Departments of Cell Biology1and Medicine,2The University of Alabama at Birmingham,
and The Howard Hughes Medical Institute,3
Birmingham, Alabama
Received 21 December 2001/Accepted 21 May 2002
The ability of human immunodeficiency virus type 1 (HIV-1) to establish latent infections in cells has received renewed attention owing to the failure of highly active antiretroviral therapy to eradicate HIV-1 in vivo. Despite much study, the molecular bases of HIV-1 latency and reactivation are incompletely understood. Research on HIV-1 latency would benefit from a model system that is amenable to rapid and efficient analysis and through which compounds capable of regulating HIV-1 reactivation may be conveniently screened. We describe a novel reporter system that has several advantages over existing in vitro systems, which require elaborate, expensive, and time-consuming techniques to measure virus production. Two HIV-1 molecular clones (NL4-3 and 89.6) were engineered to express enhanced green fluorescent protein (EGFP) under the control of the viral long terminal repeat without removing any viral sequences. By using these replication-competent viruses, latently infected T-cell (Jurkat) and monocyte/macrophage (THP-1) lines in which EGFP fluorescence and virus expression are tightly coupled were generated. Following reactivation with agents such as tumor necrosis factor alpha, virus expression and EGFP fluorescence peaked after 4 days and over the next 3 weeks each declined in a synchronized manner, recapitulating the establishment of latency. Using fluores-cence microscopy, flow cytometry, or plate-based fluorometry, this system allows immediate, direct, and quantitative real-time analysis of these processes within single cells or in bulk populations of cells. Exploiting the single-cell analysis abilities of this system, we demonstrate that cellular activation and virus reactivation following stimulation with proinflammatory cytokines can be uncoupled.
The regulation of retrovirus expression within the infected host is controlled at many levels by both viral and host factors. For complex retroviruses such as human immunodeficiency virus type 1 (HIV-1) and HIV-2, several viral elements con-tributecis and trans functions that regulate virus expression within host cells (23). The infected host cell, on the other hand, provides the transcription and translation machinery essential for the expression of viral proteins and viral replication. Fol-lowing integration of the viral cDNA into the cellular genome, HIV-1 expression leads to the production of infectious virus, frequently resulting in the death of the host cell. In some instances viral expression can be down-modulated, leaving the provirus in a latent state characterized by low or absent viral mRNA and protein production (11, 48). This latent state may persist within the host cell for the natural life span of the cell or until external factors induce the virus to resume expression. A substantial reservoir of latently infected cells has recently been shown to be established early in HIV infection in vivo within macrophages and memory T cells (3, 9, 14, 16, 18, 26, 27, 37, 41, 52). This reservoir of latently infected cells is thought to be a contributing factor to the failure of highly active antiret-roviral therapy to eradicate HIV-1 from the host (15, 16, 19). Thus, a better understanding of the underlying molecular
mechanisms of HIV-1 latency and reactivation is needed in order to develop targeted therapies that could control or erad-icate latently infected cells.
To date, it has been impossible to expand chronically in-fected primary cells; thus the most appropriate in vitro cell models for viral latency have been HIV-1-infected transformed cell lines such as ACH-2, J1.1, U1, and OM-10.1 (10, 22, 28, 29, 44). These cell lines contain one or two copies of integrated virus and constitutively display low levels of HIV-1 gene ex-pression. Studies of these cells have revealed important roles for the site of viral integration (54), for cellular (33–35, 43, 49, 56) and viral proteins (30, 38, 39, 42, 47), and for histone acetylation and DNA methylation (4, 5, 51, 53) in the estab-lishment and maintenance of latency. Nevertheless, the state of latency in these cells, on a population basis or at the single-cell level, can only be determined by indirect and time-consuming procedures (i.e., p24 enzyme-linked immunosorbent assay [ELISA], reverse transcriptase assay, and intracellular staining for viral proteins). As such, research on HIV-1 latency would benefit from a relevant model that is amenable to rapid and efficient analysis and through which useful pharmacological compounds capable of controlling HIV-1 reactivation may be efficiently screened.
To this end, we describe a reporter system to study HIV-1 latency and reactivation that combines the benefits of a latently infected immortal cell line with the convenience of using en-hanced green fluorescent protein (EGFP) as a marker for HIV-1 expression. To establish this system, two recombinant
* Corresponding author. Mailing address: University of Alabama at Birmingham, 848 Kaul Bldg., 720 S. 20th St., Birmingham, AL 35294-0024. Phone: (205) 934-0169. Fax: (205) 934-1580. E-mail: levy @uab.edu.
8776
on November 8, 2019 by guest
http://jvi.asm.org/
HIV-1 viruses based on the dual-tropic 89.6 strain and the T-cell-tropic NL4-3 strain were engineered to express EGFP, while preserving all viral nucleotide sequences and potential
ciselements. Following infection, three clonal, latently infected cell lines, representing both T-cell (Jurkat) and monocyte/ macrophage (THP-1) lineages were developed. In the resulting cell lines, named JNLGFP, J89GFP, and THP89GFP, EGFP fluorescence is tightly linked to HIV-1 protein production and can be used as a quantitative marker for HIV-1 expression on a single-cell basis by fluorescence microscopy or flow cytometry and can be used on a population basis by fluorometry.
We find that different stimuli which are known to promote viral expression (tumor necrosis factor alpha [TNF-␣], inter-leukin-1[IL-1], gamma interferon [IFN-␥], phorbol 12-my-ristate 13-acetate [PMA], and trichostatin A [TSA]) differ in both the percentage of cells which demonstrate viral reactiva-tion and the extent of reactivareactiva-tion within individual cells. Dif-ferences between the T-cell and macrophage cell lines were seen as well, highlighting the apparent complexity of the pro-cesses involved in HIV-1 reactivation.
The ability of this system to quantify HIV-1 reactivation and subsequent replication on a single-cell level can be simulta-neously combined with additional analyses (e.g., cell cycle anal-ysis, apoptosis detection, and antibody staining techniques). Using this method we observe that virus activation and cellular activation by proinflammatory cytokines can be uncoupled. In THP89GFP cells IFN-␥induces cellular activation in the entire cell population while stimulating virus expression on a small subset of these cells. Likewise, low doses of TNF-␣ could induce expression of cellular activation markers in the com-plete population of cells while activating virus expression in only a subset.
Following TNF-␣-induced virus reactivation in THP89GFP cells, a recapitulation of the latency induction process is ob-served over time, in which the population of cells shows a synchronous and progressive down-modulation of HIV-1 ex-pression, reconstituting a fully latent and reactivatable state.
MATERIALS AND METHODS
Cell culture and reagents.Jurkat-derived and THP-1-derived cell lines were
maintained in RPMI 1640 supplemented with 2 mML-glutamine, 100 U of
penicillin/ml, 100g of streptomycin/ml, and 10% heat-inactivated fetal bovine
serum. THP89GFP cells grow semiadherent; therefore all experiments using THP89GFP cells were performed in ultralow-attachment plates (Costar, Acton, Mass.). 293T cells were maintained in Dulbecco’s modified Eagle medium
sup-plemented as for RPMI 1640. Cytokines (TNF-␣, IL-1, IL-2, IL-6, IFN-␥, and
lymphotoxin alpha [LT-␣]) were obtained from R & D Systems (Minneapolis,
Minn.). PMA and TSA were purchased from Sigma (St. Louis, Mo.). HIV-1 p24 Gag protein ELISA kits were purchased from Coulter Diagnostics (Miami, Fla.).
Construction of HIV-1 89ENG and HIV-1 NLENG1.NL4-3 hemigenomic plasmids p83-5 and p83-10 were obtained through the National Institutes of Health AIDS Research and Reference Reagent Program from Ronald Desro-siers (2, 20). The 89.6 hemigenomic plasmids were a kind gift from Ronald Collman, University of Pennsylvania School of Medicine, Philadelphia, Pa. (2,
20). In brief, recombinant hemigenomic HIV-1 plasmids 3⬘89ENG and
3⬘NLENG1 were similarly constructed by using primer extension and sequence
overlap extension (Deep Vent polymerase; New England Biolabs) to link the EGFP coding sequence to the HIV-1 genome and to introduce desired restric-tion sites and Kozak sequences into the DNA fragments to be ligated. The cloning was designed such that the EGFP open reading frame was placed directly
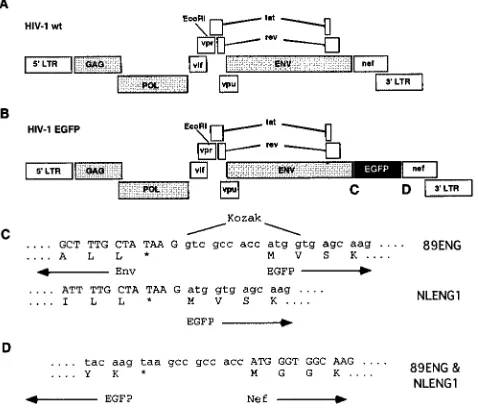
between theenvandnefgenes within the HIV-1 sequence (Fig. 1).
For NLENG1, three PCR products were generated; these products
repre-sented (i) the NL4-3 genome from the uniqueBamHI site withinenvto the
junction between the end ofenvand the start of the EGFP gene, (ii) the EGFP
gene, and (iii) NL4-3 from the Kozak sequence within the junction with the
EGFP gene to the uniqueBbrPI site within the 3⬘LTR of NL4-3. Products i and
ii were then linked by using PCR sequence overlap extension, and the resulting
product was cut withBamHI andNcoI (within the Kozak sequence). Product iii
was cut withNcoI andBbrPI, and theBamHI-BbrPI fragment was removed from
p83-10. p83-10 plus the cut PCR products were ligated to create 3⬘NLENG1.
For 89ENG, three PCR products were generated similarly to those for the
NLENG1 construct except that the 5⬘and 3⬘restriction sites within the 89.6 3⬘
hemigenomic plasmid wereBsaBI andNheI sites, respectively. Also, a Kozak site
was introduced upstream of the EGFP gene. These three products were cut and
cloned into the 3⬘89.6 hemigenomic plasmid to generate 3⬘89ENG.
Generation of virus stocks.3⬘ and 5⬘ HIV-1 hemigenomic plasmids were
linearized at the sharedEcoRI site in each plasmid. The DNAs were extracted
with phenol-chloroform, precipitated with isopropanol, and resuspended in
wa-ter. 293T cells were transfected with the two plasmids by using CaPO4
(Strat-agene), and 48 h later the supernatants were used to infect CEMx174 cells. At near-peak virus production, as measured visually by EGFP fluorescence and cell death, the medium was changed, and after 24 h this medium was collected,
titered, and stored in aliquots at⫺80°C until use.
Flow-cytometric analysis. Flow-cytometric analysis was performed with a FACStar Plus and CellQuest software (BD Biosciences). For analysis of surface antigen expression, cells were washed with phosphate-buffered saline (PBS) and
then preincubated with 50l of PBS containing 0.01% azide and 10% rabbit
serum to block nonspecific binding. The directly conjugated antibodies were added, incubated at 4°C for 30 min, and washed in 4 ml of PBS prior to flow-cytometric analysis.
Photomicroscopy.Cells were photographed in culture through a Nikon TE300
inverted microscope and Hoffman optics (Modulation Contrast, Inc.) at⫻100 by
using a SenSys:1401E B&W cooled charge-coupled device camera (Photomet-rics, Inc.). To detect EGFP fluorescence the Piston green fluorescent protein filter set was used (Chroma, Inc.).
Fluorometric analysis of HIV-1 reactivation.Cells were analyzed for cumula-tive EGFP fluorescence in flat-bottom 96-well tissue culture plates (Costar) in
200l of PBS by using a BIO-TEK FL600 fluorometer. Excitation was set at 435
nm, and emission was set at 530 nm. Ideal excitation for EGFP, as given by the manufacturer (Clontech, Palo Alto, Calif.) is at 488 nm, and ideal emission is at 508 nm.
RESULTS
[image:2.587.303.542.76.280.2]Selection of latent and reactivatable HIV-1-infected clonal cell lines.Jurkat (T-lymphocytic) and THP-1 (promonocytic) cells were infected with the EGFP-containing recombinant
FIG. 1. Schematic diagram of HIV-1 89ENG and HIV-1 NLENG1. (A and B) Wild-type HIV-1 (A) and recombinant EGFP viruses (B), showing placement of the EGFP gene within the HIV-1 genome. (C and D) DNA sequences of the 5⬘and 3⬘junctions between HIV-1 and the EGFP gene.ⴱ, translational stop codon.
on November 8, 2019 by guest
http://jvi.asm.org/
viruses NLENG1 (T cell-tropic) and 89ENG (dual-tropic) (Fig. 1). Four days following infection, EGFP-positive cells were cloned by using the automatic cell deposition unit of the FACStar Plus, and the surviving chronically infected clones were monitored for EGFP expression. Clones which lost fluo-rescence in the majority of cells were selected for further characterization. From this set, clones in which EGFP expres-sion could be reactivated by stimulation with TNF-␣, a pow-erful activator of the HIV-1 LTR (22, 32), were expanded.
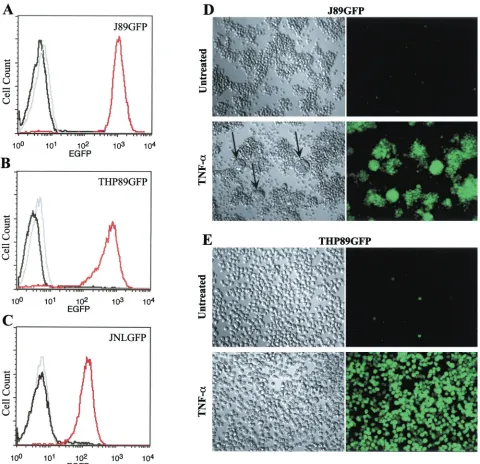
Finally, three cell lines representing each combination of virus and natural cellular target, J89GFP and THP89GFP (Fig. 2) and JNLGFP (data not shown), were chosen for further study because of low constitutive EGFP fluorescence and strong up-regulation of EGFP expression following TNF-␣stimulation.
[image:3.587.53.533.73.537.2]Correlation of EGFP fluorescence, p24 Gag protein expres-sion, and secretion of infectious viral particles in JNLGFP, J89GFP, and THP89GFP cells. To examine whether EGFP fluorescence in JNLGFP, J89GFP, and THP89GFP cells can
FIG. 2. Induction of EGFP expression in J89GFP and THP89GFP cells by TNF-␣stimulation. JNLGFP, J89GFP, and THP89GFP cells (106/ml) were stimulated with TNF-␣(10 ng/ml), and, 48 h later, EGFP expression was measured by flow cytometry. For the histogram analysis, the parental Jurkat E6-1 and THP-1 cells (gray lines) were used as negative controls, and expression in these cells was compared to EGFP expression in unstimulated (black lines) and TNF-␣ (10 ng/ml)-stimulated JNLGFP, J89GFP, and THP89GFP cells (red lines). (D and E) Induction of EGFP expression by TNF-␣as visualized by light microscopy (left) and fluorescence microscopy (right). Black arrows (D) indicate syncytium formation between cells in J89GFP cell cultures following TNF-␣stimulation. Results are representative of five independent experi-ments.
on November 8, 2019 by guest
http://jvi.asm.org/
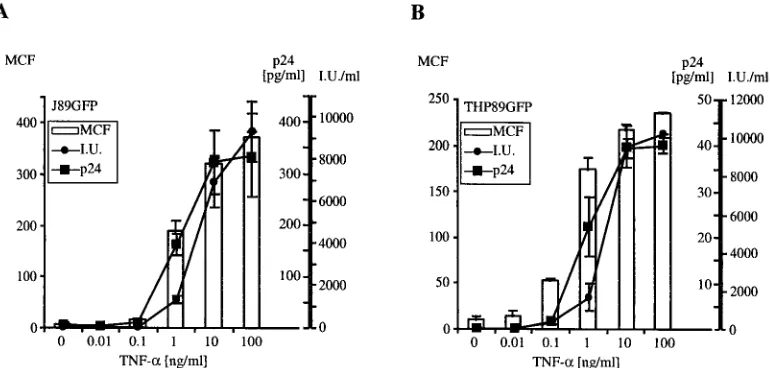
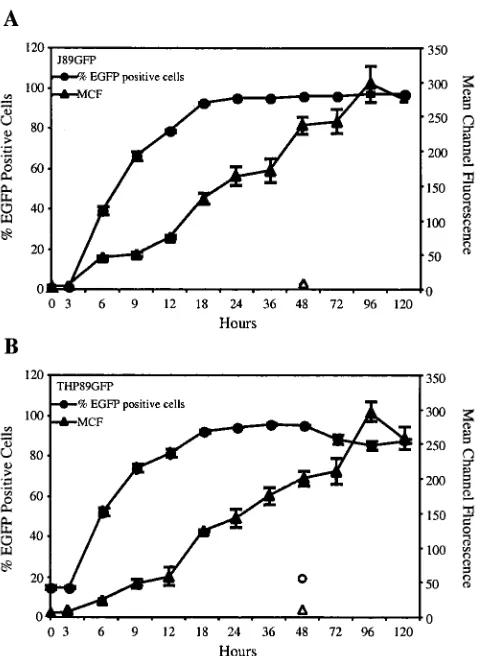
be used as a quantitative marker for HIV-1 expression, we stimulated the cells with various concentrations of TNF-␣and after 48 h analyzed EGFP expression, p24 secretion, and in-fectious-virus production. Cells were further found to express HIV-1 Vpu at levels similar to those seen in CEMx174 cells infected with wild-type HIV-1 89.6. Nef expression in THP89GFP and J89GFP cells was below the detection range of Western blotting (data not shown). In an uninduced state, a small number of cells in each cell line (2 to 5%) exhibited some degree of spontaneous EGFP fluorescence (Fig. 2A and B). In J89GFP and THP89GFP cells, reactivation of EGFP fluores-cence over background can be detected at 0.1 ng of TNF-␣/ml (Fig. 3), indicating stimulation of low levels of early HIV-1 gene transcription and translation, which does not lead to the production of measurable secretion of p24 Gag (a late gene product) or infectious virus (Fig. 3). Stimulation with 1 ng of TNF-␣/ml leads to a further increase in expression of EGFP and to measurable production of p24 protein and infectious virus. Higher concentrations of TNF-␣ (10 and 100 ng/ml) generated a coordinated enhancement of EGFP expression, p24 secretion, and production of infectious viral particles. A similar correlation of EGFP and p24 expression upon reacti-vation of latent HIV-1 infection was seen in JNLGFP cells, although this clone produced no infectious viral particles (data not shown). Using fluorescence and visible-light microscopy we also observed that, in J89GFP cells, TNF-␣-mediated HIV-1 reactivation was accompanied by the formation of syncytia (Fig. 2D, lower left), probably resulting from the interaction of the newly expressed HIV-1 envelope protein with cellular CD4 receptors on neighboring cells. The earliest detectable increase in EGFP fluorescence in both cell types was seen at 6 h after stimulation. The proportion of EGFP-positive cells reached its maximum (92 to 98%) after 24 to 48 h, while the mean fluo-rescence intensity of the population increased until 4 days, suggesting a continuing accumulation of viral proteins over this
period of time (Fig. 4). Transduction of cells with murine retrovirus constructs containing the HIV-1tatgene reactivated virus expression in each cell line, while control viruses lacking the tat gene failed to do so (data not shown). This result indicates that latency in these cells is the result of low LTR activity and not simply the result of suboptimal late-gene ex-pression.
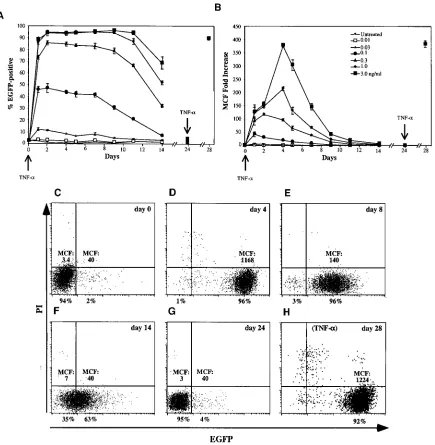
[image:4.587.101.486.76.260.2]Synchronous reversion to latency in THP89GFP cells. We next monitored EGFP expression in THP89EGFP cells over a extended period of time after TNF-␣stimulation in order to examine whether varying the dose of TNF-␣resulted in pro-longed or transient reactivation of virus expression. For this analysis we limited the range of TNF-␣to 0.03 to 3 ng/ml, as higher levels led to substantial cell death after 4 days. At each dose of TNF-␣tested, the maximum percentage of cells that were EGFP positive was achieved after 24 to 48 h. While the fluorescence intensity peaked during this time as well in the cultures receiving 0.03 to 0.3 ng/ml, peak fluorescence intensity was observed after 4 days in the cultures receiving the highest doses of TNF-␣(1 and 3 ng/ml), consistent with the data from Fig. 4. Over the course of the following days and weeks, the expression of virus as measured by EGFP fluorescence from these cells steadily declined (Fig. 5B), while the percentage of cells which continued to produce at least some virus declined in a much more gradual manner (Fig. 5A). Interestingly, rather than individual cells spontaneously ceasing virus expression, a continual and synchronous decline in virus production from the population of cells was observed (Fig. 5C to F). Upon reexposure to TNF-␣, virus expression, as measured by EGFP fluorescence (Fig. 5A to C; day 28), and infectious-virus pro-duction (data not shown) were once again reactivated in these cells, indicating that the process of induction of latency was recapitulated after the first reactivation.
Reactivation of latent HIV-1 by various cytokines and
chem-FIG. 3. Correlation of EGFP expression, HIV-1 Gag p24 protein production and secretion of infectious viral particles in J89GFP and THP89GFP cells. J89GFP (A) and THP89GFP (B) cells (106cells/ml) were stimulated for 48 h with TNF-␣at various concentrations (0 to 100 ng/ml). After 48 h, supernatants were collected and used to determine HIV-1 p24 Gag protein (p24) concentrations by ELISA (squares) and the numbers of infectious viral particles (I.U.) secreted by the cells (circles) were assessed by limiting-dilution endpoint analysis. EGFP expression was analyzed by flow cytometry and is expressed as MCF intensity (bars). Results represent the means⫾standard deviations of three independent experiments.
on November 8, 2019 by guest
http://jvi.asm.org/
ical agents.The replication of HIV-1 in vivo is influenced by the local cellular environment, including cytokines that regu-late the immune response. Several of these are known to ac-tivate or inhibit HIV-1 replication under various circum-stances, and some, such as IL-2, have been explored as part of anti-HIV-1 treatment regimens (17). We tested a panel of cytokines (TNF-␣, LT-␣, IL-1, IFN-␥, IL-2, and IL-6) and chemical compounds (PMA and TSA) for their ability to re-activate HIV-1 expression within these cell lines (Table 1). TNF-␣, LT-␣, IL-1, and IFN-␥were able to reactivate latent HIV-1 infection in THP89GFP, but only TNF-␣ and LT-␣ reactivated HIV-1 infection in J89GFP cells, while IFN-␥and IL-1failed to do so. Interestingly, after 48 h, only a subpopu-lation of THP89GFP cells reactivated virus expression in re-sponse to IFN-␥and IL-1(Table 1). PMA, a potent activator of HIV-1 LTR expression through protein kinase C and ulti-mately NF-B activation (34), produced a strong increase in EGFP expression in J89GFP cells. Its effect on HIV-1
repli-cation in THP89GFP cells was less pronounced, as HIV-1 expression was reactivated in only 57% of the viable cells. TSA, an inhibitor of histone deacetylases, said to reactivate HIV-1 infection (6, 53), also had a strong effect on HIV-1 reactivation in J89GFP cells. The effect of TSA on HIV-1 replication in THP89GFP cells again was less profound (34% reactivation). Although TNF-␣, PMA, and TSA all produced virus reactiva-tion in almost all J89GFP cells, the degree of reactivareactiva-tion within individual cells, as measured by mean channel fluores-cence (MCF) intensity, was clearly lower following PMA and TSA exposure than following TNF-␣stimulation at 48 h (Table 1) and all other time points tested (data not shown). Macro-phage inhibitory protein 1␣, MCP-1, SDF-1␣, and IP-10 failed to reactivate HIV-1 expression in these cell lines (data not shown).
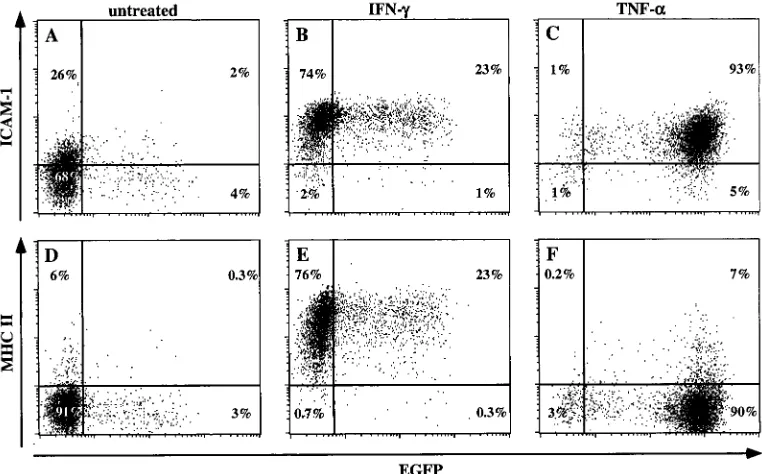
Simultaneous analysis of cell activation, CD4 down-modu-lation and virus reactivation following TNF-␣exposure.The importance of latency to the life cycle of HIV in vivo arises in part from the linkage between the status of immune system activation and the level of virus replication within those cells. It is commonly accepted that the latent state generally exists within the resting pool of CD4-positive T cells and monocytes/ macrophages, and, importantly, the activation of those latently infected cells is considered the likely impulse that reactivates virus replication. Using a salient feature of this system, the ability to coordinately monitor virus expression and other cel-lular events, we simultaneously examined virus expression and the activation state of THP89GFP cells following TNF-␣ stim-ulation (Fig. 6). As an indication of cellular activation, we stained the cells for intercellular adhesion molecule 1 (ICAM-1) expression, which increases in cells of the monocyte/ macrophage lineage following TNF-␣ exposure (1). While HIV-1 reactivation was achieved in only a subset (67%) of cells exposed to 0.1 ng of TNF-␣/ml, 22% of cells showed full expression of ICAM-1 while remaining negative for HIV-1 expression (Fig. 6B), indicating that in this population cellular activation did not result in viral reactivation. This partial-re-activation pattern could be overcome with increasing levels of TNF-␣(Fig. 6C and D).
Down-modulation of cell surface CD4 following HIV-1 in-fection is a consequence of coexpression of CD4 and the viral Vpu, Nef, and gp120 envelope proteins within the infected cells (13). CD4 expression on THP89GFP cells is identical to that on the parental THP-1 cells prior to viral reactivation (data not shown), as would be expected in the absence of HIV-1 expression in these cells. Also as expected, TNF-␣ -mediated virus reactivation coincided in a concentration-de-pendent manner with a marked decrease in CD4 surface stain-ing (Fig. 6F to H). At the highest TNF-␣ concentration, a substantial reduction of CD4 surface expression was evident in the majority of cells, even at the early time point (24 h) shown (Fig. 6H).
[image:5.587.44.284.72.400.2]Major histocompatibility complex class II (MHC-II) expres-sion, like that of ICAM-1, is up-regulated on cells of the mono-cyte/macrophage lineage in response to some proinflammatory signals, such as IFN-␥(Fig. 7B; shown at the optimal concen-tration for MHC-II induction). Though IFN-␥ strongly up-regulated MHC-II expression in these cells, it is a weak inducer of HIV-1 reactivation at any concentration (Fig. 7B and data not shown). This is in stark contrast to TNF-␣, which, while it
FIG. 4. Kinetics of HIV-1 reactivation following TNF-␣treatment in J89GFP and THP89GFP cells. J89GFP (A) and THP89GFP (B) cells (106cells/ml) were stimulated with TNF-␣ (10 ng/ml) and then subjected to flow-cytometric analysis at the indicated times (3 to 120 h). EGFP expression was determined either as the percentage of EGFP-positive cells in the culture or as MCF intensity of the total population. Untreated control samples were taken after 48 h (open circle, percent EGFP-positive cells; open triangles, MCF intensity). Dead cells were excluded by propidium iodide staining. Results rep-resent the means⫾standard deviations of three independent experi-ments.
on November 8, 2019 by guest
http://jvi.asm.org/
fails to induce expression of MHC-II (Fig. 7C), at concentra-tions above 0.1 ng/ml is a powerful inducer of both ICAM-1 and virus expression in the whole cell population. Thus, as also seen in Fig. 6B, in which a low concentration of TNF-␣is used, in THP89GFP cells cellular activation and virus reactivation can be dissociated.
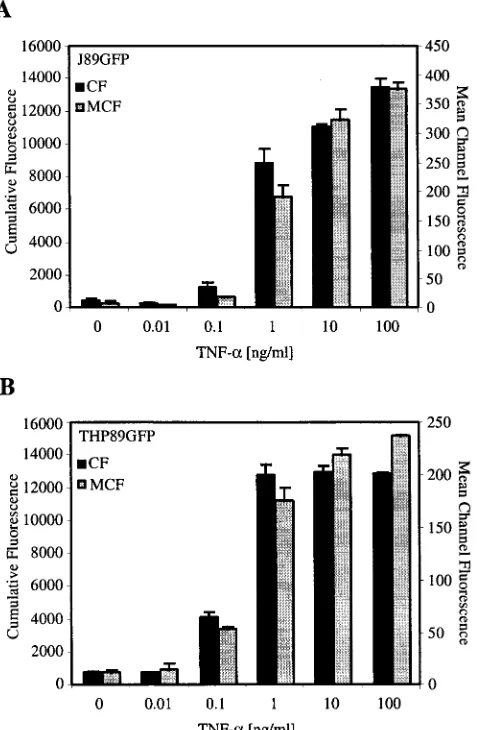
Plate-based fluorometric analysis of viral reactivation.We next investigated whether viral reactivation could be conve-niently monitored by a 96-well-plate-based fluorometric assay. This type of analysis would be easily scalable for the analysis of
[image:6.587.77.512.76.521.2]many samples in a short period of time using relatively small numbers of cells and reagents. We compared fluorometric analysis using a 96-well format to flow cytometry for sensitivity of EGFP detection in J89GFP cells. Cells were stimulated with various concentrations of TNF-␣for 24 h, and EGFP expres-sion was then measured as cumulative fluorescence with the fluorometer or as MCF intensity by flow cytometry. Flow cy-tometry here revealed a 25-fold increase in MCF intensity in J89GFP cells stimulated with 100 ng of TNF-␣/ml (Fig. 8A), compared to that in untreated control cells. A 26-fold increase
FIG. 5. Synchronous recapitulation of latency induction following TNF-␣stimulation. THP89GFP cells (106cells/ml) were stimulated with various concentrations of TNF-␣(0.01 to 3.0 ng/ml) (restimulation was with 3.0 ng of TNF-␣/ml on day 24 [down arrows]), and EGFP expression, depicted as the percentage of EGFP-positive cells (A) or the EGFP MCF intensity (B), was monitored by flow cytometry over time. (C to H) Analysis of the synchronous shift of the entire cell population after TNF-␣stimulation from latency to fully active HIV-1 expression and the reversal to a latent state of HIV-1 infection, depicted as dot plots showing EGFP expression and propidium iodide (PI) uptake in THP89GFP cells stimulated with 3 ng of TNF-␣/ml on day 0 (C) and 4 (D), 8 (E), 14 (F), and 24 days (G) after stimulation with 3.0 ng of TNF-␣/ml and after restimulation with 3.0 ng of TNF-␣/ml on day 24.
on November 8, 2019 by guest
http://jvi.asm.org/
in cumulative fluorescence for cells from the same experiment was measured with the fluorometer, indicating a very close correlation between the two methods. Similar results were obtained for THP89GFP cells (Fig. 8B).
DISCUSSION
The need for in vitro models of latency has been partially filled over the past years by HIV-1-infected transformed cell lines such as ACH-2, J1.1, U1, and OM-10.1 (9, 21, 27, 28). Virus expression in these cell lines can be induced by cellular (7, 10) or viral factors (12, 30, 38, 39) and chemical agents (29,
36) or inhibited by pharmacological agents (31, 55). Establish-ment of latency in these cell lines has been linked to mutations in viral genes such astat(24) and the TAR region (25), the site of viral integration (54), and to certain cellular (34, 35) and viral proteins (30, 38, 39, 47). A particularly important insight into the regulation of HIV-1 expression comes from the ob-servation that histone acetylation and DNA methylation pat-terns within and downstream of the viral promoter/enhancer elements can be critical to the suppression of HIV-1 expression or its release (4, 5, 50, 51, 53). HIV-1 Tat participates in these processes in part by recruiting p300 and CREB-binding pro-tein, a protein with histone acetyltransferase activity, to the viral promoter (6, 21, 40). How these DNA acetylation and methylation patterns are established in the first place and how they may be influenced by cellular events are areas of intensive ongoing research.
Studies on the mechanisms governing HIV-1 latency would benefit from an in vitro system where the level and timing of HIV-1 expression can be quantified easily and directly at the single-cell level. The reporter cell lines described here have several features that make them especially useful in this con-text. The incorporation of the EGFP gene into the HIV-1 genome resulted in control of cellular fluorescence that is strictly coordinated with the expression of viral proteins, per-mitting immediate and quantitative measurement of the extent of viral expression in cells by using flow cytometry, fluores-cence microscopy, or plate-based fluorometry. Flow-cytometric analysis allows both population and single-cell quantification of viral reactivation without any fixation, staining, or other manipulation of the cells that might affect the results or the ability to further manipulate and analyze the relevant cell pop-ulations. Multicolor flow-cytometric analysis permits a variety of cellular and viral events to be correlated.
[image:7.587.44.284.94.210.2]Two cell lines were constructed by using Jurkat cells, which
[image:7.587.104.487.482.678.2]FIG. 6. Correlation of HIV-1 reactivation with ICAM-1 and CD4 expression by using two-color flow cytometry. THP89GFP cells (106cells/ml) were stimulated with various concentrations of TNF-␣(0.1 to 10 ng/ml). Twenty-four hours after stimulation, cells were stained for the expression of ICAM-1 (A to D), as a marker of cell activation, and CD4 (E to H). Levels of EGFP, ICAM-1, and CD4 expression were then quantified by flow-cytometric analysis. Numbers represent the percentages of cells in the respective quadrants. Results are representative of four independent experiments.
TABLE 1. Reactivation of latent HIV-1 infection in THP89GFP and J89GFP cells by cytokines and chemical agentsa
Stimulus MCF intensity (% positive cells) for:
J89GFP THP89GFP
Unstimulated 13 (4) 17 (5)
TNF-␣ 1,221 (92) 726 (95)
LT-␣ 1,080 (94) 575 (92)
IFN-␥ 21 (6) 132 (25)
IL-1 24 (6) 117 (32)
IL-2 14 (4) 19 (6)
IL-6 14 (4) 19 (6)
PMA 691 (93) 288 (57)
TSA 272 (82) 177 (34)
aReactivation of latent HIV-1 infection is indicated by MCF intensity and the
percentage of EGFP-positive cells. J89GFP and THP89GFP cells were stimu-lated for 48 h and then analyzed for EGFP expression by flow cytometry. For all tested cytokines the receptors were shown to be present on either J89GFP or
THP89GFP cells by other relevant functional assays. TNF-␣ and LT-␣were
added at 10 ng/ml, IL-2 and IFN-␥were added at 200 U/ml, IL-1was added at
2 ng/ml, and IL-6 was added at 50 ng/ml. The optimal concentration of PMA
was 30 ng/ml. For TSA maximal subcytotoxic concentrations were 1M for
THP89GFP and 300 nM for J89GFP cells. Addition of higher concentrations of PMA or TSA resulted in greatly increased cell death in the respective cell lines. Results are representative of two independent experiments.
on November 8, 2019 by guest
http://jvi.asm.org/
have been widely used as models for T-cell studies. The third cell line is based on THP-1 cells, which constitute the most widely employed transformed cell line for studies of monocytes/ macrophages. The THP-1-based latent cell line (THP89GFP) and one of the Jurkat-based cell lines (J89GFP) were infected with 89ENG, whose parental virus, 89.6, is considered a near-primary dual CXCR4- and CCR5-tropic molecular clone (20). The other Jurkat cell line was infected with a recombinant virus (NLENG1) whose parental virus, CXCR40-tropic NL4-3, is the best-characterized HIV-1 strain. We have observed iden-tical patterns in response to different stimuli (TNF-␣, LT-␣, PMA, and TSA) in the two Jurkat-based cell lines infected with the divergent viruses (Table 1 and data not shown). On the other hand, differences in the responses to activating agents between the Jurkat- and THP-1-based cell lines are apparent (Table 1). THP89GFP cells, but not J89GFP cells, responded to IFN-␥and IL-1by reactivating HIV-1 expres-sion (Table 1), despite the fact that J89ENG cells responded to IFN-␥and IL-1treatment by increasing surface ICAM-1 ex-pression (data not shown). Differences between J89GFP and THP89GFP cells in the responses to PMA and to deacetylase inhibitor TSA were also apparent.
The importance of postintegration viral latency to the nat-ural history of HIV-1 infection in vivo has perhaps been un-derestimated until fairly recently. The failure of highly active antiretroviral therapy to allow complete removal of virus from the body is due, at least in part, to the reemergence of viral replication from the pool of latently infected cells (15). In the past several years, latent HIV-1 has been identified in resting memory (14, 18, 19, 37) and naive (45) T cells, from which virus may be rescued long after infection of these cells.
The prevailing model of postintegration HIV-1 T-cell
la-tency in vivo requires infection of an activated cell just before the cell enters a quiescent state (46). The reservoir of virus identified within the memory T-cell compartment is thought to be generated by infection of antigen-activated T cells (18, 19), while naive latently infected cells may arise through infection of CD4-positive thymic precursors (8). In either case, it is believed that in vivo viral latency is the direct result of an intracellular environment lacking the necessary factors for ef-ficient transcription of the viral promoter. Following induction of the latent state, maintenance of latency may be assisted through cellular processes directed at the viral promoter re-gion, such as chromatin modifications including histone deacetylation or DNA methylation (4, 5, 50, 51, 53). Because of the extremely long half-lives of these latent viral reservoirs, therapeutic reactivation is thought to be essential to achieve eradication of HIV-1 infection from patients. Administration of IL-2 as part of the treatment schedule has thus far failed to achieve clinical efficacy, emphasizing the difficulty in reaching the latent compartments with the proper signals for virus re-activation.
[image:8.587.101.482.76.313.2]Unlike latently infected cells in the body, which can be identified ex vivo within the resting population of T lympho-cytes, the cell lines described here are constantly proliferating, performing DNA synthesis and mitosis, and expressing genes at high levels. The finding by Brooks et al. (8) that reactivation of HIV-1 gene expression within thymocytes can be achieved in the absence of cellular DNA synthesis indicates that events more closely linked to cell activation than to increased cell proliferation are key to HIV-1 reactivation. NF-B is a crucial factor for promoting transcriptional initiation and elongation from the HIV-1 LTR, and its activity may be induced in the
FIG. 7. Differential regulation of MHC-II and HIV-1 expression following stimulation with TNF-␣or IFN-␥. THP89GFP cells (106cells/ml) were stimulated with IFN-␥(300 U/ml) (B and E) or TNF-␣(1 ng/ml) (C and F). Forty-eight hours after exposure, cells were stained for the expression MHC-II (A to C) or ICAM-1 (D to F). Levels of EGFP, ICAM-1, and MHC-II expression were then quantified by flow-cytometric analysis. Numbers represent the percentages of cells in the respective quadrants. Results are representative of two independent experiments.
on November 8, 2019 by guest
http://jvi.asm.org/
absence of cellular proliferation by agents such as PMA and TNF-␣(8, 37).
By exploiting the single-cell analysis capabilities of this sys-tem, we found that at least under certain circumstances cellular activation may be induced in the absence of virus reexpression. Using ICAM-1 as a cell activation marker, we observed that HIV-1 reactivation and cell activation can be uncoupled when low concentrations of TNF-␣are applied (Fig. 6B). Low doses of TNF-␣(0.1 ng/ml) apparently resulted in cellular activation of nearly the complete population of cells, as indicated by the uniform up-regulation of ICAM-1 expression, but HIV-1 was reactivated in only a subset of these cells. Also, IFN-␥ stimu-lation, which led to a strong activation of the THP89GFP cells, as indicated by increases in MHC-II and ICAM-1 expression,
did not result in substantial reactivation of the latent HIV-1 infection. Each of these patterns persisted for at least 96 h, the longest interval tested, indicating that the uncoupling of cellu-lar and viral activation was not the result of a simple kinetic difference between the two. Therapies which seek to activate HIV-1 expression for the purpose of making these cells vul-nerable to antiviral therapy or immune responses may need to consider that not all agents which promote cellular activation may in fact reactivate virus from all cells.
We have also found evidence for stochastic events in creat-ing and maintaincreat-ing the latent state in cells. The subcloncreat-ing of unstimulated cells from each of the cell lines described here occasionally generates a cell line that is a constitutive producer of virus. Other subclones differ from the parental cell lines in exhibiting no spontaneously fluorescent cells or detectable p24 Gag protein, and these are uniformly unresponsive to TNF-␣ induction of virus expression (data not shown). Thus, while an important role for the site of viral integration has been found for many latently infected cells (54), clearly the outcome of HIV-1 infection is governed by complex and mutable pro-cesses. By observing recently infected cells sorted for EGFP fluorescence, we observed loss of EGFP in some cells in as little as 2 days, indicating that down-modulation of HIV-1 gene expression can occur rapidly following infection (data not shown). The defined latent reservoirs in vivo are composed of quiescent nonproliferating cells, but it may be possible for HIV-1 to enter latency in some cells which have yet to transi-tion back to a nonproliferating state. Whether such cells exist in vivo is unknown, but since existing methodologies do not permit their detection, the relevant experiments have not been performed.
Another interesting and useful aspect of the system de-scribed herein is the ability of HIV-1 to return to a latent state following reactivation (Fig. 5). Interestingly, following reen-trance into the latent state, the virus could be fully reactivated once again, indicating that the original latent state has been reconstituted. As such, this system not only allows for the detailed study of HIV-1 reactivation, but also enables the con-trolled study of processes involved in the achievement of la-tency. It is most likely, we believe, that both this recapitulation of latency induction and the stochastic events described above are controlled by cellular modifications at the viral promoter, including histone acetylation and deacetylation events and DNA methylation patterns. Examination of these patterns in clonally related cell lines which exhibit divergent HIV-1 ex-pression properties should be illuminating, and these patterns are the subject of current investigation in our laboratories.
ACKNOWLEDGMENTS
O.K. and E.N.B. were supported in part by NIH grant NH55795 and amfAR research grant 02797-RG. D.N.L. and G.M.S. were supported in part by NIH grants R37 AI35467 and U01 AI41530. D.N.L. was additionally supported by Elizabeth Glaser Pediatric AIDS Founda-tion Scholar Award PF-77379.
We thank Gautam Bijour for assistance with the fluorometer, Marion Spell for expert operation of the flow cytometer/cell sorter, and Shaun Sparacio for assistance in running E. N. Benveniste’s lab-oratory.
REFERENCES
[image:9.587.46.286.79.444.2]1.Abe, Y., M. Gatanaga, Y. Osuka, S. Kimura, R. A. Burger, G. A. Granger, and T. Gatanaga. 1993. Role of 55- and 75-kDa tumor necrosis factor
FIG. 8. Comparison of the abilities of flow cytometry and 96-well-plate-based fluorometric analysis to detect changes in the replication state of HIV-1 infection in J89GFP and THP89GFP cells. J89GFP (A) and THP89GFP (B) cells (106 cells/ml) were stimulated with different concentrations of TNF-␣(0 to 100 ng/ml) for 24 h, washed twice with PBS, and analyzed for expression of EGFP by flow cytom-etry (gray) or 96-well-based fluorometric analysis (black). EGFP flu-orescence was determined as MCF intensity by flow cytometry and as cumulative fluorescence (CF) by fluorometric analysis. Results repre-sent the means⫾standard deviations of three independent experi-ments.
on November 8, 2019 by guest
http://jvi.asm.org/
membrane receptors in the regulation of intercellular adhesion molecule-1 expression by HL-60 human promyelocytic leukemia cells in vitro. J.
Immu-nol.150:5070–5079.
2.Adachi, A., H. E. Gendelman, S. Koenig, T. Folks, R. Willey, A. Rabson, and M. A. Martin.1986. Production of acquired immunodeficiency syndrome-associated retrovirus in human and nonhuman cells transfected with an
infectious molecular clone. J. Virol.59:284–291.
3.Bagasra, O., and R. J. Pomerantz.1993. Human immunodeficiency virus type I provirus is demonstrated in peripheral blood monocytes in vivo: a study utilizing an in situ polymerase chain reaction. AIDS Res. Hum.
Ret-roviruses9:69–76.
4.Bednarik, D. P., J. A. Cook, and P. M. Pitha.1990. Inactivation of the HIV LTR by DNA CpG methylation: evidence for a role in latency. EMBO J.
9:1157–1164.
5.Bednarik, D. P., J. D. Mosca, and N. B. Raj.1987. Methylation as a
modu-lator of expression of human immunodeficiency virus. J. Virol.61:1253–1257.
6.Benkirane, M., R. F. Chun, H. Xiao, V. V. Ogryzko, B. H. Howard, Y. Nakatani, and K. T. Jeang.1998. Activation of integrated provirus requires histone acetyltransferase. p300 and P/CAF are coactivators for HIV-1 Tat.
J. Biol. Chem.273:24898–24905.
7.Biswas, P., G. Poli, A. L. Kinter, J. S. Justement, S. K. Stanley, W. J. Maury, P. Bressler, J. M. Orenstein, and A. S. Fauci.1992. Interferon-␥induces the expression of human immunodeficiency virus in persistently infected promonocytic cells (U1) and redirects the production of virions to intracy-toplasmic vacuoles in phorbol myristate acetate-differentiated U1 cells. J.
Exp. Med.176:739–750.
8.Brooks, D. G., S. G. Kitchen, C. M. Kitchen, D. D. Scripture-Adams, and J. A. Zack.2001. Generation of HIV latency during thymopoiesis. Nat. Med.
7:459–464.
9.Bukrinsky, M. I., T. L. Stanwick, M. P. Dempsey, and M. Stevenson.1991. Quiescent T lymphocytes as an inducible virus reservoir in HIV-1 infection.
Science254:423–427.
10.Butera, S. T., V. L. Perez, B. Y. Wu, G. J. Nabel, and T. M. Folks.1991. Oscillation of the human immunodeficiency virus surface receptor is
regu-lated by the state of viral activation in a CD4⫹cell model of chronic
infec-tion. J. Virol.65:4645–4653.
11.Butera, S. T., B. D. Roberts, L. Lam, T. Hodge, and T. M. Folks.1994. Human immunodeficiency virus type 1 RNA expression by four chronically
infected cell lines indicates multiple mechanisms of latency. J. Virol.68:
2726–2730.
12.Caputo, A., M. P. Grossi, R. Bozzini, C. Rossi, M. Betti, P. C. Marconi, G. Barbanti-Brodano, and P. G. Balboni.1996. Inhibition of HIV-1 replication and reactivation from latency by tat transdominant negative mutants in the
cysteine rich region. Gene Ther.3:235–245.
13.Chen, B. K., R. T. Gandhi, and D. Baltimore.1996. CD4 down-modulation during infection of human T cells with human immunodeficiency virus type
1 involves independent activities ofvpu,env, andnef. J. Virol.70:6044–6053.
14.Chun, T. W., L. Carruth, D. Finzi, X. Shen, J. A. DiGiuseppe, H. Taylor, M. Hermankova, K. Chadwick, J. Margolick, T. C. Quinn, Y. H. Kuo, R. Brook-meyer, M. A. Zeiger, P. Barditch-Crovo, and R. F. Siliciano.1997. Quanti-fication of latent tissue reservoirs and total body viral load in HIV-1
infec-tion. Nature387:183–188.
15.Chun, T. W., R. T. Davey, Jr., M. Ostrowski, J. Shawn Justement, D. Engel, J. I. Mullins, and A. S. Fauci.2000. Relationship between pre-existing viral reservoirs and the re-emergence of plasma viremia after discontinuation of
highly active anti-retroviral therapy. Nat. Med.6:757–761.
16.Chun, T. W., D. Engel, M. M. Berrey, T. Shea, L. Corey, and A. S. Fauci.
1998. Early establishment of a pool of latently infected, resting CD4(⫹) T
cells during primary HIV-1 infection. Proc. Natl. Acad. Sci. USA95:8869–
8873.
17.Chun, T. W., D. Engel, S. B. Mizell, C. W. Hallahan, M. Fischette, S. Park, R. T. Davey, Jr., M. Dybul, J. A. Kovacs, J. A. Metcalf, J. M. Mican, M. M. Berrey, L. Corey, H. C. Lane, and A. S. Fauci.1999. Effect of interleukin-2
on the pool of latently infected, resting CD4⫹T cells in HIV-1-infected
patients receiving highly active anti-retroviral therapy. Nat. Med.5:651–655.
18.Chun, T. W., D. Finzi, J. Margolick, K. Chadwick, D. Schwartz, and R. F. Siliciano.1995.In vivofate of HIV-1-infected T cells: quantitative analysis of
the transition to stable latency. Nat. Med.1:1284–1290.
19.Chun, T. W., L. Stuyver, S. B. Mizell, L. A. Ehler, J. A. Mican, M. Baseler, A. L. Lloyd, M. A. Nowak, and A. S. Fauci.1997. Presence of an inducible HIV-1 latent reservoir during highly active antiretroviral therapy. Proc. Natl.
Acad. Sci. USA94:13193–13197.
20.Collman, R., J. W. Balliet, S. A. Gregory, H. Friedman, D. L. Kolson, N. Nathanson, and A. Srinivasan.1992. An infectious molecular clone of an unusual macrophage-tropic and highly cytopathic strain of human
immuno-deficiency virus type 1. J. Virol.66:7517–7521.
21.Deng, L., C. de la Fuente, P. Fu, L. Wang, R. Donnelly, J. D. Wade, P. Lambert, H. Li, C. G. Lee, and F. Kashanchi.2000. Acetylation of HIV-1 Tat by CBP/P300 increases transcription of integrated HIV-1 genome and
en-hances binding to core histones. Virology277:278–295.
22.Duh, E. J., W. J. Maury, T. M. Folks, A. S. Fauci, and A. B. Rabson.1989. Tumor necrosis factor alpha activates human immunodeficiency virus type 1
through induction of nuclear factor binding to the NF-B sites in the long
terminal repeat. Proc. Natl. Acad. Sci. USA86:5974–5978.
23.Emerman, M., and M. H. Malim.1998. HIV-1 regulatory/accessory genes:
keys to unraveling viral and host cell biology. Science280:1880–1884.
24.Emiliani, S., W. Fischle, M. Ott, C. Van Lint, C. A. Amella, and E. Verdin.
1998. Mutations in thetatgene are responsible for human immunodeficiency
virus type 1 postintegration latency in the U1 cell line. J. Virol.72:1666–1670.
25.Emiliani, S., C. Van Lint, W. Fischle, P. Paras, Jr., M. Ott, J. Brady, and E. Verdin.1996. A point mutation in the HIV-1 Tat responsive element is
associated with postintegration latency. Proc. Natl. Acad. Sci. USA93:6377–
6381.
26.Finzi, D., J. Blankson, J. D. Siliciano, J. B. Margolick, K. Chadwick, T. Pierson, K. Smith, J. Lisziewicz, F. Lori, C. Flexner, T. C. Quinn, R. E. Chaisson, E. Rosenberg, B. Walker, S. Gange, J. Gallant, and R. F. Siliciano.
1999. Latent infection of CD4⫹T cells provides a mechanism for lifelong
persistence of HIV-1, even in patients on effective combination therapy. Nat.
Med.5:512–517.
27.Finzi, D., M. Hermankova, T. Pierson, L. M. Carruth, C. Buck, R. E. Chaisson, T. C. Quinn, K. Chadwick, J. Margolick, R. Brookmeyer, J. Gal-lant, M. Markowitz, D. D. Ho, D. D. Richman, and R. F. Siliciano.1997. Identification of a reservoir for HIV-1 in patients on highly active
antiret-roviral therapy. Science278:1295–1300.
28.Folks, T. M., J. Justement, A. Kinter, C. A. Dinarello, and A. S. Fauci.1987. Cytokine-induced expression of HIV-1 in a chronically infected
promono-cyte cell line. Science238:800–802.
29.Folks, T. M., J. Justement, A. Kinter, S. Schnittman, J. Orenstein, G. Poli, and A. S. Fauci.1988. Characterization of a promonocyte clone chronically infected with HIV and inducible by 13-phorbol-12-myristate acetate. J.
Im-munol.140:1117–1122.
30.Fujinaga, K., Q. Zhong, T. Nakaya, M. Kameoka, T. Meguro, K. Yamada, and K. Ikuta.1995. Extracellular Nef protein regulates productive HIV-1
infection from latency. J. Immunol.155:5289–5298.
31.Gollapudi, S., C. H. Kim, B. Roshanravan, and S. Gupta.1998. Ciprofloxacin inhibits activation of latent human immunodeficiency virus type 1 in
chron-ically infected promonocytic U1 cells. AIDS Res. Hum. Retroviruses14:499–
504.
32.Griffin, G. E., K. Leung, T. M. Folks, S. Kunkel, and G. J. Nabel.1989. Activation of HIV gene expression during monocyte differentiation by
in-duction of NF-B. Nature339:70–73.
33.Kato, H., M. Horikoshi, and R. G. Roeder.1991. Repression of HIV-1
transcription by a cellular protein. Science251:1476–1479.
34.Kim, C. H., S. Gollapudi, A. Kim, T. Lee, and S. Gupta.1996. Role of protein kinase C-beta isozyme in activation of latent human immunodeficiency virus type 1 in promonocytic U1 cells by phorbol-12-myristate acetate. AIDS Res.
Hum. Retroviruses12:1361–1366.
35.Kumar, S., M. J. Orsini, J. C. Lee, P. C. McDonnell, C. Debouck, and P. R. Young.1996. Activation of the HIV-1 long terminal repeat by cytokines and environmental stress requires an active CSBP/p38 MAP kinase. J. Biol.
Chem.271:30864–30869.
36.Laughlin, M. A., S. Zeichner, D. Kolson, J. C. Alwine, T. Seshamma, R. J. Pomerantz, and F. Gonzalez-Scarano.1993. Sodium butyrate treatment of cells latently infected with HIV-1 results in the expression of unspliced viral
RNA. Virology196:496–505.
37.Lebargy, F., A. Branellec, L. Deforges, J. Bignon, and J. F. Bernaudin.1994.
HIV-1 in human alveolar macrophages from infected patients is latentin vivo
but replicates afterin vitrostimulation. Am. J. Respir. Cell Mol. Biol.10:
72–78.
38.Levy, D. N., Y. Refaeli, R. R. MacGregor, and D. B. Weiner.1994. Serum Vpr regulates productive infection and latency of human immunodeficiency virus
type 1. Proc. Natl. Acad. Sci. USA91:10873–10877.
39.Levy, D. N., Y. Refaeli, and D. B. Weiner.1995. Extracellular Vpr protein increases cellular permissiveness to human immunodeficiency virus
replica-tion and reactivates virus from latency. J. Virol.69:1243–1252.
40.Marzio, G., M. Tyagi, M. I. Gutierrez, and M. Giacca.1998. HIV-1 tat transactivator recruits p300 and CREB-binding protein histone
acetyltrans-ferases to the viral promoter. Proc. Natl. Acad. Sci. USA95:13519–13524.
41.Mikovits, J. A., N. C. Lohrey, R. Schulof, J. Courtless, and F. W. Ruscetti.
1992. Activation of infectious virus from latent human immunodeficiency
virus infection of monocytes in vivo. J. Clin. Investig.90:1486–1491.
42.Muto, N. F., C. Martinand-Mari, M. E. Adelson, and R. J. Suhadolnik.1999. Inhibition of replication of reactivated human immunodeficiency virus type 1 (HIV-1) in latently infected U1 cells transduced with an HIV-1 long
terminal repeat-driven PKR cDNA construct. J. Virol.73:9021–9028.
43.Oakes, J. W., O. Bagasra, L. Duan, and R. J. Pomerantz.1994. Association
of alterations in NF-B moieties with HIV type 1 proviral latency in certain
monocytic cells. AIDS Res. Hum. Retroviruses10:1213–1219.
44.Perez, V. L., T. Rowe, J. S. Justement, S. T. Butera, C. H. June, and T. M. Folks.1991. An HIV-1-infected T cell clone defective in IL-2 production and
Ca2⫹mobilization after CD3 stimulation. J. Immunol.147:3145–3148.
45.Pierson, T., T. L. Hoffman, J. Blankson, D. Finzi, K. Chadwick, J. B. Mar-golick, C. Buck, J. D. Siliciano, R. W. Doms, and R. F. Siliciano.2000.
on November 8, 2019 by guest
http://jvi.asm.org/
Characterization of chemokine receptor utilization of viruses in the latent
reservoir for human immunodeficiency virus type 1. J. Virol.74:7824–7833.
46.Pierson, T., J. McArthur, and R. F. Siliciano.2000. Reservoirs for HIV-1: mechanisms for viral persistence in the presence of antiviral immune
re-sponses and antiretroviral therapy. Annu. Rev. Immunol.18:665–708.
47.Pomerantz, R. J., T. Seshamma, and D. Trono.1992. Efficient replication of human immunodeficiency virus type 1 requires a threshold level of Rev:
potential implications for latency. J. Virol.66:1809–1813.
48.Pomerantz, R. J., D. Trono, M. B. Feinberg, and D. Baltimore.1990. Cells nonproductively infected with HIV-1 exhibit an aberrant pattern of viral
RNA expression: a molecular model for latency. Cell61:1271–1276.
49.Rabbi, M. F., L. al-Harthi, M. Saifuddin, and K. A. Roebuck.1998. The cAMP-dependent protein kinase A and protein kinase C-beta pathways synergistically interact to activate HIV-1 transcription in latently infected
cells of monocyte/macrophage lineage. Virology245:257–269.
50.Schulze-Forster, K., F. Gotz, H. Wagner, H. Kroger, and D. Simon.1990. Transcription of HIV1 is inhibited by DNA methylation. Biochem. Biophys.
Res. Commun.168:141–147.
51.Sheridan, P. L., T. P. Mayall, E. Verdin, and K. A. Jones.1997. Histone acetyltransferases regulate HIV-1 enhancer activity in vitro. Genes Dev.
11:3327–3340.
52.Sonza, S., H. P. Mutimer, R. Oelrichs, D. Jardine, K. Harvey, A. Dunne, D. F. Purcell, C. Birch, and S. M. Crowe.2001. Monocytes harbour replica-tion-competent, non-latent HIV-1 in patients on highly active antiretroviral
therapy. AIDS15:17–22.
53.Van Lint, C., S. Emiliani, M. Ott, and E. Verdin.1996. Transcriptional activation and chromatin remodeling of the HIV-1 promoter in response to
histone acetylation. EMBO J.15:1112–1120.
54.Winslow, B. J., R. J. Pomerantz, O. Bagasra, and D. Trono.1993. HIV-1
latency due to the site of proviral integration. Virology196:849–854.
55.Yang, J. Y., A. Schwartz, and E. E. Henderson.1993. Inhibition of HIV-1 latency reactivation by dehydroepiandrosterone (DHEA) and an analog of
DHEA. AIDS Res. Hum. Retroviruses9:747–754.
56.Yang, X., Y. Chen, and D. Gabuzda.1999. ERK MAP kinase links cytokine signals to activation of latent HIV-1 infection by stimulating a cooperative
interaction of AP-1 and NF-B. J. Biol. Chem.274:27981–27988.