JOURNAL OFVIROLOGY, Apr. 2004, p. 3722–3732 Vol. 78, No. 7
0022-538X/04/$08.00⫹0 DOI: 10.1128/JVI.78.7.3722–3732.2004
Copyright © 2004, American Society for Microbiology. All Rights Reserved.
Positive Selection Detection in 40,000 Human Immunodeficiency Virus
(HIV) Type 1 Sequences Automatically Identifies Drug Resistance
and Positive Fitness Mutations in HIV Protease and
Reverse Transcriptase
Lamei Chen,
1Alla Perlina,
2and Christopher J. Lee
1*
Molecular Biology Institute, Center for Genomics and Proteomics, Dept. of Chemistry & Biochemistry, University of California, Los Angeles, Los Angeles, California 90095-1570,1and
Specialty Laboratories Inc., Santa Monica, California 904042
Received 30 June 2003/Accepted 4 December 2003
Drug resistance is a major problem in the treatment of AIDS, due to the very high mutation rate of human immunodeficiency virus (HIV) and subsequent rapid development of resistance to new drugs. Identification of mutations associated with drug resistance is critical for both individualized treatment selection and new drug design. We have performed an automated mutation analysis of HIV Type 1 (HIV-1) protease and reverse transcriptase (RT) from approximately 40,000 AIDS patient plasma samples sequenced by Specialty Labora-tories Inc. from 1999 to mid-2002. This data set provides a nearly complete mutagenesis of HIV protease and enables the calculation of statistically significant Ka/Ksvalues for each individual amino acid mutation in
protease and RT. Positive selection (i.e., aKa/Ksratio of >1, indicating increased reproductive fitness) detected
19 of 23 known drug-resistant mutation positions in protease and 20 of 34 such positions in RT. We also discovered 163 new amino acid mutations in HIV protease and RT that are strong candidates for drug resistance or fitness. Our results match available independent data on protease mutations associated with specific drug treatments and mutations with positive reproductive fitness, with high statistical significance (the
P values for the observed matches to occur by random chance are 10ⴚ5.2 and 10ⴚ16.6, respectively). Our
mutation analysis provides a valuable resource for AIDS research and will be available to academic research-ers upon publication at http://www.bioinformatics.ucla.edu/HIV. Our data indicate that positive selection mapping is an analysis that can yield powerful insights from high-throughput sequencing of rapidly mutating pathogens.
The emergence of drug-resistant mutants of human immu-nodeficiency virus type 1 (HIV-1) protease and reverse tran-scriptase (RT) genes is an ongoing problem in the fight against AIDS. HIV’s mutation rate is high, approximately 4⫻ 10⫺5
mutations per base per replication cycle, or about one muta-tion every three generamuta-tions, yielding at least 1014mutations
per day worldwide, based on available replication rates and AIDS population estimates (2, 12, 15). This can lead to the rapid development of resistance to new drug treatments. Re-searchers and clinicians have made enormous efforts to iden-tify drug-resistant mutations in HIV protease and reverse tran-scriptase (RT), the molecular targets of the 18 antiretroviral drugs currently approved by the Food and Drug Administra-tion. The discovery of a new drug-resistant mutation typically requires a combination of clinical data (e.g., AIDS patients displaying drug resistance), sequencing, and basic science (e.g., obtaining viral samples and performing phenotypic assays). Fast, automatic methods for identifying drug-resistant muta-tions could be of great value for researchers studying HIV and other pathogens.
Fortunately, the rapid evolution of HIV itself may provide a powerful tool for gaining understanding of its function in gen-eral and drug resistance in particular. HIV’s high mutation rate is essentially performing a saturating mutagenesis experiment that in principle could reveal the detailed selection pressures for every possible mutation. The question is how to best read out this detailed information and make use of it.
In evolutionary biology, one important tool for characteriz-ing selection pressure is the ratio of observed amino acid tations over observed synonymous mutations (nucleotide mu-tations that do not change the amino acid translation), often referred to asKa/Ks(amino acid mutations over synonymous
mutations) or dn/ds (nonsynonymous mutations over synony-mous mutations). Since amino acid mutations, but not synon-ymous mutations, experience selection pressure due to their effect on protein function, their ratio gives a straightforward measure of this selection pressure. Throughout this paper we will use the termKa/Ks, which is normalized by the ratio
ex-pected under a random mutation model (i.e., in the absence of any selection pressure) (10). AKa/Ksvalue of 1 indicates
neu-tral selection, i.e., the observed ratio of mutations that cause amino acid changes versus those that do not exactly matches the ratio expected under a random mutation model. Thus, amino acid changes are neither being selected for nor against. AKa/Ksvalue of⬍1 indicates negative selection pressure. That
is, most amino acid changes are deleterious and are selected
* Corresponding author. Mailing address: Department of Chemistry and Biochemistry, Molecular Biology Institute, Center for Genomics and Proteomics, University of California, Los Angeles, Los Angeles CA 90095-1570. Phone: (310) 825-7374. Fax: (310) 267-0248. E-mail: [email protected].
3722
on November 8, 2019 by guest
http://jvi.asm.org/
against, producing an imbalance in the observed mutations that favors synonymous mutations. Much less common is pos-itive selection (Ka/Ks⬎1), indicating that amino acid changes
are favored, i.e., they increase the organism’s fitness. This unusual condition may reflect a change in the function of a gene or a change in environmental conditions that forces the organism to adapt. For example, HIV mutations which confer resistance to new antiviral drugs might be expected to undergo positive selection in a patient population treated with these drugs.
In this paper we present a large-scale study of the value of positive selection for detecting drug-resistant mutations in HIV protease and RT. Ordinarily, Ka/Ks is measured as a
single value for an entire gene (10). This can reveal very in-teresting positive selection events in the evolution of an organ-ism, but unfortunately the overall Ka/Ksvalues for HIV
pro-tease and RT provide no extraordinary result (they are negative [18], as in most genes). A more interesting question is whether positive selection can be observed at the level of individual mutations rather than by pooling all data for the entire gene. However, this would require very large amounts of mutation data to obtain a statistically significantKa/Ksresult
for each individual mutation.
To solve this problem, we have performed automated mu-tation analysis of approximately 40,000 HIV samples from AIDS patients sequenced by Specialty Laboratories from 1999 to mid-2002. This massive data set provides essentially com-plete mutagenesis in the regions sequenced (including pro-tease codons 1 to 99 and RT codons 1 to 381). More impor-tantly, it enables the calculation of accurate Ka/Ks values at
each codon, and even for each individual amino acid within that codon, with high statistical significance. Using these data, we have found that positive selection detects most of the known drug-resistant mutations and discovered many new mu-tations that are strong candidates for drug resistance or other
key functional changes in HIV. The positive selection map and complete mutation data for the 40,000 HIV samples can be of great value to the AIDS research community.
MATERIALS AND METHODS
Sequencing chromatogram preparation and analysis.All sequencing was per-formed at Specialty Laboratories Inc. by using an HIV-1 GenotypR assay (22), from which individual patient identification information was removed prior to use in this study. The sequenced region included codons 1 to 99 of the protease gene and codons 1 to 381 of the RT gene (Fig. 1). Nucleotide sequences (six per patient), obtained from Specialty Laboratories’ assay, were analyzed by using PHRED (3) to produce base calls and quality factors. In the cases of nucleotide mixtures, only the major (highest) peak was reported. The original clinical results of manual analysis were obtained at Specialty Laboratories by use of the Se-quence Navigator software.
Specialty Laboratories estimated that more than 99% of the samples that they sequenced are of subtype B. We compared all of the sequences in our data set against HIV-1 subtype reference sequences from the Los Alamos database by using the program BLAST and assigned each sample to the subtype with the highest identity. This analysis indicated that 99.28% of the samples are HIV-1 subtype B.
Single nucleotide polymorphism (snp) scoring and identification.To identify real mutations and distinguish them reliably from possible sequencing errors, all six chromatogram reads for each sample were aligned against the subtype B reference sequence (GenBank accession no. GI9629357) and analyzed by the programs POA and snp_assess as previously described (5–7, 9). For each candi-date mutation, snp_assess calculated the log odds ratio (LOD) of the probability that it is a true mutation versus the probability that it is a sequencing error. An
LOD value of⬎3 implies that the likelihood of a sequencing error is less than
10⫺3(Fig. 2).
[image:2.603.103.490.70.278.2]Manual verification of HIV mutations.To validate the high-throughput mu-tation detection results, we randomly selected 4,043 samples and compared our results at 144 nucleotide positions with mutations previously reported for these samples by Specialty Laboratories (using manual examination of the base calls and chromatograms for clinical reporting of known drug-resistant mutations). Of 24,831 mutations detected by our procedure, 17,256 were independently verified by Specialty Laboratories’ archived manual reports. Since the number of known clinically significant mutations and, hence, the number of positions manually scored by Specialty Laboratories varied during this period (from approximately 90 nucleotides in 1999 to all 144 in 2002), a 100% match was not expected. We randomly selected 40 of the 7,575 unverified mutations and manually examined
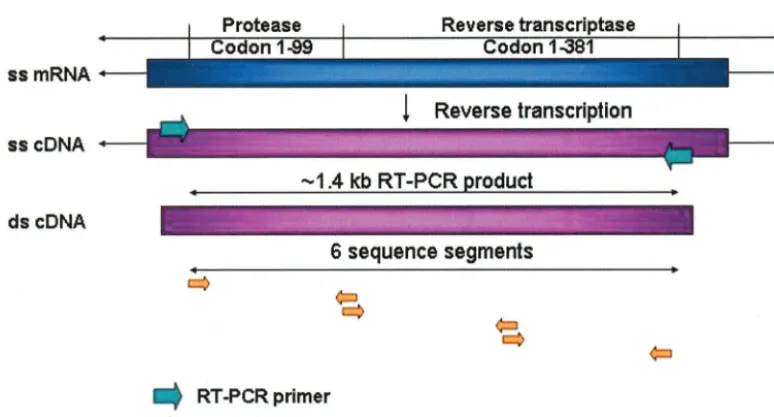
FIG. 1. RT-PCR and sequencing of the HIV-1 protease and RT regions. HIV-1 RNA was isolated from AIDS patient plasma samples. Reverse transcription was performed to obtain the cDNA from single-stranded viral RNA. The HIV protease and RT region around 1.4 kb was amplified by PCR using two (forward and backward) unique primers. This was followed by a nested PCR, which split the target sequence into three shorter fragments with the use of six unique primers. These fragments were then cycle sequenced in forward and reverse directions.
on November 8, 2019 by guest
http://jvi.asm.org/
the raw chromatogram data at Specialty Laboratories. All 40 were present and verified as real mutations, as judged by clear chromatogram peaks and agree-ment between sequencing of both strands. Thus, the false-positive rate in the mutation data reported in this paper is likely to be below 1%. Specialty Labo-ratories also reported 2,723 mutations at “mixture positions” (where the chro-matogram indicated that a mix of more than one nucleotide was present). Of these, 1,236 mutations were also reported by our automatic procedure. Assuming that all 1,487 of the remaining mixture mutations are correct, this indicates a
false-negative rate of under 6% [1,487/(24,831⫹1,487), where 24,831 is the
number of mutations detected by our procedure].
Calculation ofKa/Ksfor specific amino acid substitutions.Our calculation is
based on the definition ofKa/Ksdeveloped by Li (10). The main differences of
our approach are that (i) instead of calculatingKa/Ksfor an individual gene or
codon, we calculate an individual Ka/Ksvalue for each specific amino acid
mutation; (ii) we follow the definition ofKa/Ksas normalized by a random
mutation model (i.e., no selection pressure, described in detail below), unlike some treatments of dn/ds (25); (iii) HIV has a high transition/transversion ratio
(20), which must be taken into account for an accurateKa/Kscalculation. We first
measured the transition and transversion frequenciesftandfvfrom the entire
data set, according to the following formulas:ft⫽Nt/ntSandfv⫽Nv/nvS, where
Sis the total number of samples; NtandNvare the numbers of observed
transition and transversion mutations, respectively;ntis the number of possible
transitions in the region that was sequenced (simply equal to its lengthLin
nucleotides); andnvis the number of possible transversions (equal to 2L). For
this calculation, we used all of the nucleotides in the region that was sequenced. It is also possible to perform this calculation specifically on silent nucleotide positions (i.e., nucleotides where all possible mutations are synonymous); how-ever, we have followed the more conservative approach of using all nucleotides, in keeping with previously published work (20). In this calculation (and all others below) we counted only single nucleotide substitutions; all other mutations were excluded.
The definition ofKa/Kscan be extended to a specific amino acid substitution
(X3Y) at a codon by calculating the ratio ofNY, the count of X3Y mutations
observed at that codon, overNs, the count of synonymous mutations observed at
that codon. ThisNY/Nsratio is then normalized by the ratio expected under a
random mutation model (i.e., in the absence of any selection pressure), accord-ing to the followaccord-ing formula:
Ka
Ks⫽
Ny
Ns
nY,tft⫹nY,vfv
ns,tft⫹ns,vfv
wherenY,tis the number of possible transition mutations in the codon that would
change X to Y,ns,tis the number of possible transition mutations in the codon
that are synonymous, andnY,vandns,vare the equivalent numbers for
transver-sions. When the observed ratio (NY/NS) is greater than the expected ratio (in the
denominator of the expression above), the selection pressureKa/Ksis greater
than 1 and we say that the mutation X3Y exhibits positive selection pressure.
We calculated an LOD confidence score for a mutation X3Y to be under
positive selection pressure according to the following formula:
LOD⫽ ⫺log10p
冉
iⱖNY冏
N,q,Ka
Ks⫽1
冊
⫽ ⫺log10冘
i⫽NYN
冉
Ni
冊
qi共1⫺q兲N⫺iwhere Nis the total number of mutations observed in the codon, andqis
calculated as follows:
q⫽nY,t3fft⫹nY,vfv
t⫹6fv
.
Drug resistance predictionPvalues.Givennmutations with positive selection
of a total ofNmutations, we calculated the log probability of predicting at least
[image:3.603.124.458.65.367.2]mdrug-resistant mutations by random chance (of the total number,M, of known
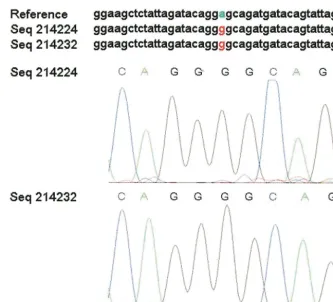
FIG. 2. Chromatogram evidence for an HIV-1 protease mutation. The program snp_assess identified an A3G mutation with an LOD score of 11.6 (top). Chromatograms for the forward (Seq214224) and reverse (Seq214232) strand sequencing are shown in the lower panels. Seq214232 is shown in reverse complement for the purposes of comparison.
3724 CHEN ET AL. J. VIROL.
on November 8, 2019 by guest
http://jvi.asm.org/
drug-resistant mutations), according to the following hypergeometric distribu-tion:
p共iⱖm兩N,M,n,random兲⫽
冘
i⫽m n
冉
Mi
冊冉
Nn⫺⫺Mi冊
冉
N n冊
For example, of the 527 (N) amino acid changes in protease, we identified 69 (n)
that displayed positive selection (Ka/Ks⬎1) with LOD scores of 2 or greater
(Table 1). Of a total of 52 (M) known drug-resistant mutations in protease, 25
(m) of these were identified among our 69 positively selected mutations. Thus,
thePvalue for obtaining this result by random chance calculated from the above
expression is 10⫺10.4.
We used the following known drug-resistant mutation positions: in protease, positions 8, 10, 20, 24, 30, 32, 33, 36, 46, 47, 48, 50, 53, 54, 63, 71, 73, 77, 82, 84, 88, 90, and 93 (8, 19, 23, 26); in RT, positions 41, 44, 62, 65, 67, 69, 70, 74, 75, 77, 98, 100, 101, 103, 106, 108, 115, 116, 118, 151, 179, 181, 184, 188, 190, 210, 215, 219, 225, 227, 230, 234, 236, and 333 (17, 19).
RESULTS
Automated HIV mutation detection. Raw chromatogram data from sequencing of 39,767 AIDS patient plasma samples were provided by Specialty Laboratories, obtained from HIV-1 GenotypR assays performed at Specialty Laboratories. Each base was sequenced at least twice (on complementary strands), and putative mutations were scored by using the program snp_assess (7), which takes into account local chromatogram quality, sequence context, the agreement between all the reads, and detailed sequencing error statistics as previously measured from 400⫻106bp of chromatogram reads. Our data are from
samples that are almost exclusively HIV-1 subtype B (see Ma-terials and Methods).
We identified 1,923,620 candidate mutations in these sam-ples, of which 1,830,097 had high LOD scores (LOD ⬎ 3; throughout this paper we will focus on mutations with LOD scores of ⬎3). Manual verification indicates that the false-positive rate in the mutation data presented in this paper is less than 1% (see Materials and Methods). This sequencing covers the whole protease gene (297 bp) and the first 1,143 bp of the RT gene. The average number of mutations (compared to the subtype B reference) was 31.96 per kb overall, 29.57/kb in HIV protease, and 32.58/kb for RT. Approximately 349,000 muta-tions were detected in protease, and 1.48 million were detected in RT. This represented 1,148 distinct codon mutations in protease and 3,873 in RT. On average, each distinct mutation was observed in 364 independent samples, corresponding to an allele frequency of 0.92%. The overall ratio of transition to transversion was 8.75, indicating that the HIV-1 pol enzyme has a very strong bias towards transition substitutions. This result is consistent with a previous report (20).
We identified 232,299 amino acid mutations in protease and 586,192 mutations in RT. These subdivided into 528 distinct amino acid changes at 91 codon positions for protease and 1,964 distinct amino acid changes at 361 codon positions for RT. Thus, the average population frequency of each amino acid change was 1.1% in protease and 0.75% in RT. We de-tected 5.33 distinct amino acid changes per codon in protease and 5.15 per codon in RT.
Positive selection mapping of individual amino acid muta-tions. To relate these polymorphism data to their potential impact on protein function, we mapped all mutations onto the HIV-1 subtype B protein sequences for the protease (amino
acids 1 to 99) and RT (amino acids 1 to 381) proteins. Overall, the Ka/Ks value for this region is 0.2687, indicating that it is
under negative selection. This is consistent with previous re-ported results (18).
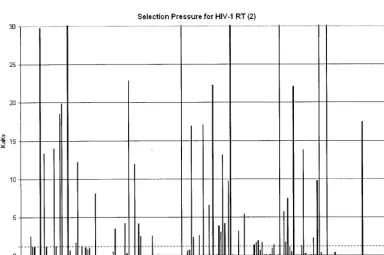
To seek drug-resistant mutations, we mapped positive selec-tion pressure throughout the sequenced region by calculating a
Ka/Ksvalue for each amino acid mutation. These results show
dramatic differences inKa/Ksat different positions in the
pro-teins and strongly positive selection pressure at individual amino acids (Fig. 3 and 4). In marked contrast to the overall pattern of negative selection pressure in this region, we ob-servedKa/Ksvalues of⬎1 (i.e., positive selection) for 69
indi-vidual mutations in protease and 142 mutations in RT and
Ka/Ksvalues of⬎10 for 20 mutations in protease and 47
mu-tations in RT. To assess the statistical significance of these results, we also calculated aPvalue for each mutation, giving the probability of the observed results under the assumption of neutral selection pressure (i.e.,Ka/Ks⫽1; see Materials and
Methods for details of thePvalue calculation). By using a 1% statistical significance threshold, our positive-selection results are statistically significant (P values of⬍10⫺10in most cases
[Tables 1 and 2]).
These positive selection results were also highly specific. We observed very differentKa/Ksvalues for different mutations at
a given individual position (Tables 1 and 2). For example, at Ile 93 in protease, the mutation I93L had aKa/Ksvalue of 447.66
(P⬍10⫺300), but other mutations at this position did not show
statistically significant positive selection pressure (Ka/Ksvalues
of 4.53, 0.05, 0.04, 0.01 for I93M, I93F, I93V, and I93T, re-spectively). Indeed, these results demonstrate the importance of detecting positive selection pressure at the level of individ-ual mutations rather than for an entire codon as has been previously described (4, 21, 25). We compared our results with
Ka/Ksvalues calculated for each individual codon (by pooling
the observation counts for all nonsynonymous mutations at that codon; see Materials and Methods for details). In some cases, a positive selection detected for an individual mutation could also be detected at the codon level (e.g., the T12S mu-tation had aKa/Ksvalue of 49, whereas a mutation of T12 to
any amino acid had a codonKa/Ksvalue of 6.9). However, in
many other cases the codonKa/Kscalculation failed to detect
strong positive selection that was easily detectable at the level of individual mutations (e.g., the G48V mutation had aKa/Ks
value of 5.1, but the mutation of G48 to any amino acid had a codon Ka/Ksvalue of 0.24). For protease, of 47 positions for
which we detected positive selection (Ka/Ksvalues of⬎1 for
individual mutations), 19 were not detected by the codon-based calculation (40%). This is perhaps not surprising. Dif-ferent amino acids at the same position are expected to expe-rience different selection pressures. Calculating an overall
Ka/Ksfor an entire codon can obscure positive selection of a
single amino acid at that codon. If other amino acid replace-ments at that position are negatively selected, the overallKa/Ks
for the codon might indicate negative selection.
Positive selection of drug-resistant mutations.Positive se-lection mapping identified the majority of drug-resistant mu-tation positions identified in the published literature for HIV protease (Fig. 5a). We identified 47 positions in protease that showed positive selection of individual mutations. Notably, 19 of these 47 positions are known to be associated with drug
on November 8, 2019 by guest
http://jvi.asm.org/
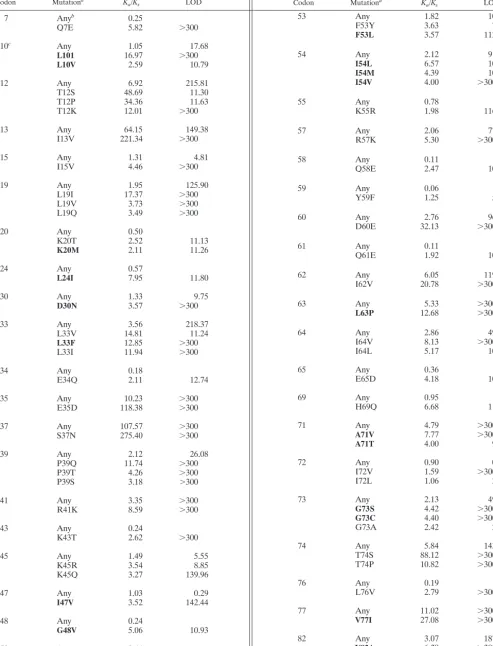
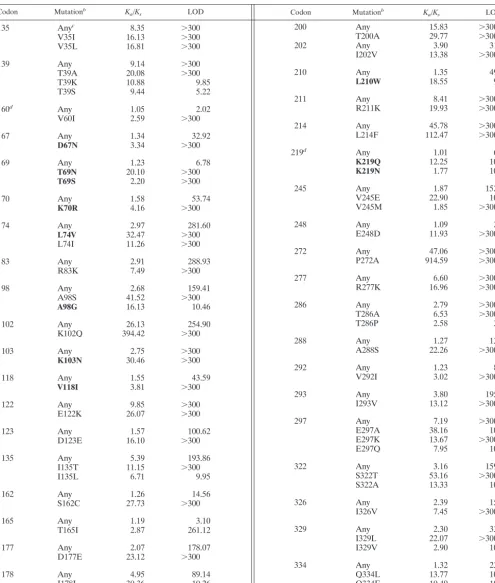
TABLE 1. Positive-selection pressure in protease
Codon Mutationa K
a/Ks LOD Codon Mutationa Ka/Ks LOD
7 Anyb 0.25
Q7E 5.82 ⬎300
10c Any 1.05 17.68
L101 16.97 ⬎300
L10V 2.59 10.79
12 Any 6.92 215.81
T12S 48.69 11.30
T12P 34.36 11.63
T12K 12.01 ⬎300
13 Any 64.15 149.38
I13V 221.34 ⬎300
15 Any 1.31 4.81
I15V 4.46 ⬎300
19 Any 1.95 125.90
L19I 17.37 ⬎300
L19V 3.73 ⬎300
L19Q 3.49 ⬎300
20 Any 0.50
K20T 2.52 11.13
K20M 2.11 11.26
24 Any 0.57
L24I 7.95 11.80
30 Any 1.33 9.75
D30N 3.57 ⬎300
33 Any 3.56 218.37
L33V 14.81 11.24
L33F 12.85 ⬎300
L33I 11.94 ⬎300
34 Any 0.18
E34Q 2.11 12.74
35 Any 10.23 ⬎300
E35D 118.38 ⬎300
37 Any 107.57 ⬎300
S37N 275.40 ⬎300
39 Any 2.12 26.08
P39Q 11.74 ⬎300
P39T 4.26 ⬎300
P39S 3.18 ⬎300
41 Any 3.35 ⬎300
R41K 8.59 ⬎300
43 Any 0.24
K43T 2.62 ⬎300
45 Any 1.49 5.55
K45R 3.54 8.85
K45Q 3.27 139.96
47 Any 1.03 0.29
I47V 3.52 142.44
48 Any 0.24
G48V 5.06 10.93
50 Any 0.44
I50V 1.12 ⬎300
53 Any 1.82 10.13
F53Y 3.63 7.02
F53L 3.57 112.78
54 Any 2.12 91.45
I54L 6.57 10.40
I54M 4.39 10.44
I54V 4.00 ⬎300
55 Any 0.78
K55R 1.98 116.02
57 Any 2.06 77.61
R57K 5.30 ⬎300
58 Any 0.11
Q58E 2.47 10.96
59 Any 0.06
Y59F 1.25 5.81
60 Any 2.76 96.01
D60E 32.13 ⬎300
61 Any 0.11
Q61E 1.92 10.77
62 Any 6.05 119.07
I62V 20.78 ⬎300
63 Any 5.33 ⬎300
L63P 12.68 ⬎300
64 Any 2.86 49.66
I64V 8.13 ⬎300
I64L 5.17 10.30
65 Any 0.36
E65D 4.18 10.81
69 Any 0.95
H69Q 6.68 11.06
71 Any 4.79 ⬎300
A71V 7.77 ⬎300 A71T 4.00 9.73
72 Any 0.90 0.01
I72V 1.59 ⬎300
I72L 1.06 2.59
73 Any 2.13 49.67
G73S 4.42 ⬎300 G73C 4.40 ⬎300
G73A 2.42 2.80
74 Any 5.84 143.17
T74S 88.12 ⬎300
T74P 10.82 ⬎300
76 Any 0.19
L76V 2.79 ⬎300
77 Any 11.02 ⬎300
V77I 27.08 ⬎300
82 Any 3.07 187.52
V82A 6.29 ⬎300 V82F 2.99 2.73
Continued on facing page
3726
on November 8, 2019 by guest
http://jvi.asm.org/
resistance. Thus, positive selection mapping identified most (83%) of the 23 known drug-resistant mutation positions in protease (Fig. 5a). This is a statistically significant match. The
Pvalue for obtaining this result by random chance is 10⫺3.3.
Moreover, the known drug-resistant mutations at these posi-tions matched the amino acid changes that we observed to be positively selected (Table 1). It should be noted that at two of the four known drug-resistant mutations that we missed (Met 36 and Met 46), no synonymous mutations are possible (all mutations change the amino acid), and therefore we could not even calculate aKa/Ksratio there.
Positive selection mapping yielded similar results in RT. One hundred ten positions stood out from the background of negative selection, with strongly positiveKa/Ksvalues and high
LOD scores. Twenty of these positions correspond to known drug-resistant mutations (there are 34 known drug resistance-associated positions in RT). The P value for obtaining this result by random chance is 10⫺3.9. The strongestK
a/Ksvalues
were at positions 272 (914.59), 102 (394.42), and 214 (112.47). These are novel results. The functional significance of positive selection at these positions is unknown, although two of the positions are immediately adjacent to known drug-resistant mutations (K101Q, K103N, and T215F).
The statistical significance of our results becomes even stronger when evaluated at the level of individual mutations. Of the 527 amino acid changes in protease, we identified 69 that displayed positive selection (Ka/Ks⬎1) with LOD scores
[image:6.603.45.542.75.203.2]greater than 2 (Table 1). Twenty-five of these corresponded to
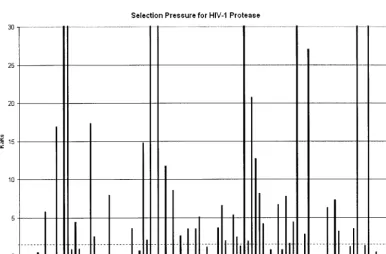
FIG. 3. Positive selection mapping of HIV-1 protease from 40,000 patient samples. TheKa/Ksvalue represents the greatest selection pressure
[image:6.603.102.488.447.700.2]among all the individual amino acid mutations at each codon. The dotted line indicates theKa/Ksvalue of 1.
TABLE 1—Continued
Codon Mutationa K
a/Ks LOD Codon Mutationa Ka/Ks LOD
84 Any 2.12 12.19
I84V 7.33 ⬎300
85 Any 1.26 2.41
I85V 3.22 149.56
88 Any 1.21 188.09
N88D 1.21 188.09
89 Any 3.53 10.79
L89M 3.53 10.79
aKnown drug-resistant mutations are highlighted in bold.
bAny, we calculated theK
a/Ksratio for the total set of amino acid mutations at this codon.
cCodon 10 has an LOD score of⬍2 when only single nucleotide substitutions are counted. But its LOD score is⬎2 when both single and multiple nucleotide
substitutions are counted.
L89V 1.89 10.91
90 Any 4.06 ⬎300
L90M 248.57 ⬎300
92 Any 0.08
K92K 1.31 10.66
93 Any 13.27 ⬎300
I93L 447.66 ⬎300
on November 8, 2019 by guest
http://jvi.asm.org/
TABLE 2. Positive-selection pressure in RTa
Codon Mutationb K
a/Ks LOD Codon Mutationb Ka/Ks LOD
35 Anyc 8.35 ⬎300
V35I 16.13 ⬎300
V35L 16.81 ⬎300
39 Any 9.14 ⬎300
T39A 20.08 ⬎300
T39K 10.88 9.85
T39S 9.44 5.22
60d Any 1.05 2.02
V60I 2.59 ⬎300
67 Any 1.34 32.92
D67N 3.34 ⬎300
69 Any 1.23 6.78
T69N 20.10 ⬎300
T69S 2.20 ⬎300
70 Any 1.58 53.74
K70R 4.16 ⬎300
74 Any 2.97 281.60
L74V 32.47 ⬎300
L74I 11.26 ⬎300
83 Any 2.91 288.93
R83K 7.49 ⬎300
98 Any 2.68 159.41
A98S 41.52 ⬎300
A98G 16.13 10.46
102 Any 26.13 254.90
K102Q 394.42 ⬎300
103 Any 2.75 ⬎300
K103N 30.46 ⬎300
118 Any 1.55 43.59
V118I 3.81 ⬎300
122 Any 9.85 ⬎300
E122K 26.07 ⬎300
123 Any 1.57 100.62
D123E 16.10 ⬎300
135 Any 5.39 193.86
I135T 11.15 ⬎300
I135L 6.71 9.95
162 Any 1.26 14.56
S162C 27.73 ⬎300
165 Any 1.19 3.10
T165I 2.87 261.12
177 Any 2.07 178.07
D177E 23.12 ⬎300
178 Any 4.95 89.14
I178L 30.36 10.26
I178M 9.60 ⬎300
aDue to the great number of amino acid mutations (142) under positive-selection pressure, only those (55) at codons with aK
a/Ksvalue of⬎1 for the total set of
mutations at that codon are listed here.
bKnown drug-resistant mutations are highlighted in bold.
cAny, we calculated theK
a/Ksratio for the total set of amino acid mutations at this codon.
dCodon has an LOD score of⬍2 when only single nucleotide substitutions are counted. But its LOD score is⬎2 when both single and multiple nucleotide
substitutions are counted.
200 Any 15.83 ⬎300
T200A 29.77 ⬎300
202 Any 3.90 31.08
I202V 13.38 ⬎300
210 Any 1.35 49.64
L210W 18.55 9.80
211 Any 8.41 ⬎300
R211K 19.93 ⬎300
214 Any 45.78 ⬎300
L214F 112.47 ⬎300
219d Any 1.01 6.62
K219Q 12.25 10.14 K219N 1.77 10.54
245 Any 1.87 152.83
V245E 22.90 10.50
V245M 1.85 ⬎300
248 Any 1.09 2.07
E248D 11.93 ⬎300
272 Any 47.06 ⬎300
P272A 914.59 ⬎300
277 Any 6.60 ⬎300
R277K 16.96 ⬎300
286 Any 2.79 ⬎300
T286A 6.53 ⬎300
T286P 2.58 3.48
288 Any 1.27 13.49
A288S 22.26 ⬎300
292 Any 1.23 8.57
V292I 3.02 ⬎300
293 Any 3.80 195.08
I293V 13.12 ⬎300
297 Any 7.19 ⬎300
E297A 38.16 10.09
E297K 13.67 ⬎300
E297Q 7.95 10.23
322 Any 3.16 159.17
S322T 53.16 ⬎300
S322A 13.33 10.45
326 Any 2.39 15.26
I326V 7.45 ⬎300
329 Any 2.30 33.45
I329L 22.07 ⬎300
I329V 2.90 10.34
334 Any 1.32 23.67
Q334L 13.77 10.46
Q334E 10.49 10.46
Q334H 2.43 10.51
3728 CHEN ET AL. J. VIROL.
on November 8, 2019 by guest
http://jvi.asm.org/
known drug-resistant mutations, of a total of 52 known to exist in protease. This is a statistically significant match: thePvalue for obtaining this result by random chance is 10⫺10.4. Of the
2,255 amino acid changes that we identified in RT, 142 dem-onstrated positive selection (LOD score ⬎ 2) (Table 2). Of these, 23 matched known drug-resistant mutations. The P
value for obtaining this result (of the 55 known drug-resistant mutations in RT, by random chance) is 10⫺13.9.
[image:8.603.101.486.361.616.2]Comparison with independent drug treatment studies for HIV protease.One basic weakness of our data set is the lack of drug treatment histories for the individual patients. Not only do we lack information about what specific treatment a patient
FIG. 4. Positive selection mapping of HIV-1 RT from 40,000 patient samples. TheKa/Ksvalue represents the greatest selection pressure among
all the individual amino acid mutations at each codon. The dotted line indicates theKa/Ksvalue of 1.
on November 8, 2019 by guest
http://jvi.asm.org/
received, but also many of the samples may come from patients who have not been treated with any HIV drugs. We therefore compared our results with a carefully controlled independent study that identified mutations associated with specific drug treatments (24). Rather than calculatingKa/Ks, this study kept
a detailed drug treatment history for each patient and mea-sured the change in the frequency of each mutation among patients treated with a given set of drugs from that of patients not treated with those drugs. By comparing 1,004 HIV isolates from untreated patients with 1,240 HIV isolates from patients treated with one or more protease inhibitors, Wu et al. iden-tified 45 positions in HIV protease where mutations were spe-cifically associated with drug treatment.
OurKa/Ksdata match the results of Wu et al. closely. Of the
47 positions in protease identified by our positive selection mapping, 34 matched those found by Wu et al. (Fig. 5a). This is a statistically significant result (P⬍10⫺5.2). It is striking that
Ka/Ksmapping of a random sample of HIV sequences, with no
drug treatment information whatsoever, finds the majority (76%) of drug-resistant mutations identified by a careful study of specific drug treatments (24).
[image:9.603.129.460.70.416.2]Comparison with independent assays of phenotypic fitness for HIV protease.Positive selection mapping should yield im-portant information not only about drug resistance but also about mutations that improve viral fitness in other ways. To test this hypothesis, we also compared our results to the ex-haustive site-directed mutagenesis results of Loeb et al., who constructed and assayed the biochemical activity of approxi-mately 50% of all point mutants of HIV-1 subtype B protease (11). These data demonstrate that our positive selection map-ping detects not only drug resistance but also key determinants of fitness (Fig. 5c). While the set of all mutations tested by Loeb et al. was strongly biased towards negative activity (no detectable protease activity), with a smaller number of positive (normal) activity and intermediate activity, the mutations de-tected by our positive selection metric were almost entirely of
FIG. 5. Positive selection identifies drug resistance and positive fitness mutations. (a) Identification of codons with positive selection, either from the set of all positions in HIV protease (All codons), positions reported in the literature as sites of drug-resistant mutations (Known drug resistance associated codons), or positions reported as sites of mutations specifically associated with adaptation to drug treatment (Treatment associated codons). (b) Identification of specific amino acid mutations with positive selection, either from the set of all HIV protease mutations found in our data set (All mutations), or mutations reported in the literature as causing drug resistance (Known drug resistance associated mutations). (c) Phenotypic fitness, as measured by a protease activity assay by Loeb et al., for a random sample of HIV protease mutants (All mutations tested), or the subset of those mutations found to have positive selection in our study (Positive selected mutations). active, protease mutants with normal or greater-than-wild-type proteolytic activity; intermediate, partial cleavage was observed in the assay; inactive, no proteolytic cleavage was observed.
3730 CHEN ET AL. J. VIROL.
on November 8, 2019 by guest
http://jvi.asm.org/
normal or increased activity. This is a significant result, with a
Pvalue of 10⫺16.6.
DISCUSSION
Large-scale clinical mutation database for HIV-1 protease and RT.We have produced a large-scale analysis of polymor-phisms in the HIV-1 protease and RT regions, based on se-quencing of clinical samples from the United States, represen-tative of HIV-1 subtype B. Our present data set includes 39,767 individual AIDS patient plasma samples and 1,830,097 de-tected HIV mutations. This database provides a much larger data set for understanding recent HIV evolution and func-tional pressure than has previously been available (for two recent examples, see references 16 and 24) and can be useful for many different applications. Our mutation analysis will be available upon publication to academic researchers at http: //www.bioinformatics.ucla.edu/HIV.
A major difficulty in anti-HIV drug development is the rapid selection of mutations in the viral genome that confer drug resistance by means of resultant changes within the protein target. Current clinical and academic research has been fo-cused on some known codon positions that are associated with drug resistance. It is very important to detect and understand the pattern of these mutations. Due to the polymorphic nature of the HIV virus genome and the complexity of the drug resistance mechanisms, other codon positions may also play a role in the development of drug resistance. Our calculation of selection pressure for all the codons on the HIV-1 protease and RT regions can help to identify important codon positions that might affect drug resistance. Despite the fact that the Specialty Laboratories data set included no drug treatment information for the patients, ourKa/Kscalculations successfully
identified 76% of mutations found to be associated with drug resistance through clinical studies.
Our approach differs from previous work in several ways. First, a number of studies have examined the problem of cal-culating selection pressure for individual sites in a protein (4, 14, 21, 25). However, our approach calculatesKa/Ksfor each
observed amino acid mutation, instead of combining all ob-served mutations for a site into a singleKa/Ksvalue. Our data
for protease indicate that pooling multiple mutations for a site can obscure a large fraction (40%) of the positively selected sites that can be detected at the level of individual amino acid mutations. Second, we have not made use of any drug treat-ment information; our method does not require it, and the Specialty Laboratories data set did not include it. By contrast, Wu et al. identified drug-resistant mutations without consid-eringKa/Ksby comparing the frequency of each mutation in
two groups: patients that received a specific drug treatment regime and a control population of untreated patients (24). Third, because our data reflect a single subtype (B), we have not considered phylogeny relationships or ancestral genotype in our analysis. For populations that contain important phylo-genetic structure, it would be better to measureKa/Ksin a way
that takes this structure into account, as has been previously described (4). Finally, the base-calling software that we used (PHRED) does not report minor peaks when two or more nucleotide bases are present as a mixture at a given position in
the chromatogram. Such minor peaks can be of great interest and deserve further analysis.
Impact of mutation on protein function.There are 23 known HIV-1 protease inhibitor (PI) drug-resistant mutations that have been mapped onto the terminal domain (positions 8, 88, 90, and 93), the core domain (positions 10, 20, 24, 30, 32, 63, 71, 73, 77, 82, and 84), and the flap domain (positions 33, 36, 46, 47, 48, 50, 53, and 54), respectively (8, 18, 21, 24). Nineteen of them were detected by positive selection mapping in our data. The high proportion of known drug-resistant positions detected by this approach (76 to 83%) suggests that it could provide a relatively useful and reliable new tool for detecting important new drug-resistant mutations.
Indeed, our positive selection analysis does detect 28 novel positions in protease that may be important functional deter-minants but the significance of which is currently unknown. Some of these positions (e.g., 35, 37, 62, 64, 72, 74, and 85) are adjacent to codon positions known to be associated with drug resistance (e.g., 36, 63, 71, 73, and 85). But most of the newly identified positions are not near the active site. Instead, they are primarily located in the core domain (e.g., positions 12, 13, 15, 19, 60, 62, and 64) and flap domain (e.g., positions 35, 37, 39, 41, 45, and 57). They may affect either enzyme catalysis or dimer stability or reshape the active site through long-range structural perturbations (19). It is possible that some of the positively selected mutations may act as accessory mutations that improve viral fitness rather than directly interfering with drug binding (1).
Our comparison with the protease activity data of Loeb et al. (11) demonstrated that our approach also provides a useful window on important fitness determinants in the evolving viral population. Given that Ka/Ks measures reproductive fitness
fairly directly, this is not unexpected. Most of the positively selected mutations observed were conservative amino acid changes (Table 1). Thus, while natural selection evidently fa-vors amino acid changes at these positions, such changes ap-pear to be constrained to preserve structure and function. New experiments will be required to assess whether any of these mutations acts as a primary cause of drug resistance or con-tributes to drug resistance via a secondary effect.
The situation for RT is even more complicated. Most of the known drug-resistant mutations are in the 5⬘polymerase cod-ing region, particularly in the “fcod-ingers” (codons 1 to 85 and 118 to 155) and “palm” (codons 86 to 117 and 156 to 237) subdo-mains (19). We have identified codon positions with positive selection pressure not only in the fingers and palm subdomains but also in the “thumb” subdomain (codons 238 to 318), which has seldom been mentioned in research on drug-resistant mu-tations before. In addition to affecting drug resistance and virus fitness, some of the newly identified positions might be epitopes for cell-mediated immunity (13). The importance of all these codon positions needs to be experimentally examined. The amino acid-specificKa/Ksdata show distinct patterns of
positive selection. For example, at protease codon 12 several amino acid changes were positively selected (T12K, T12P, and T12S), resulting in an overallKa/Ksvalue of 6.92 for the codon.
By contrast, at position 48 a single amino acid change (G48V) was positively selected, while the other possible amino acid changes were negatively selected, resulting in an overallKa/Ks
for the codon of 0.24 (negative selection). Such specificity may
on November 8, 2019 by guest
http://jvi.asm.org/
reveal important functional constraints in the evolution of the enzyme. G48V is strongly selected for (Ka/Ksvalue of 5.06) and
has been shown to cause drug resistance (19). It is striking that other amino acid replacements at this position are not also favored, implying a significant functional constraint.
ACKNOWLEDGMENTS
We thank A. Bakker, B. Boyadzhyan, I. Chen, M. Patnaik, C. Ramirez Kitchen, T. Schutzbank, R. Woodhall, and N. Wylie for valu-able discussion and comments on this work.
This work was supported by U.C. Life Science Informatics grant 01-10090 and by funding from Specialty Laboratories, Inc. to C. Lee and L. Chen. C. Lee was supported by NIH grant 1P20MH065166-01.
REFERENCES
1. Bally, F., R. Martinez, S. Peters, P. Sudre, and A. Telenti.2000. Polymor-phism of HIV type 1 gag p7/p1 and p1/p6 cleavage sites: clinical significance and implications for resistance to protease inhibitors. AIDS Res. Hum.
Retrovir.16:1209–1213.
2. Coffin, J. M.1995. HIV population dynamics in vivo: implications for genetic
variation, pathogenesis, and therapy. Science267:483–489.
3. Ewing, B., L. Hillier, M. C. Wendl, and P. Green.1998. Base-calling of automated sequencer traces using phred. I. Accuracy assessment. Genome
Res.8:175–185.
4. Fitch, W. M., R. M. Bush, C. A. Bender, and N. J. Cox.1997. Long term trends in the evolution of H(3) HA1 human influenza type A. Proc. Natl.
Acad. Sci. USA94:7712–7718.
5. Hu, G., B. Modrek, H. M. F. R. Stensland, J. Saarela, P. Pajukanta, V. Kustanovich, L. Peltonen, S. F. Nelson, and C. Lee.2002. Efficient discovery of single-nucleotide polymorphisms in coding regions of human genes.
Phar-macogenomics J.2:236–242.
6. Irizarry, K., G. Hu, M. L. Wong, J. Licinio, and C. Lee.2001. Single nucle-otide polymorphism identification in candidate gene systems of obesity.
Pharmacogenomics J.1:193–203.
7. Irizarry, K., V. Kustanovich, C. Li, N. Brown, S. Nelson, W. Wong, and C.
Lee.2000. Genome-wide analysis of single-nucleotide polymorphisms in
human expressed sequences. Nat. Genet.26:233–236.
8. Kempf, D. J., J. D. Isaacson, M. S. King, S. C. Brun, Y. Xu, K. Real, B. M. Bernstein, A. J. Japour, E. Sun, and R. A. Rode.2001. Identification of genotypic changes in human immunodeficiency virus protease that correlate with reduced susceptibility to the protease inhibitor lopinavir among viral
isolates from protease inhibitor-experienced patients. J. Virol.75:7462–7469.
9. Lee, C., C. Grasso, and M. Sharlow.2002. Multiple sequence alignment
using partial order graphs. Bioinformatics18:452–464.
10. Li, W. H.1993. Unbiased estimation of the rates of synonymous and
non-synonymous substitution. J. Mol. Evol.36:96–99.
11. Loeb, D. D., R. Swanstrom, L. Everitt, M. Manchester, S. E. Stamper, and
C. A. I. Hutchinson.1989. Complete mutagenesis of the HIV-1 protease.
Nature340:397–400.
12. Mansky, L. M., and H. M. Temin.1995. Lower in vivo mutation rate of
human immunodeficiency virus type 1 than that predicted from the fidelity of
purified reverse transcriptase. J. Virol.69:5087–5094.
13. Moore, C. B., M. John, I. R. James, F. T. Christiansen, C. S. Witt, and S. A.
Mallal.2002. Evidence of HIV-1 adaptation to HLA-restricted immune
responses at a population level. Science296:1439–1443.
14. Nielsen, R., and Z. Yang.1998. Likelihood models for detecting positively selected amino acid sites and applications to the HIV-1 envelope gene.
Genetics148:929–936.
15. Perelson, A. S., A. U. Neumann, M. Markowitz, J. M. Leonard, and D. D. Ho.
1996. HIV-1 dynamics in vivo: virion clearance rate, infected cell life-span,
and viral generation time. Science271:1582–1586.
16. Rhee, S. Y., M. J. Gonzales, R. Kantor, B. J. Betts, J. Ravela, and R. W. Shafer.2003. Human immunodeficiency virus reverse transcriptase and
pro-tease sequence database. Nucleic Acids Res.31:298–303.
17. Schinazi, R. F., B. A. Larder, and J. W. Mellors.1997. Mutations in retroviral
genes associated with drug resistance. Int. Antivir. News5:129–142.
18. Seibert, S. A., C. Y. Howell, M. K. Hughes, and A. L. Hughes.1995. Natural selection on the gag, pol, and env genes of human immunodeficiency virus 1
(HIV-1). Mol. Biol. Evol.12:803–813.
19. Shafer, R. W., K. Dupnik, M. A. Winters, and S. H. Eshleman.2001. A guide to HIV-1 reverse transcriptase and protease sequencing for drug resistance
studies.InC. Kuiken, F. McCutchan, B. Foley, J. W. Mellors, B. Hahn, J.
Mullins, P. Marx, and S. Wolinsky (ed.), HIV sequence compendium. The-oretical Biology and Biophysics Group, Los Alamos National Laboratory, Los Alamos, N.M.
20. Sharp, P. M., E. Bailes, F. Gao, B. E. Beer, V. M. Hirsch, and B. H. Hahn.
2000. Origins and evolution of AIDS viruses: estimating the time-scale.
Biochem. Soc. Trans.28:275–282.
21. Suzuki, Y., and T. Gojobori.1999. A method for detecting positive selection
at single amino acid sites. Mol. Biol. Evol.16:1315–1328.
22. Wilson, J. W., P. Bean, T. Robins, F. Graziano, and D. H. Persing.2000. Comparative evaluation of three human immunodeficiency virus genotyping systems: the HIV-GenotypR method, the HIV PRT GeneChip assay, and
the HIV-1 RT line probe assay. J. Clin. Microbiol.38:3022–3028.
23. Winters, M. A., and T. C. Merigan.2001. Variants other than aspartic acid at codon 69 of the human immunodeficiency virus type 1 reverse transcrip-tase gene affect susceptibility to nucleoside analogs. Antimicrob. Agents
Chemother.45:2276–2279.
24. Wu, T. D., C. A. Schiffer, M. J. Gonzales, J. Taylor, R. Kantor, S. Chou, D. Israelski, A. R. Zolopa, W. J. Fessel, and R. W. Shafer.2003. Mutation patterns and structural correlates in human immunodeficiency virus type 1
protease following different protease inhibitor treatments. J. Virol.77:4836–
4847.
25. Yang, Z., R. Nielsen, N. Goldman, and A. M. Pedersen.2000. Codon-sub-stitution models for heterogeneous selection pressure at amino acid sites.
Genetics155:431–449.
26. Yusa, K., M. F. Kavlick, P. Kosalaraksa, and H. Mitsuya.1997. HIV-1
acquires resistance to two classes of antiviral drugs through homologous
recombination. Antivir. Res.36:179–189.
3732 CHEN ET AL. J. VIROL.