www.parliament.uk/commons-library | intranet.parliament.uk/commons-library | [email protected] | @commonslibrary
BRIEFING PAPER
Number 616, 5 September 2016
Oxbridge 'elitism'
By
Paul Bolton
Contents: 1. Summary 2. Type of school 3. Gender 4. Ethnicity
Contents
1. Summary 2
2. Type of school 3
2.1 Historical information 5
2.2 Schools with the highest entry rates to Oxbridge 7
3. Gender 9
4. Ethnicity 9
5. Under-represented groups 10
1.
Summary
Interest in the background of students who go to Oxford and Cambridge is very longstanding. The 1852 Royal Commissions on both universities identified access by poorer students as an important and longstanding issue. The debate about elitism at Oxford and Cambridge has tended to focus on a single indicator –the proportion of students accepted from state schools- and particularly whether it has gone up or down in the latest year. This gives a limited view only. A fuller picture needs more context,
including longer term trends in this indicator, rates of entry for other under-represented groups, data on other prestige universities and a better understanding of the types of state schools that send pupils to Oxbridge.
Both universities now take more than half of their entrants from state schools, if overseas entrants are excluded. These rates are generally increasing, but the historical data shows that progress has been slow.
Readers may also find the standard note Higher education and social class interesting. The latest statistics on entry can be viewed at:
http://www.ox.ac.uk/about/facts-and-figures/admissions-statistics http://www.undergraduate.study.cam.ac.uk/apply/statistics
Early data from Freedom of Information requests on applications and entrance by local authority can be found here.
HESA performance indicators can be downloaded at: www.hesa.ac.uk/pi
2.
Type of school
The table at the end of this note shows consistent information on undergraduate intake by school and college type since 1989. The proportion of entrants from the state sector is illustrated opposite. This includes earlier data with a break in series.1The rate looks at entrants from the UK state sector as a proportion of total entrants from this sector and UK independent schools. It therefore excludes entrants from overseas schools, but will include some overseas nationals at UK schools and colleges, particularly at independent schools.
In the first half of the period there was a clear increase in the proportion of state school pupils entering Oxford. This increased from 43% in the early 1970s to 52% in 1981. The level at Cambridge was more erratic, varying between 45% and 50% for most of this period. The rate at both institutions fell noticeably in the mid-1980s. New definitions were brought in from 1986/87 and trends since then have been more stable. Cambridge overtook Oxford in 1988 and took a higher percentage of state school pupils in each subsequent year up to 2010. There was little change at either institution during the early/mid-1990s. Rates at both increased to more than 50% in the late 1990s and early part of this century. Both increased markedly in 2008 and fell back in 2009. A relatively large increase in pupils from maintained schools accepted at Cambridge saw their rate increase to 59% in 2012; the highest at either university during this period, compared to 56% at Oxford. The absolute number of state school entrants peaked in 2002 at Oxford and 2008 at Cambridge. Increases in the number of ‘overseas and other’ entrants mean highs in maintained school percentages between 2010 and 2012 were not matched by highs in absolute numbers. Independent school leavers made up 9.5% of young (<20) accepted home applicants to higher education via the Universities and Colleges Admissions Service (UCAS) in 2015.23
When ‘variable’ fees for new students were introduced in 2006 both universities set ‘targets’ for the proportion of pupils they aimed to take from state schools by 2011. These were set out in their access
agreements with the Office of Fair Access (Offa). Both rates apply to home applicants/entrants only so are slightly different from the other figures in this note which look at all those attending UK schools and colleges. Oxford’s target was 62% of applicants4 and Cambridge’s was
1 Pre 1989 data from HC Deb 5 December 1988 c4-7W and HL Deb 5 June 2003 c189WA
2 Includes those who applied before the 30 June deadline only. 3 Ucas end of cycle data resources
4 In 2009 just under 60% of applicants to Oxford were from the maintained sector.
The target level was suggested as it was the proportion of candidates with three As
Oxford Cambridge
35% 40% 45% 50% 55% 60%
1970 1975 1980 1985 1990 1995 2000 2005 2010 2015
60-63% of entrants.5 In 2011 64% of UK applicants to Oxford were
from state schools, this fell to 63% in 2012 and in 2013.6 In 2011 57%
of UK acceptances at Cambridge were from the state sector.7 This
increased to 63% in 2012 and fell slightly to 61% in 2013 (excludes home students at overseas and other schools/colleges).8
All universities which planned to charge tuition fees of over £6,000 for new students from 2012 had to produce revised access agreements. Those for Oxford and Cambridge are published on the Offa website. They include a range of targets and milestones the institutions have set themselves and agreed with Offa. Oxford’s does not include a simple state school percentage target, data on its progress can be found here. One of Cambridge’s targets is to increase the proportion of UK state sector entrants to 62-63% by the end of the access agreement period (2016).
Complete state/independent breakdowns by Oxbridge college are also published. Substantial variations exist between colleges. At Oxford, the three-year average up to 2013 showed that the proportion of
conditional offers made to maintained school pupils varied from 49% (Pembroke) to 81% (Mansfield).9 Only one out of 30 colleges made
fewer than half their offers to maintained school pupils.10
At Cambridge in 2013 Trinity had the lowest proportion of home acceptances from maintained school pupils at 46%. King’s had the highest proportion at 75%.11. With a relatively small number of new
students at each college, some year-on-year variation should be expected. Data for individual colleges in individual years should therefore be treated with caution.
In 2015 applications from maintained pupils made up a slightly larger share of total applications at Oxford and Cambridge–therefore acceptance rates for these pupils were lower. The acceptance rate for pupils12 from the maintained sector was 24% at Cambridge and 20%
at Oxford; the acceptance rate for independent school pupils13 was
31% at Cambridge and 25% at Oxford.14
at A levels from maintained schools. However, it does not appear in the latest access agreement.
5 www.offa.org.uk
6 Undergraduate Admissions Statistics: 2013 entry, University of Oxford
7 This is calculated on a slightly different basis from the Offa target data which is year
of entry not application/acceptance.
8 Undergraduate Admissions Statistics - 2011 cycle, University of Cambridge;
Undergraduate Admissions Statistics - 2012 cycle, University of Cambridge
9 Excludes Harris Manchester which admits mature students only 10 Undergraduate Admissions Statistics: 2013 entry, University of Oxford
11 Undergraduate Admissions Statistics - 2013 cycle, University of Cambridge. Highest
maintained proportion excludes the mature students colleges (Homerton, Hughes Hall, Lucy Cavendish, St Edmunds, Wolfson)
12 Home and overseas 13 Home and overseas
14 .Undergraduate Admissions Statistics 2015, University of Oxford;
2.1
Historical information
The Education Act 1944 extended free education to all state secondary schools and introduced a clear distinction between primary and
secondary education at age 11. There was some public sector support for some pupils in grammar schools before then and pupils did stay on to the senior department of elementary school. But without an entirely free maintained secondary school sector the concept of entrance data by type of school is meaningless.
The rest of this section summarises historical information on types of entrants. It uses different definitions and is taken from different sources so is presented in a narrative form with the appropriate context and definitions, rather than a simple table or chart which would leave these out and present a misleading picture.
The issue of differences in access to Oxford and Cambridge is very longstanding. The 1922 Royal Commission quoted work which stated that after the Reformation the flow of monks and friars to the two universities ceased and “...as a direct result of this, the proportion of country gentlemen’s sons increased”.15 The report of the 1922 Royal
Commission looked into the accessibility of these universities to ‘poor’ students. While not defining what it meant by ‘poor’, the report stated that reforms which followed the 1852 Royal Commission meant that:16
The number of poor men in residence at both Universities
increased materially during the last half of the nineteenth century. This increase has been very rapid in recent years…
Citing evidence from the two years before the First World War the report said that around half of Scholarships awarded were to boys from ‘cheaper’ boarding and day schools and around 20% were won by boys from the ‘cheapest’ day schools.17 It added that “practically all the boys
on the latter list must have been sons of poorer parents”. 18
The first comprehensive official data on the school background of entrants was published in the late 1930s. In their 1937-38 report the University Grants Committee stated:19
In the course of last year attention in Parliament and elsewhere was directed to the question of the number of students
originating from public elementary schools who found their way to universities.
Some information had earlier been provided by all universities, other than Oxford and Cambridge, and figures were published in this year for the first time. Oxford and Cambridge were included from 1938-39 when 24.2% of full-time home entrants to Oxford and 19.3% at Cambridge started their education in a public sector elementary school.
15 J A Venn Oxford and Cambridge Matriculations, quoted in Report of the Royal Commission (Oxford and Cambridge Universities) Cm 1588 (1922) p.10
16 Cm 1588 para. 155
17 Those with fees of less than £10 per year, around £800 in current prices. 18 Cm 1588 para. 155
The equivalent figure for all other universities was 54.8%.20 Such
students could have attended independent schools afterwards, or been supported by central or local government at a grammar school. In 1947-48 the rates had reached 39% for Oxford and 30% for
Cambridge. In the final year these data were published (1950-51) 43% of entrants to Oxford and 34% of entrants to Cambridge came started their education at public sector elementary schools. The rate for the other universities had increased to 71%.21
This statistic became less relevant as more pupils benefited from free state secondary education and could potentially attend state grammar schools. No routinely published data on entrants by type of secondary school replaced it for a period of around two decades. There were some one-off assessments in the intervening period.
The Committee of Vice-Chancellors and Principals of the Universities of the UK carried out a detailed inquiry into university applications that was published in 1957.22 This found a very similar proportion of
entrants who started at state elementary schools as the 1950-51 figure mentioned above. Among candidates admitted to Cambridge in 1955-56 27% were from state grammar schools (or equivalent in Scotland and Northern Ireland). The equivalent figure for Oxford was 39%. This compares to 60% across all universities. State grammar schools would have been the only type of maintained school to send pupils to
university at the time.23 These figures and all those below exclude
entrants from Direct Grant grammar schools (they received public funding to pay the fees of pupils from state primary schools that had to make up at least 25% of their places).
A survey carried out in 1961 as part of the work for the Robbins Report found that 34% of all students at Oxford and 27% at Cambridge had attended a state secondary school compared to 63% across all
universities. Entrants to men’s colleges in 1964 were also reported with 37% from state schools at Oxford and 37% at Cambridge. Breaking the survey results down by entrance year the authors reported that the proportion of state school pupils entering either institution went from 26% in 1959 to 37% in 1964.24
If these findings are put alongside the data in Table 1 and the chart earlier on in this note we can conclude that ‘state school pupils’ improved their representation at Oxford and Cambridge between the end of the 1930s and end of the 1940s; there appears to have been relatively little change in the late 1950s, but further increases in the 1960s and late 1970s saw state school pupil numbers draw roughly
20 Returns from universities and university colleges in receipt of Treasury grant academic year 1938-39, University Grants Committee. Table 2
21 Returns from universities and university colleges in receipt of Treasury grant academic year 1950-51, University Grants Committee. Table 2
22 R Kelsall Applications for Admissions to Universities. Report on an Inquiry
commissions by the Committee of Vice-Chancellors and Principals of the Universities of the United Kingdom (1957). Tables 9 and 11
23 Excludes those who had been to such schools and a private or preparatory school 24 Higher Education (the Robbins Report) -Report of the committee appointed to the
equal with independent schools at the start of the 1980s. State school participation was higher at Oxford, on the measures given here, up to the mid-1960s. However, given there are large gaps this may not necessarily have been the case in each and every year.
2.2
Schools with the highest entry rates to
Oxbridge
The Sutton Trust analysed entrants to Oxbridge by individual school over the period 2002-06.25 They found that the 30 schools26 (less than one
percent of the total) with the highest admissions rates to Oxbridge made up 15% of entrants. The admission or ‘hit rate’ used by the authors is the number of entrants to Oxbridge as a proportion of the total number of university entrants. The 200 schools with the highest Oxbridge hit rates (just over 5% of relevant schools) accounted for 48% of entrants. An average of 10% of university entrants from such schools went to Oxbridge, compared to 1% at the remaining schools. Similar but less extreme patterns were found for entry to the ‘Sutton Trust’ group of universities27.
Analysis of this data and A-level results28 found that variation in results
could only ‘explain’ part of the divergent entry rates across schools. Some schools with very similar results had very different entry rates. The top 30 performing state grammar schools had similar A-level scores to the top 30 independent schools and, based on results alone, expected Oxbridge hit rates would be higher in independent schools by less than half of one percentage point. The actual rate for these independent schools was 13.2% in 2006, well above the 7.5% for the top 30 grammars. Different indicators of A level performance might produce somewhat different outcomes, but the report noted a slightly larger gap when hit rates were compared to average A level points per exam entry.29
Westminster School and St Paul’s Girls’ School achieved the highest Oxbridge hit rates over the five years with 49.9% and 49.0% (of pupils who went on to university) respectively. The best performing state grammar and comprehensive schools on this measure were the
Colchester Royal Grammar School (19.5%) and the Dame Alice Owen’s School (10.5%). There was only one state comprehensive in the top 100 list which excludes schools were fewer than 20 pupils went to Oxbridge over the five year period
The Sutton Trust updated this research in 2011 with data on entrants between 2007 and 2009.30 This found a similar pattern to the earlier
report. Students from the 100 schools with the highest Oxbridge
25 University admissions by individual schools, The Sutton Trust (September 2007) 26 28 independent, one grammar and one comprehensive
27 The 13 with the highest public league table rankings: Birmingham, Bristol,
Cambridge, Durham, Edinburgh, Imperial College, London School of Economics, Nottingham, Oxford, St Andrews, University College London, Warwick and York.
28 Average A level points score per pupil. 29 Sutton Trust 2007 pp15-17
admission rates31 took more than 30% of places. There were 16 state
grammars among these schools, but no state comprehensives. Hills Road Sixth Form College in Cambridge had 204 students accepted at Oxbridge over these three years, only Eton and Westminster had higher totals, but this was 8.6% of all their students who applied to university and was outside the top 100 on this admission rate.
In 2011 students from grammar schools made up around one-third of state school entrants to Oxford and Cambridge respectively.32 In the
same year they made up 26% of students who gained at least three As at A-Level from the state sector33 in England.34
In July 2012 The Department for Education released new ‘experimental’ statistics which looked at the destination of A level students the year after they took their qualifications. The data identify those in higher education and within this those in any Russell Group university and those at Oxford or Cambridge. The information is taken from matching National Pupil Database records to those held by the Higher Education Statistics Agency. It only includes young people who studied at state sector schools or colleges in England. Information is broken down by region, local authority, individual (state) school or college and, more recently, student characteristics. The data now covers the period up to 2014 and can be found at can be found at: Destinations of Key Stage 4 and Key Stage 5 pupils.
Both Oxford and Cambridge now publish data on applications and acceptances by school (Ucas apply centre).
31 Here as a proportion of UCAS applicants from each school
32 Undergraduate Admissions Statistics: 2011 cycle, University of Cambridge.
Undergraduate Admissions Statistics: 2011 entry University of Oxford 33 State funded schools and FE sector colleges
3.
Gender
The following table shows the proportion of female students attending Oxbridge at selected intervals over the last 30 years. There has been a significant increase over this period. Latest data show that Oxford has around 50% female representation and Cambridge slightly below 50%35. Differences between the two institutions may in part reflect
differences in the range of courses offered. Rates were below 20% in 1970/71. Women accounted for 56.2% of all undergraduates across all UK institutions in 2014/15.36
In 1938-39 8.7% of all home full-time entrants to Cambridge were women compared to 17.5% at Oxford and 27.6% across all universities in Great Britain. In 1955-56 this rate had reached 9.7% at Cambridge, 15.4% at Oxford and 28.8% for all universities in Great Britain.37
4.
Ethnicity
Information on the ethnic background of home students applying and accepted to Oxford and Cambridge has been produced since the early 1990s. In 1992, 5% of accepted UK applicants to Oxford were non-white38. This increased to almost 8% in 2002 and 14% in 2013.39 At
Cambridge approximately 5% of acceptances in 1990 were non-white, increasing to 14% in 2002 and to 16% in 2013.40 The equivalent figure
for 2008 from all home accepted applicants through UCAS was 23%.41
Clearly admission rates by ethnic group will be influenced to a large extent by underlying patterns of attainment.
35 From 2009/10 the rate at Cambridge fell below 50% in the HESA figures. Their data
included many fewer time students from that year and a larger majority of part-time undergraduates are female.
36 Students in Higher Education Institutions, 2014/15, HESA. Table 12
37 Returns from universities and university colleges in receipt of Treasury grant, various
years, University Grants Committee. Table 2
38 Home accepted applicants only. Includes those of mixed background 39 Oxford colleges: statistics for entry, various years
40 Latest figures exclude ‘unknowns’. Undergraduates: statistics of applications and acceptances, various years, Cambridge University Reporter; Undergraduate Admissions Statistics. 2013 cycle, and earlier, University of Cambridge
41 www.ucas.ac.uk
Percentage of female undergraduate students at Oxford and Cambridge
Academic year
1970/71(a) 1980/81(a) 1990/91 2001/02 2010/11 2011/12 2012/13 2013/14 2014/15
Oxford 19.4 29.8 43.2 51.0 50.4 50.5 50.3 51.0 50.6
Cambridge 12.9 27.5 40.0 53.6 47.2 46.8 46.9 46.4 46.6
(a) Full-time degree students only UK and overseas undergraduates
Note. The treatment of part-time students from 2009/10 means the data from before and after this time are not comparable.
Sources: University statistics, UGC, various years
5.
Under-represented groups
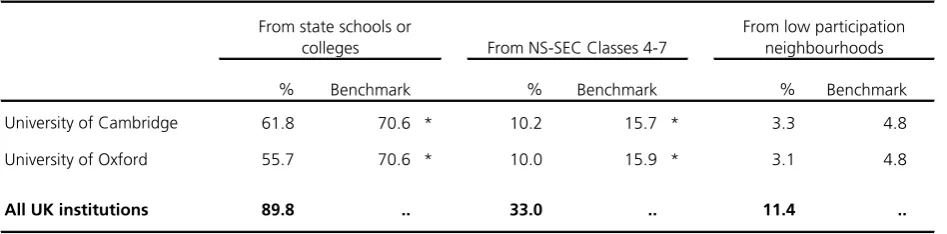
The Higher Education Statistics Agency (HESA) publishes data on the participation of under-represented groups. The latest results for Oxford and Cambridge are shown in the following table. To help comparison between institutions benchmark figures have been calculated. These estimate the score that the whole UK sector would have achieved if it had the same subject and entry qualification profile as the institution. These are further adjusted for the location of the institution. Results that are significantly different from the benchmark are marked (*) in the table.As in previous years both institutions had significantly fewer pupils from the state sector and from socio-economic groups 4-7 than their
benchmark values. They both also had fewer, but not significantly fewer, pupils from low participation neighbourhoods than the
benchmark.42 These indicators have been published since 1997/98 and
both universities have been significantly below their state school and social class benchmarks in each year. They have also taken a smaller proportion of pupils from low participation neighbourhoods, but this difference has not always been significant and has not been at either institution since 2007/08.43
Oxford and Cambridge were not alone in scoring below the benchmark values for state school and lower socio-economic group participation. In 2014/15, 20 out of 122 English higher education institutions were significantly below their state school benchmark and 26 were
significantly below their socio-economic group benchmark. Six of the other 17 English universities from the Russell Group of 24 ‘elite’ institutions scored significantly below benchmark on these two
42 Low participation neighbourhoods are those wards in the bottom 20% for young
participation in higher education. This is based on the proportion of people who were aged 18 between 2005 and 2009 and entered higher education between 2005/06 and 2010/11 aged 18 or 19. The 2011/12 and 2012/13 indicators use new underlying data but the same method as used since 2006/07. Before then the data on this indicator is not directly comparable.
43 Performance indicators in higher education, HESA/HEFCE
Access to Oxbridge by under-represented groups Young full-time first degree entrants 2014/15
% % %
University of Cambridge 61.8 * 10.2 * 3.3
University of Oxford 55.7 * 10.0 * 3.1
All UK institutions 89.8 33.0 11.4
* Denotes a value significantly different from both the unadjusted and the location adjusted benchmark
Source: Performance Indicators in Higher Education in the UK, 2014/15, HESA
.. .. ..
70.6 15.7 4.8
70.6 15.9 4.8
From state schools or
colleges From NS-SEC Classes 4-7
From low participation neighbourhoods
indicators in 2011/12 -Bristol, Durham, Exeter, Leeds, Newcastle and Nottingham.44 None of these institutions scored significantly below their
low participation neighbourhood benchmark.45 Bath was the only
non-Russell Group institution significantly below both benchmarks in 2012/13.46
In 2011-12 14.3% of full fee-paying students at Oxford and 14.8% at Cambridge received a bursary because they qualified for a full
maintenance grant (household income below £25,000). The average across all institutions in England was 36% and Oxford and Cambridge’s figures were the lowest of any institution with more than 100
students.47
Cambridge set out 2011 targets in earlier access agreements for under-represented groups. The state school target was mentioned earlier. The (revised) low participation neighbourhood aspiration was ‘We hope to increase the proportion of students from ‘low participation
neighbourhoods’ to approximately 5-6% by 2011’. The ‘social class’ element was ‘Our aim is, by 2011, to have increased the proportion of our intake with parental occupations categorised within Social Classes 4-7 to a range between 13% and 14%.’48 Both were missed and in its
own commentary on these the university said that progress had been disappointing on the socio-economic group and low participation neighbourhoods indicators. Oxford did not included explicit targets on these measures in its access agreements, only stated that it would develop its own milestones.49 Its commentary sets out the progress the
university made on the milestones it chose.
44 Location adjusted benchmarks
45 Performance indicators in higher education 2010/11, HESA
46 Current Russell Group which was expanded from 20 to 24 (UK wide) in March 2012 47 Access agreement and widening participation strategic 2011-12 and National
Scholarship Programme 2012-13 (in-year) monitoring outcomes, OFFA/HEFCE
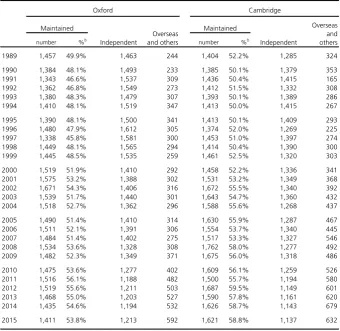
Table 1
Acceptances to Oxbridge by type of schoola, by year of entry, 1989 to 2015
number %b number %b
1989 1,457 49.9% 1,463 244 1,404 52.2% 1,285 324 1990 1,384 48.1% 1,493 233 1,385 50.1% 1,379 353 1991 1,343 46.6% 1,537 309 1,436 50.4% 1,415 165 1992 1,362 46.8% 1,549 273 1,412 51.5% 1,332 308 1993 1,380 48.3% 1,479 307 1,393 50.1% 1,389 286 1994 1,410 48.1% 1,519 347 1,413 50.0% 1,415 267 1995 1,390 48.1% 1,500 341 1,413 50.1% 1,409 293 1996 1,480 47.9% 1,612 305 1,374 52.0% 1,269 225 1997 1,338 45.8% 1,581 300 1,453 51.0% 1,397 274 1998 1,449 48.1% 1,565 294 1,414 50.4% 1,390 300 1999 1,445 48.5% 1,535 259 1,461 52.5% 1,320 303 2000 1,519 51.9% 1,410 292 1,458 52.2% 1,336 341 2001 1,575 53.2% 1,388 302 1,531 53.2% 1,349 368 2002 1,671 54.3% 1,406 316 1,672 55.5% 1,340 392 2003 1,539 51.7% 1,440 301 1,643 54.7% 1,360 432 2004 1,518 52.7% 1,362 296 1,588 55.6% 1,268 437 2005 1,490 51.4% 1,410 314 1,630 55.9% 1,287 467 2006 1,511 52.1% 1,391 306 1,554 53.7% 1,340 445 2007 1,484 51.4% 1,402 275 1,517 53.3% 1,327 546 2008 1,534 53.6% 1,328 308 1,762 58.0% 1,277 492 2009 1,482 52.3% 1,349 371 1,675 56.0% 1,318 486 2010 1,475 53.6% 1,277 402 1,609 56.1% 1,259 526 2011 1,516 56.1% 1,188 482 1,500 55.7% 1,194 580 2012 1,519 55.6% 1,211 503 1,687 59.5% 1,149 601 2013 1,468 55.0% 1,203 527 1,590 57.8% 1,161 620 2014 1,435 54.6% 1,194 532 1,626 58.7% 1,143 679 2015 1,411 53.8% 1,213 592 1,621 58.8% 1,137 632
(a) All domiciles. Figures for maintained 'schools' include students from FE colleges.
(b) Maintained school pupils as a percentage of all accepted maintained and independent school pupils
Sources: Undergraduate admission statistics, University of Oxford, Oxford colleges: statistics for entry, various years Undergraduates: statistics of applications and acceptances, various, Cambridge University Reporter Undergraduate Admissions Statistics, various years, University of Cambridge
Maintained
Independent
Overseas and others Cambridge
Maintained
Independent
BRIEFING PAPER
Number 616 5 September 2016
About the Library
The House of Commons Library research service provides MPs and their staff with the impartial briefing and evidence base they need to do their work in scrutinising Government, proposing legislation, and supporting constituents. As well as providing MPs with a confidential service we publish open briefing papers, which are available on the Parliament website.
Every effort is made to ensure that the information contained in these publicly available research briefings is correct at the time of publication. Readers should be aware however that briefings are not necessarily updated or otherwise amended to reflect subsequent changes.
If you have any comments on our briefings please email [email protected]. Authors are available to discuss the content of this briefing only with Members and their staff.
If you have any general questions about the work of the House of Commons you can email [email protected].
Disclaimer
This information is provided to Members of Parliament in support of their parliamentary duties. It is a general briefing only and should not be relied on as a substitute for specific advice. The House of Commons or the author(s) shall not be liable for any errors or omissions, or for any loss or damage of any kind arising from its use, and may remove, vary or amend any information at any time without prior notice.