University of Southern Queensland
Faculty of Engineering and Surveying
Stabilisation of Goulburn Valley Soils for the
Improvement of Subgrades in New Low Traffic
Pavement Construction
A dissertation submitted by
Peter Willmott
in fulfilment of the requirements of
Courses ENG4111 and 4112 Research Project
towards the degree of
Bachelor of Civil Engineering
Abstract
Stabilisation is a technique that has been used to strengthen road pavement materials for many years in Australia. Stabilising the natural subgrade soils to create a subbase layer as part of new pavement construction in the Goulburn Valley region, is however, quite rare. This particular practice has been used in other areas of Australia and it is considered that a significant depth reduction to overlying granular pavement material may be achieved where stabilisation of the Goulburn Valley soils is incorporated into new pavement construction.
The magnitude of the benefit can be influenced by various factors that include the original strength of the natural subgrade soil and the receptiveness of the particular soil to strength improvement as a consequence of stabilisation.
The five different clay soils sampled from the study area (Goulburn Valley region) have all shown substantial strength gain as a result of stabilisation. The lime additive has performed well with all soils in the testing group and other additives including General Purpose Cement, Triple Blend and H2Off have provided substantial strength gain with the lower plasticity soils. Adding Slag/Lime has generally been less effective across the range of soils when compared to the other additives used in the study. California Bearing Ratio testing has formed the basis for the measurement of strength improvement to the clay soils and the results of this testing have confirmed the ability to achieve a design CBR strength of at least CBR 15 % when stabilised with the most appropriate additives.
University of Southern Queensland
Faculty of Engineering and Surveying
ENG4111 & ENG4112
Research Project
Limitations of Use
The Council of the University of Southern Queensland, its Faculty of Engineering and Surveying, and the staff of the University of Southern Queensland, do not accept any responsibility for the truth, accuracy or completeness of material contained within or associated with this dissertation.
Persons using all or any part of this material do so at their own risk, and not at the risk of the Council of the University of Southern Queensland, its Faculty of Engineering and Surveying or the staff of the University of Southern Queensland.
This dissertation reports an educational exercise and has no purpose or validity beyond this exercise. The sole purpose of the course pair entitled "Research Project" is to contribute to the overall education within the student’s chosen degree program. This document, the associated hardware, software, drawings, and other material set out in the associated appendices should not be used for any other purpose: if they are so used, it is entirely at the risk of the user.
Prof G Baker Dean
Certification
I certify that the ideas, designs and experimental work, results, and analyses and conclusions set out in this dissertation are entirely my own effort, except where otherwise indicated and acknowledged.
I further certify that the work is original and has not been previously submitted for assessment in any other course or institution, except where specifically stated.
Peter Willmott
Student Number: Q10209224
________________________________ Signature 24.10.2005
Acknowledgements
I wish to thank a number of people for their continued assistance and support during the course of my project work:
• Dr Richard Merifield from the Faculty of Engineering and Surveying at the University of Southern Queensland, for his guidance and supervision of my project work and assistance with the preparation of my dissertation.
• David Melrose from B.M Consulting Engineers for his willingness to provide supervision of my work and for his continued advice, guidance and support along the way.
• Damien Byrne from B.M Consulting Engineers for his readiness to provide advice on specific aspects and overall guidance throughout the project.
• To both David Melrose and Damien Byrne for the use of laboratory and field testing equipment. My thanks also for the generous purchase of items that were needed to complete experimental testing work.
• Rohan McDowall from Blue Circle Southern Cement for the supply of materials required to perform experimental testing and for his continued willingness to correspond and provide technical assistance.
• David Earl, work colleague and friend, who provided support and frequently engaged in dialogue with respect to particular aspects of my project.
• To Lauren, Hannah, Aimee and Molly for their patience and understanding of their Dad’s quest to complete this work and fulfil his desire to graduate.
Table of Contents
Abstract...i
Certification ... iii
Acknowledgements... iv
Table of Contents ... v
List of Figures ... x
List of Tables... xii
Chapter 1: Introduction ... 1
1.1 Stabilisation in Pavement Construction... 1
1.2 Stabilisation in the Goulburn Valley Region... 2
1.3 Project Aims and Objectives ... 3
1.4 Dissertation Overview ... 4
Chapter 2: Assessment of Consequential Effects... 6
2.1 Sustainability ... 6
2.2 Ethical Responsibilities ... 7
Chapter 3: Background Information and Literature Review ... 9
3.1 Goulburn Valley Region... 9
3.2 Geology ... 10
3.2.1 Clay ... 11
3.2.2 Silt ... 12
3.2.3 Sand ... 12
3.4 Typical Pavement Construction in the Goulburn Valley... 14
3.4.1 Stabilisation in the Goulburn Valley ... 15
3.5 Pavement Design ... 16
3.6 Past Work on Stabilisation for Pavement Construction ... 19
3.7 Test Methods Used For Assessing Potential Strength Gain through Stabilisation of Soils ... 23
3.8 Selection of Stabilising Additives ... 24
3.8.1 Selection based on Classification Testing ... 24
3.8.2 Selection with Consideration of Maximum Working Times... 26
3.9 CBR and UCS Testing to Establish Modified Design Subgrade Strengths... 27
3.10 Cementitiously Stabilised Material Categories ... 28
3.11 Stabilising Additive Trial Application Rates... 30
3.12 Strength Test Curing Periods... 30
3.13 Stabilisation Methods ... 31
3.13.1 Cementitious Stabilisation... 31
3.13.2 Lime Stabilisation... 31
3.13.3 Bituminous Stabilisation ... 32
3.13.4 Granular Stabilisation... 32
3.14 Stabilisation Binders... 33
3.14.1 Lime... 33
3.14.2 General Purpose Portland Cement... 34
3.14.3 Supplementary Cementitious Materials... 35
3.14.4 Pozzolans... 35
3.14.5 Ground Granulated Blast Furnace Slag (GGBFS) ... 35
3.14.6 Fly Ash ... 36
3.14.7 Chemical Binders ... 36
Chapter 4: Methodology ... 38
4.1 Soil Sampling ... 40
4.1.1 Location of Sampling Sites ... 40
4.1.2 Sampling Method ... 40
4.2 Sample Preparation... 41
4.3 Soil Classification Testing... 42
4.3.1 Atterberg Limits ... 42
4.3.1.1 Liquid Limit ... 43
4.3.1.3 Plasticity Index ... 46
4.3.1.4 Linear Shrinkage ... 46
4.3.2 Particle Size Distribution... 47
4.3.2.1 Sieve Analysis ... 48
4.3.2.2 Hydrometer Sedimentation Test... 49
4.4 X-Ray Fluorescence and Diffraction Testing... 52
4.4.1 X-ray Fluorescence Spectroscopy (XRF)... 52
4.4.2 X-ray Diffraction (XRD) ... 52
4.4.3 LECO Carbon Analysis... 53
4.5 Density Testing... 53
4.6 Selection of Stabilising Binders ... 56
4.7 Soil Strength Testing ... 58
4.7.1 California Bearing Ratio (CBR) ... 59
4.7.2 Unconfined Compressive Strength (UCS) ... 65
4.8 Capillary Rise, Absorption and Swell ... 69
4.9 Analysis of Experimental Results... 73
4.9.1 Soil–Binder Combinations Providing Good Strength Gain... 73
4.9.2 Assignment of Subgrade Strength for Pavement Design ... 74
4.9.3 Pavement Designs Incorporating Stabilised Subgrades and Subgrades that Remain Untreated ... 75
Chapter 5: Testing Results... 80
5.1 Soil Sampling Details ... 81
5.2 Field Moisture Contents ... 82
5.3 Maximum Dry Density and Optimum Moisture Content Testing... 83
5.4 Plasticity Analysis Testing ... 83
5.5 Particle Size Distribution Testing... 84
5.6 Soil Classification... 85
5.7 X-Ray Fluorescence and X-Ray Diffraction Testing ... 85
5.7.1 X-ray Fluorescence Spectroscopy (XRF) Testing... 85
5.7.2 LECO Carbon Analysis Testing... 86
5.7.3 X-ray Diffraction (XRD) Testing ... 87
5.8 California Bearing Ratio Testing... 88
5.9 Unconfined Compressive Strength Testing... 90
5.10 Capillary Rise Testing ... 92
5.12 Swell Testing ... 96
5.13 Comparison Testing... 98
Chapter 6: Analysis of Experimental Test Results ... 100
6.1 Aim of the Analysis... 100
6.2 Analysis of California Bearing Ratio (CBR) Test Results ... 100
6.3 Analysis of Unconfined Compressive Strength (UCS) Test Results... 106
6.4 Analysis of Capillary Rise Test Results ... 110
6.5 Analysis of Water Absorption Test Results ... 114
6.6 Analysis of Swell Test Results ... 117
6.7 Overall Soil Stabilisation Assessment ... 119
6.8 Design Stabilised Subgrade Strength ... 119
6.9 Analysis Incorporating Typical Pavement Designs... 120
6.9.1 Pavement Depth Requirements where Stabilisation of the Subgrade is not Undertaken ... 122
6.9.2 Pavement Depth Requirements where Stabilisation of the Subgrade is Undertaken ... 124
6.9.3 Comparison between Pavement Depths Considering both Untreated and Treated Subgrade Soils ... 125
Chapter 7: Conclusions and Further Work ... 129
7.1 Outcomes and Key Findings ... 129
7.1.1 Additive Performance... 129
7.1.2 Savings to Subbase Material ... 130
7.2 Further Work ... 131
Appendices ... 138
Appendix A: Project Specification... 139
Appendix B: Safety... 142
Appendix C: Experimental Test Results... 146
Appendix C1: Soil No. 1 Test Results ... 147
Appendix C2: Soil No. 2 Test Results ... 199
Appendix C3: Soil No. 3 Test Results ... 251
Appendix C4: Soil No. 4 Test Results ... 303
Appendix C5: Soil No. 5 Test Results ... 355
Appendix D: Comparison Test Results... 407
Appendix E: XRF / XRD Test Results ... 411
List of Figures
Figure 3.1 – Goulburn Valley Region... 10
Figure 3.2 – Plasticity Chart (Source AS1726)... 13
Figure 3.3 – Typical new flexible pavement make-up... 15
Figure 3.4 – Typical Pavement Design Chart (Source: APRG, 2001)... 18
Figure 3.5 – The effect of cement content and soil type on the UCS of cement stabilised samples... 21
Figure 3.6 – Guide to selecting a method of Stabilisation. ... 24
Figure 3.7 – Typical combinations of binders with soil types. ... 25
Figure 3.8 – Relationship between UCS and Resilient Modulus for lime stabilised materials... 28
Figure 3.9 – Lime stabilisation in road construction... 32
Figure 4.1 – Mechanical Drill used for the sampling of soils. ... 41
Figure 4.2 – Liquid Limit machine used for determining the Liquid Limit of soils. ... 44
Figure 4.3 – Determining the Plastic Limit of soils. ... 45
Figure 4.4 – Linear Shrinkage of a soil... 47
Figure 4.5 – Nest of sieves used for the determination of the Particle Size Distribution of soils... 49
Figure 4.6 – Hydrometer sedimentation test used to determine the silt and clay fractions of a soil. ... 50
Figure 4.7 – Density testing using standard compaction. ... 55
Figure 4.8 – Additives used for Experimental Testing. ... 57
Figure 4.9 – Initial mixing of stabilising binder with soil... 58
Figure 4.10 – CBR testing machine. ... 61
Figure 4.11 – Specimen at completion of CBR test... 62
Figure 4.12 – Effect of Lime on Optimum Moisture Contentand Density. ... 63
Figure 4.13 – UCS test specimens. ... 65
Figure 4.14 –UCS testing machine. ... 67
Figure 4.15 – Failed UCS Test Specimen... 68
Figure 4.16 – Capillary rise in a stabilised soil specimen... 71
Figure 4.17 – Example providing a typical comparison between possible Pavement Make-ups... 76
Figure 4.19 – Pavement Design Chart for 90% Confidence Level. ... 78
Figure 6.1 – CBR versus Additive Content for Soil No. 1... 101
Figure 6.2 – CBR versus Additive Content for Soil No. 2... 102
Figure 6.3 – CBR versus Additive Content for Soil No. 3... 102
Figure 6.4 – CBR versus Additive Content for Soil No. 4... 103
Figure 6.5 – CBR versus Additive Content for Soil No. 5... 103
Figure 6.6 – UCS versus Additive Content for Soil No. 1... 107
Figure 6.7 – UCS versus Additive Content for Soil No. 2... 107
Figure 6.8 – UCS versus Additive Content for Soil No. 3... 108
Figure 6.9 – UCS versus Additive Content for Soil No. 4... 108
Figure 6.10 – UCS versus Additive Content for Soil No. 5... 109
Figure 6.11 – Capillary Rise for Soil No. 1 following stabilisation with various additives. ... 111
Figure 6.12 – Capillary Rise for Soil No. 2 following stabilisation with various additives. ... 111
Figure 6.13 – Capillary Rise for Soil No. 3 following stabilisation with various additives. ... 112
Figure 6.14 – Capillary Rise for Soil No. 4 following stabilisation with various additives. ... 112
Figure 6.15 – Capillary Rise for Soil No. 5 following stabilisation with various additives. ... 113
Figure 6.16 – Water Absorption for Soil No. 1 following stabilisation with various additives. ... 115
Figure 6.17 – Water Absorption for Soil No. 2 following stabilisation with various additives. ... 115
Figure 6.18 – Water Absorption for Soil No. 3 following stabilisation with various additives. ... 116
Figure 6.19 – Water Absorption for Soil No. 4 following stabilisation with various additives. ... 116
List of Tables
Table 3.1 – Maximum Allowable Working Times following mixing
with Cementitious Binders... 26
Table 3.2 – Typical Properties of Modified, Lightly-Bound and Heavily-Bound Materials... 29
Table 4.1 – Binder type and application rates used for experimental testing... 57
Table 4.2 – Initial curing periods used with each binder type... 59
Table 4.3 – Specimen curing details for CBR testing. ... 64
Table 4.4 – Stabilised specimen curing periods for UCS testing. ... 66
Table 4.5 – Stabilised specimen curing periods for Capillary Rise, Absorption & Swell testing... 69
Table 5.1 – Soil sample details... 81
Table 5.2 – Sample labels. ... 82
Table 5.3 – Field moisture contents for each soil... 82
Table 5.4 – Maximum dry density and optimum moisture content. ... 83
Table 5.5 – Plasticity analysis test results. ... 83
Table 5.6 – Sieve analysis test results. ... 84
Table 5.7 – Sand, silt and clay fractions for each soil... 84
Table 5.8 – Soil classifications... 85
Table 5.9 – X-ray Fluorescence Spectroscopy (XRF) test results... 86
Table 5.10 – LECO Carbon Analysis results for Soil No.1. ... 86
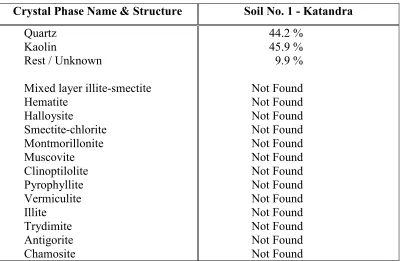
Table 5.11 – X-ray Diffraction (XRD) test results for Soil No.1... 87
Table 5.12 – California Bearing Ratio Test Results... 89
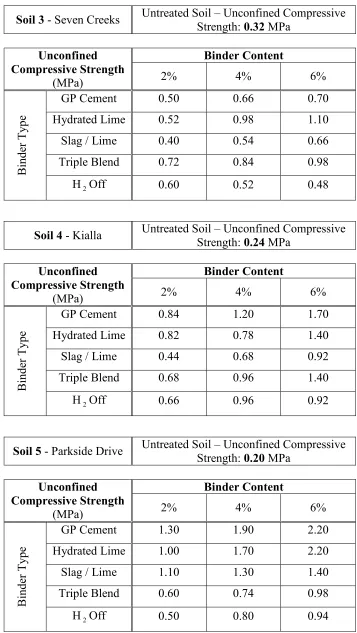
Table 5.13 – Unconfined Compressive Strength test results... 91
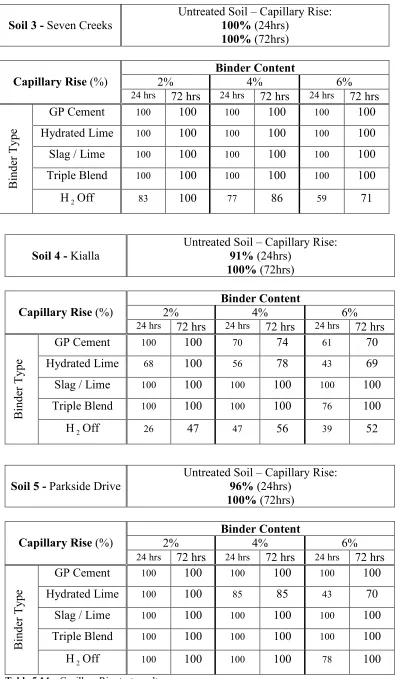
Table 5.14 – Capillary Rise test results... 93
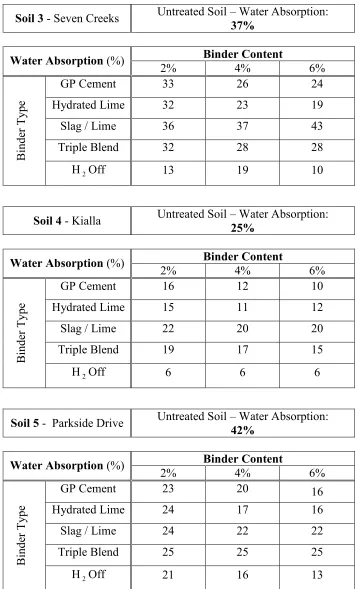
Table 5.15 – Water Absorption test results. ... 95
Table 5.16 – Swell test results... 97
Table 5.17 – Comparison testing results. ... 98
Table 6.1 – Best performing binders based on CBR test results. ... 104
Table 6.2 – Best performing binders based on UCS test results. ... 109
Table 6.4 – Minimum depth of cover for 2 x 10⁴ESAs. ... 123
Table 6.5 – Minimum cover depth for 1.5 x 10⁵ESAs... 123
Table 6.6 – Minimum depth of cover over Design CBR 15% for 2 x 10⁴ESAs. ... 124
Table 6.7 – Minimum depth of cover over Design CBR 15% for 2 x 10⁴ESAs. ... 124
Table 6.8 – Depth of stabilisation & Depth of Saved Subbase Material for 2 x 10⁴ESAs (95% Confidence Level). ... 125
Table 6.9 – Depth of stabilisation & Depth of Saved Subbase Material for 2 x 10⁴ESAs (90% Confidence Level). ... 126
Table 6.10 – Depth of stabilisation & Depth of Saved Subbase Material for 1.5 x 10⁵ESAs (95 % Confidence Level)... 126
Chapter 1:
Introduction
1.1
Stabilisation in Pavement Construction
The continuing development of new residential and commercial subdivisions in the Goulburn Valley region maintains the ongoing need for new pavement construction. This construction is commonly on land previously used for farming purposes and predominantly over both silty and sandy clays known geologically as fine-grained alluvial deposits of the Shepparton Formation. The clays invariably have relatively low California Bearing Ratio (CBR) strengths of typically around 2 % to 5 % and flexible pavements are designed on the basis of these subgrade strengths. Crushed rock materials are provided for flexible pavement construction by numerous quarries located throughout the region.
consequently, reducing the depth of granular pavement materials required to be placed as part of the pavement construction process.
Irrigation farming land covers a substantial portion of the Goulburn Valley region. This can present road construction contractors with moist subgrade conditions at the commencement of new pavement construction, where subdivision developments extend into the previously farmed areas. It is also apparent that the road construction season now continues well into the winter period and this also results in problems associated with unstable subgrades due to excessive moisture. Stabilisation of the subgrade soils is occasionally used to provide a stable platform for the pavement construction works to continue.
It is likely that, while drying the subgrade to a stable condition, the addition of stabilising binders will generate strength gains to these natural soils and offer much-improved subgrades when coupled with the provision of good drainage. In this situation, subgrade stabilisation could be adopted from the outset and achieve benefits to the construction practices, as well as reducing the required overall granular material component.
1.2 Stabilisation in the Goulburn Valley Region
With an absence of experimental data for the stabilisation of the soils specific to the Goulburn Valley region, stabilising the pavement subgrade to increase the subgrade strength, as part of the pavement design and construction process, is not a common practice is this region. It is likely that with a number of quarries located across the region, providing a relatively plentiful supply of crushed rock, the use of subgrade stabilisation to reduce the depth of crushed rock material has not generally been considered.
benefits by carrying out typical pavement designs considering the modified subgrade strengths. Vido and Vorobieff (2002) suggest that one use of lime stabilisation is to improve the properties of clay subgrade soils to subbase quality and as a consequence reduce the thickness of overlying materials. It is this particular aspect that will be concentrated on in this project work. It is also anticipated that the most appropriate binder types will be established for these specific soils as part of the study.
A Project Specification has been developed for this research project task, detailing the specific project aims and setting out the proposed programme that will be followed. A copy of this document is provided in Appendix A.
1.3
Project Aims and Objectives
The project is undertaken with the following aims and objectives:
1. To measure the strength gain to a range of the commonly occurring soils located across the Goulburn Valley region through stabilisation with a variety of stabilising binders at varying application rates.
2. Evaluate the results of California Bearing Ratio (CBR) testing and Unconfined Compressive Strength (UCS) testing of the stabilised soils and establish the binders that perform well with each of the soil types on the basis of the strength gained. The alternatives considered will be limited to the results that show a substantial strength gain as a consequence of stabilisation.
4. Undertake modelling of typical pavement make-ups for lightly trafficked roads considering the natural subgrade strength and also the incorporation of a stabilised subgrade layer. Compare the make-ups and establish the savings in subbase material that are achievable when stabilisation is considered.
1.4
Dissertation Overview
This dissertation is set out in seven chapters and a brief summary of each of the chapters is provided here.
Chapter 1. Introduction. This chapter has introduced the research topic and outlined the need for work in this area. The specific aims and objectives have been defined in this chapter.
Chapter 2. Assessment of Consequential Effects. The ethical responsibilities required of the author and any related consequences stemming from my research have been identified in this chapter. Both the benefits and detrimental effects are discussed.
Chapter 3. Background Information and Literature Review. Previous research undertaken in this field of study is covered in this chapter. Information relating to key findings by others and general stabilisation guidelines and practices that have been documented in various pavement design manuals and related papers from previous research is discussed.
Chapter 5. Testing Results. The results of all experimental testing work undertaken as part of the study are provided in this chapter.
Chapter 6. Analysis of Experimental Test Results. The results of the experimental testing are analysed in accordance with the analysis methods chosen and the outcomes are discussed within the context of the overall project objectives.
Chapter 2:
Assessment of Consequential Effects
2.1
Sustainability
Stabilisation in pavement construction is a rehabilitation technique used to improve existing pavement materials where pavements have failed. As a result, this can avoid the need to import new materials. Alternatively, it is also used to improve the strength of new pavement materials, and in doing so, reduce the overall pavement depth and as a consequence the total amount of pavement material. Stabilisation of subgrade soils is also common in providing a strengthening of the supporting soils where the natural strength is low, or where moisture levels result in unstable subgrades at the time of pavement construction.
Cartage of crushed rock materials to a road construction site can be an energy intensive practice. The use of large haulage vehicles can impact heavily on the existing road network and these trucks are typically high consumers of fuel. The transporting of these materials can, therefore, add substantial cost to the construction process. The lessening of the need to transport considerable quantities of material can only result in substantial energy and financial savings.
The process of quarrying rock for use in pavement construction impacts on the local environment. A reduction to the current use of this resource for new pavement construction can only serve to limit the burden associated with this practice. While some of the stabilisation binders proposed for trialling in the experimental component of this study, are also produced from the extraction of natural resource materials, the stabilisation process uses relatively small amounts of these materials when compared to crushed rock quantities required where stabilisation is not used.
Stabilising binders are now being manufactured from the by-products of iron production and the burning of coal for the production of electricity. Improving materials through treatment with these products is considered a valuable utilisation of an otherwise wasted resource.
2.2
Ethical Responsibilities
In undertaking the project work, it is considered essential that both the overall project objectives and all of the individual processes involved are given careful ethical consideration.
the results of this work may provide pavement designers in the local area with an increased confidence of expected subgrade strength gains when considering subgrade stabilisation.
The proposed experimental component of the project is to be undertaken using current test procedures that are well recognised and endorsed by the Australian Engineering Industry. All proposed testing procedures are from current Standards Australia test methods and VicRoads testing methods and Codes of Practice. The testing is to be performed by a NATA registered testing laboratory, ensuring a high standard of testing practices generate highly credible results.
In undertaking the testing program for the trialling of stabilising binders, it is vital that the results are in no way affected by expected or desired outcomes.
Companies that manufacture stabilising binders for the use in pavement construction, publish information relating to the benefits of using a particular product to achieve substantial strength gains to materials as part of road pavement construction. While often, experimental data is available to support the suggested gains that should result, it may be considered irresponsible for a pavement designer to take this information on face value and apply it to materials that have not been used for the experimental analysis.
Chapter 3:
Background Information and
Literature Review
While stabilisation has been used in pavement construction in Australia for many years, the advantages associated with this construction technique, when used for strengthening subgrade soils in the Goulburn Valley, are limited by the lack of available information specific to this group of soils.
3.1
Goulburn Valley Region
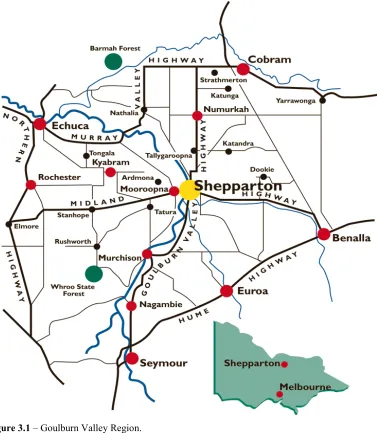
Figure 3.1 – Goulburn Valley Region.
3.2 Geology
material. This material spread over the Northern Victorian plains during dry climatic periods. The Shepparton Formation deposits typically range from a depth of 50 metres to 125 metres and overlay older alluvial (Tertiary) and marine (Ordovician) sediments. The most recent deposits have taken place in the last 10,000 years and are associated with present day streams and rivers. These soils are variable deposits of sand and clay and there has been minimal development of the soil profile. The Shepparton Formation deposits consist primarily of fine-grained silts and clays and course-fine-grained sands.
3.2.1 Clay
Clay is described as an earthy material composed of certain kinds of silicate minerals that have been broken down by weathering (The World Book Encyclopedia, 1995). Clay mineral particles are of ‘plate like’ form and have a high surface to mass ratio (Craig, 1997). The very small sheet like particles of alumina and silica are bound together by water. The particles are extremely small in size, measuring less than 0.004 millimetres in diameter, and are produced by the chemical weathering of rock. The mineral form of the parent rock is changed through the action of water, oxygen and carbon dioxide. Groups of crystalline particles are formed as a result of this weathering process.
3.2.2 Silt
Silt is a sedimentary material consisting of small particles. The particles vary in size between 0.004 and 0.063 millimetres in diameter. Silt is predominantly quartz mineral particles that are larger than clay but smaller than sand particles and is produced by the mechanical weathering of rock.
3.2.3 Sand
The World Book Encyclopedia (1995) describes sand as a loose accumulation of tiny pieces of rocks or minerals that are larger than silt or clay but smaller than
pebbles. Sand grains generally fall into the size range of 0.063 to 2.36 millimetres. Sand is formed as a result of the weathering and decomposition
of igneous, sedimentary or metamorphic rock. Sand may be composed of many types of material and the most common mineral in sand is silica usually in the form of quartz but may also contain other minerals including feldspar and fragments of rock.
3.3 Soil Classification Systems
provides a common means of describing the characteristics of a soil for engineering purposes in Australia. The description of a soil follows a relatively strict wording format and each soil group is represented by a two-letter symbol.
The particle size distribution of the soil is primarily used to distinguish the soil between the major groupings of boulders, cobbles, gravels, sands, silts and clays, according to the percentages of material passing particular sieve sizes. When considering fine grained soils (i.e. more than half of the material less than size 63 mm is smaller than 0.075 mm) the liquid limit and plasticity index are used to read the soil classification group from a chart provided in AS 1726. This chart has been reproduced below in Figure 3.2.
PLASTICITY CHART 0 10 20 30 40
0 10 20 30 40 50 60 70 80
LIQUID LIMIT (%)
P L A S T IC IT Y I N D E X ( % ) CH CI CL OH or MH OL or ML CL-M L
'A ' LINE
Figure 3.2 – Plasticity Chart (Source AS1726).
This chart is also of use when grouping the coarse-grained soils, however further explanation will not be provided here.
indicate the range of plasticity. The letter ‘O’ is utilised for organic soils and can include both organic clays and silts.
Each soil group is provided with a typical form for naming the soil. A soil is often a combination of various constituents and the standard soil description describes the primary soil, modified by the minor components. The standard format places the soil component that exists in lesser proportion first, followed by the major soil component. For example, a predominantly clay soil with a smaller proportion of silt would be described as a silty clay. Further description, including such properties as the plasticity range, colour, moisture condition, consistency, and soil structure, enhances the overall information for the particular soil type.
The classification of soils using a universal system allows the relatively easy identification based on the similarities of certain material properties.
3.4
Typical Pavement Construction in the Goulburn Valley
3 5 0m m T o ta l G ra n u la r
Subbase: Class 4 Crushed
Subgrade: Natural Silty Clay soils Rock (150mm)
Sprayed Seal or Thin Asphalt Surface
Upper Base: Class 2 Fine Crushed Rock (100mm)
Lower Base: Class 3 Fine Crushed Rock (100mm)
M a te ri a l D e p th
Figure 3.3 – Typical new flexible pavement make-up.
3.4.1 Stabilisation in the Goulburn Valley
3.5
Pavement Design
The design of new flexible pavements can be undertaken with the guidance of a variety of road design manuals currently available in Australia. The more commonly used manuals include:
• Pavement Design – A Guide to the Structural Design of Road Pavements (AustRoads).
• A Guide to the Design of New Pavements for Light Traffic – A Supplement to Austroads Pavement Design (APRG).
• Sealed Local Roads Manual (arrb).
• VicRoads Guide to Pavement Design – Technical Bulletin No. 37 (VicRoads).
The design of a flexible pavement refers to the process of determining the granular material make-up required as a consequence of the load that the traffic will apply over the life of the pavement and the support provided by the underlying soils. The soils over which the pavement is constructed are referred to as the “subgrade” and the strength of a subgrade is usually expressed in terms of the California Bearing Ratio (CBR).
The design traffic used for the purpose of designing a pavement is established from an estimation of the cumulative volume of commercial vehicle traffic over the nominated design period. Commercial Vehicles are vehicles with a gross vehicle mass in excess of 3 tonne (APRG, 2001). Each commercial vehicle will apply a different load to the pavement depending on such things as the type of vehicle, axle configuration and overall loaded weight of the vehicle. It is therefore appropriate to express each commercial vehicle type in terms of a reference axle load. The reference load is referred to as a “Standard Axle” with the definition of the standard axle being a single axle with dual tyres transmitting a load of 80 kN to the pavement (APRG, 2001). A commercial vehicle may be equal to more or less than one standard axle.
The calculation of the design traffic loading for the design of a flexible pavement is undertaken by estimating the cumulative number of commercial vehicles over the design period and converting these to an equivalent number of the standard axle loads. This is known as the Equivalent Standard Axles (ESAs) and this value becomes an important design parameter.
The support provided by subgrade soils can be assessed using a number of methods and these include:
• In-situ CBR test.
• Dynamic Cone Penetrometer test.
• Laboratory CBR test.
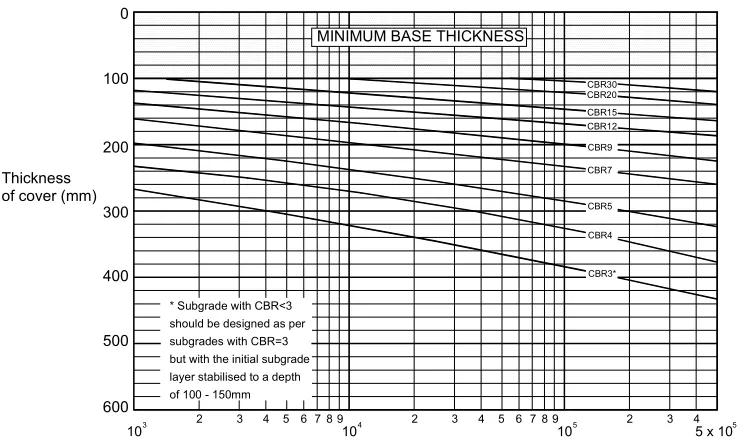
Following the determination of the design traffic loading and the assignment of the subgrade design strength, the specific design of the required pavement make-up can be undertaken using either empirical design charts, provided in the above mentioned design manuals, or by using the mechanistic procedure. An example of an empirical design chart is provided below in Figure 3.4.
0 100 200 300 400 500 600 2 10 Thickness of cover (mm)
MINIMUM BASE THICKNESS
* Subgrade with CBR<3 should be designed as per subgrades with CBR=3 but with the initial subgrade layer stabilised to a depth of 100 - 150mm
CBR30 CBR20 CBR15 CBR12 CBR9 CBR7 CBR5 CBR3* Traffic: ESAs
3 4 5 6 7 8 9
3
104
2 3 4 5 6789
105
3
2 4 5
5 x 10
CBR4
DESIGN CHART FOR GRANULAR PAVEMENTS WITH THIN BITUMINOUS SURFACING, BASED ON A 95 PERCENT CONFIDENCE LEVEL
Figure 3.4 – Typical Pavement Design Chart (Source: APRG, 2001).
lower layers, through to a minimum depth of high quality material required in the upper zone.
The mechanistic design procedure is based on “the structural analysis of a multi-layered pavement subject to normal traffic loading” (Austroads, 2004). This procedure is typically used when cemented materials and/or asphalt layers greater than 40 mm in depth are used in the pavement make-up. This method requires the elastic characterisation of pavement materials (modulus and Poisson’s ratios). The strains that occur as a result of the load applied by the traffic, within each of the pavement layers, are analysed and pavement layer thicknesses are determined based on a limiting fatigue tolerance. The “Circly” computer software program allows rapid modelling of pavements using the mechanistic design procedure. Design charts have also been developed for the mechanistic procedure and are contained within some of the design manuals.
3.6
Past Work on Stabilisation for Pavement Construction
Past experimental work undertaken by both State Road Authorities and private testing organisations has considered stabilisation of common crushed rock products and natural gravel materials. This work has been used to provide pavement designers with presumptive values for the elastic properties of these cemented materials in the Austroads pavement design manual (Austroads, 2004). This manual however, does not provide guidance when considering the stabilisation of natural clay subgrade soils, and designers therefore need to rely on experience in their local area or commissioning of testing of stabilised samples of the specific subgrade soil type being considered. Tight time constraints often placed on the pavement design process can limit the ability to initiate the desired experimental testing program.
Michael Finlay and Tim Gibney (1987) reported that research undertaken by the Swinburne Institute of Technology, established that CBRs of at least 40 % were achievable for various soils located across Victoria after stabilising with lime and cement. Additive contents ranged from 2 % to 4 % for lime and 3% to 5 % for cement. Lime stabilisation has resulted in increases to CBR strength from 3 % to 20 % and as high as CBR 50 % with follow-up cement treatment according to Vido and Vorobieff (2002).
Evans (1997) found that stabilising the high plasticity subgrade soils located on the Freestone Creek to Eight Mile Intersection job in Queensland with lime, achieved laboratory CBR results as high as 100 % and UCS values of up to 1.4 MPa. While high strength values can be achieved with laboratory testing, it is likely that it would not be appropriate to design a pavement based on subgrade strength values of this magnitude.
Evans (1997) reported on two trial stabilisation projects for new pavement construction near Warwick, Queensland, undertaken by the Department of Main Roads (DMR) in the late 1990s. The Killarney Road trial involved stabilising the black clay subgrade soils with quicklime. Test sections were prepared with varying application rates between 3% and 6% to allow performance assessment of the various trial sections. As part of the trial a control section was left without the addition of quicklime. Measurement of the in-situ modulus has commenced after a period of 6 months and ongoing measurement is proposed to confirm continuing improvement with time.
Matthews (1994) reported that a design method developed by R.J. Dunlop, Ministry of Works, New Zealand and further developed by M. Finlay and T. Gibney, enabled substantial savings in imported granular material following stabilisation of low CBR subgrades to form a subbase layer. Matthews provides the example of the potential to achieve a 270 mm depth saving of granular material where a subgrade soil with a CBR of 3 % is stabilised with lime and cement to produce a subbase with strength CBR 40 %.
Metcalf measured the increase to the unconfined compressive strength of three different soil types when stabilised with various amounts of cement. A sandy gravel, silty clay and sandy clay material was used in the experimental testing and the results have been reproduced and are shown in the Figure 3.5 below (AustStab, n.d.).
2
0 4 6 8 10
2 4 6 8 10
0
U
C
S
(
M
P
a
)
Cement Content (%)
Silty clay
Sandy clay Sandy gravel
Vorobieff and Murphy (2003) noted that many local government roads in Victoria and NSW that have been constructed with initial lime stabilisation of the subgrade soils continue to perform well. It is however acknowledged that there is little documentation of the design and construction of these roads from which better evaluation of the specific performance could be assessed.
Pardo (n.d.) reported that the Local Government Authority for Berwick (SE Melbourne) has issued a pavement design guide for its local roads. Subgrades generally consist of Silurian silty clays through to Quaternary silts, sands and clays of medium to high plasticity. The design guide stipulates subgrade improvement as a compulsory measure for all new road construction due to variable and poor strength properties of subgrade soils in the region. It was acknowledged that the most economical method of subgrade improvement in the area has proven to be chemical stabilisation. Lime and Lime/Cement blends have provided good results to date.
3.7
Test Methods Used For Assessing Potential Strength Gain
through Stabilisation of Soils
Discussions with both VicRoads personnel and private engineering consultants involved with pavement investigation and design, confirmed that the California Bearing Ratio (CBR) test and Unconfined Compressive Strength (UCS) test are common testing methods used for assessing the strength gain to materials through stabilisation. It was, however, suggested that that the effectiveness of UCS testing may be limited by the relatively low range of compressive strength values that are likely to result when stabilising natural clay soils. VicRoads usually only considers the CBR test when assessing the subgrade soil strength either in a natural state or modified through stabilisation. Inclusion of testing the stabilised soils for shrinkage and capillary rise properties was also a recommendation provided as part of these discussions.
The “Selection of Stabilisation Methods for Roadworks” (AustStab, n.d.) seminar notes recommend that the UCS test is a relatively low cost and inexpensive test that provides reliable results for stabilisation of materials. It also notes that the RTA test method provides greater detail concerning the sample preparation and curing in comparison to AS 1141.51.
The joint VicRoads and AustStab Technology Transfer Seminar notes (VicRoads & AustStab, 2001) confirm that the unconfined compressive strength forms a key design criterion when estimating the modulus for use in the mechanistic pavement design method.
3.8
Selection of Stabilising Additives
3.8.1 Selection based on Classification Testing
The selection of the most suitable stabilising additives for use with a particular soil type can be based on the consideration of a number of aspects including the climate and drainage conditions, parent soil properties and the estimated traffic loading. The preliminary selection of a method of stabilisation of a soil is commonly based on the particle size distribution and Atterberg limits of the soil. Establishment of the percentage of material passing the 0.075 mm sieve along with the plasticity index of the soil allows suitable methods of stabilisation to be selected from a chart provided by Austroads (Austroads, 1998). This chart has been reproduced below (Figure 3.6). Austroads notes that this should be taken as a broad guide only.
More than 25% Passing 75µm Less than 25% Passing 75µm
Plasticity
Index PI≤ 10 10 < PI < 20 PI ≥ 20
PI≤ 6 PI x % passing 75µm≤60
PI≤ 10
PI ≥ 10
Form of Stabilisation
Cement & Cementitious Blends
Lime
Bitumen
Bitumen / Cement
Blends
Granular
Miscellaneous Chemicals
Key Usually suitable
Doubtful Usually not Suitable
An alternative guide is provided by AustStab (1998) to allow the selection of appropriate binders for initial laboratory testing (Figure 3.7). The use of this chart requires plasticity and sieve analysis testing to be undertaken on the parent material to enable classification.
Binder Classification Crushed Rock Well graded gravel Silty / clayey gravel
Sand Sandy / silty clays Heavy clays GP Cement GB Cement Cementitious Blends Lime
Lime & Cement Lime & Flyash Bitumen Bitumen/Cement Insoluble polymer Usually very suitable Usually satisfactory
Usually not suitable
Figure 3.7 – Typical combinations of binders with soil types (Source: AustStab).
The AustStab seminar notes provide general guidance in the selection of appropriate binders that may be suitable with different soil types and rates their suitability from not suitable through to very suitable. Information provided in the chart suggests that the use of GP Cement, GB Cement and Lime are considered suitable for use with sandy and silty clays however GP Cement is not usually suitable for use with heavy clays.
A paper by Tom D. Wilmot (n.d.) provides a similar table with guidance on the suitability of various stabilising binders with particular soil types.
3.8.2 Selection with Consideration of Maximum Working Times
The selection of an appropriate stabilising additive to be used as part of pavement construction requires the consideration of the available working times associated with the application of particular binders. The addition of General Purpose cement can offer only very limited working times (typically 2 to 3 hours) while blended cements can increase the available working time in some cases to around 5 hours. Slower setting binders such as slag/lime provide a contractor with up to 12 hours in the winter period and the use of lime can extend the workability time for the stabilised soils considerably.
VicRoads provide guidance with respect to the maximum allowable working times following mixing with various additives. The time limits are contained within Table 307.053 of the VicRoads Standard Specifications for Roadworks and Bridgeworks (VicRoads, 2003) and this table has been reproduced below (Table 3.1).
Maximum Allowable Working Time (hours)
Cementitious Binder Construction
between October and April Construction between May and September Rapid Setting
Type GP Cement 2 3
Medium Setting Type GB Cements
Cement/Slag blend (50% to 60% cement content) Cement/Fly ash blend (70% to 80% cement content) Cement/Slag/Fly ash blend (55% to 65% cement content)
3 5
Slow Setting
Slag/Lime blends and other supplementary Cementitious Blends
8 12
Lime (Hydrated and Quicklime) 12 24
3.9
CBR and UCS Testing to Establish Modified Design
Subgrade Strengths
Austroads “Pavement Design - A Guide to the Structural Design of Road Pavements” (Austroads, 2004) and “VicRoads Guide to Pavement Design - Technical Bulletin No.37” (VicRoads, 1993) both state that subgrade materials, even when stabilised, should not generally be assigned a CBR value greater than 15 %. It is anticipated that even when applying this maximum limit to the CBR value for stabilised soils, elevation of the natural soil CBR strength from typical values of between 2 % and 5 % (based on previous testing of many soils across the region by B.M Consulting Engineers) is likely to provide some reduction to the depth of required overlaying granular material.
While it can be difficult to measure the flexural Modulus of natural and cemented materials, required for use in the mechanistic design procedure, Austroads provides an approximation of the Vertical Modulus based on a CBR value (Austroads, 2004).
Vertical Modulus (MPa) = 10 x CBR
Approximate Modulus correlations based on the 28 day UCS test values are also provided for cemented crushed rock and natural gravels.
EFLEX (MPa) = k UCS
With k values ranging from 1000 to 1250 typically for GP cements.
Work by Little has produced the following suggested relationship between Unconfined Compressive Strength (UCS) and Resilient Modulus for lime stabilised subgrade materials (Little, 1998).
Figure 3.8 – Relationship between UCS and Resilient Modulus for lime stabilised materials (Source: Little, 1998).
3.10 Cementitiously Stabilised Material Categories
Austroads divides cementitiously stabilised materials into two broad categories (Austroads, 1998).
• Modified Materials
A modified material refers to a material that has been stabilised with only small amounts of cementitious additives and Austroads suggest that these materials are normally treated as unbound granular material for pavement design purposes (Austroads, 1998). 0 500 1000 1500 2000 2500 3000
0 0.5 1 1.5 2 2.5 3 3.5 4
• Bound Materials
A bound material results when sufficient cementitious binder is combined with the material to cause a substantial increase to the stiffness and tensile strength of the stabilised layer. Depending on the degree of enhancement to these properties, the material may be further categorised as Lightly Bound and Heavily Bound. A bound material is treated differently when compared to an unbound material for pavement design purposes.
Austroads provides the following table (Table 3.2) with typical material properties for each of the material type categories explained above (Austroads, 1998).
Material Type Layer Thickness
(mm)
Design Strength (MPa)
Design Modulus (MPa)
Modified Applicable for any
thickness UCS ≤ 1.0 ≤1500
Lightly Bound Generally≤250mm
UCS: 1 – 4 (7 day strength:
1 – 7)
1500 – 2000
Heavily Bound Generally > 250mm UCS ≥ 4 2000 – 20,000
Table 3.2 – Typical Properties of Modified, Lightly-Bound and Heavily-Bound Materials (Source: Austroads, 1998).
The Austroads Pavement Reference Group pavement design guide (APRG, 2001) recommends that where a subgrade is stabilised to produce an improved material, the stabilised material is considered (for design purposes) as unbound granular material with its assigned CBR. Unbound materials are considered to be cross-anisotropic and their stiffness is stress dependant (APRG, 2001).
3.11 Stabilising Additive Trial Application Rates
Additive rates of between 2 % and 4 % are usual with economic consideration (ARRB, 1995). It is however noted that stabilising can be undertaken with application rates ranging between 1 % and 6 %.
Discussions with personnel at Blue Circle Southern Cement established that typical stabilising binder application rates vary between 1.0 % and 4.5 %. Generally chemical binders are applied at relatively low rates of between 1 % and 2 % with lime and cementitious additives applied at rates of between 2 % and 4 %.
3.12 Strength Test Curing Periods
The standard curing period for UCS testing on stabilised samples is 28 days. With limited time usually available for strength testing of stabilised material, a 7 day UCS test incorporating accelerated curing is being used by some testing organisations. This test can however produce poor repeatability results (AustStab, n.d.).
The standard 28 day UCS test may not be considered appropriate when used for materials stabilised with slower setting binders such as lime, slag and/or fly ash (AustStab, n.d.). It is suggested that curing times of up to 90 days may be more appropriate.
3.13 Stabilisation Methods
Stabilisation methods used in pavement construction fall into the following broad categories:
• Cementitious Stabilisation
• Lime Stabilisation
• Bituminous Stabilisation
• Granular Stabilisation
3.13.1 Cementitious Stabilisation
Cementitious stabilisation refers to stabilisation that is undertaken using cement or supplementary cementitious materials. Supplementary cementitious materials are formed when fly ash, blast furnace slag or other pozzolanic materials are mixed with lime. The primary reaction of cementitious stabilising agents is the reaction with water (contained in the soil) which leads to the formation of cementitious material. The reactions occurring do not depend on the nature of the soil and can be suitable for use with cohesionless materials such as gravels, sands, silts and low plasticity clays.
3.13.2 Lime Stabilisation
Figure 3.9 – Lime stabilisation in road construction.
3.13.3 Bituminous Stabilisation
Bituminous stabilisation is a form of stabilisation where bituminous materials are used to introduce cohesion in non-plastic materials.
3.13.4 Granular Stabilisation
Granular stabilisation is the process of improving a material by blending it with other granular materials. This can improve the particle size distribution and alter the plasticity of the original material.
3.14 Stabilisation Binders
While cement and lime have traditionally been the most common stabilising binders used in Australia, a number of cementitious blends have been introduced since the 1990s. These blends have allowed greater working times in the field, when compared to ordinary Portland cement and have also helped to reduce the problems associated with shrinkage cracking. The stabilising additives now available for use in pavement construction and pavement rehabilitation work are numerous and may be categorised as follows:
• Lime – hydrated lime or quicklime
• General purpose Portland cement
• Blends incorporating supplementary cementitious material
• Bituminous
• Chemical stabilisation
3.14.1 Lime
3.14.2 General Purpose Portland Cement
General purpose cement is described in AS3972 as “a hydraulic cement which is manufactured as an homogeneous product by grinding together Portland cement clinker and calcium sulphate, and which, at the discretion of the manufacturer, may contain up to 5 % of mineral additions”. Portland cements consist of carefully proportioned mixtures of calcium carbonate, alumina, silica, and iron oxide which, when calcined and sintered at high temperatures, give a new group of chemical compounds capable of reacting with water to form cementitious compounds (Cement and Concrete Association of Australia & Standards Australia, 2002). Cement hydrates in the presence of water to form hydrated silicates and aluminates and calcium hydroxide.
Cement also has a two-stage process. Hydration occurs almost immediately after mixing with water and the secondary cementation reaction takes place as the free-lime is diffused through the soil (AustStab, n.d.).
According to Austroads (Austroads, 1998), stabilisation with cement provides two important effects on the behaviour of soils:
• It greatly reduces the moisture susceptibility of some soils, giving enhanced volume and strength stability under variable moisture conditions.
3.14.3 Supplementary Cementitious Materials
In recent years the blending of binders for use in stabilisation has become popular. The combination of such products as fly ash, blast furnace slag or other pozzolanic type materials with cement and lime have produced additives that provide an increased working time, reduction to the potential for shrinkage cracking and cost saving through the use of similarly performing by-products. Blends utilising fly ash, slag and lime can achieve working times of up to 4 times that of GP cement (AustStab, n.d.).
3.14.4 Pozzolans
Austroads describes a pozzolan as a “siliceous or alumino siliceous material that, in finely divided form and in the presence of moisture, chemically reacts at ordinary room temperature with calcium hydroxide released by the hydration of Portland cement or lime to form compounds possessing cementitious products” (Austroads, 1998).
3.14.5 Ground Granulated Blast Furnace Slag (GGBFS)
lime can be combined in various proportions, the most common form of slag/lime is 85:15 which contains 85 % slag and 15 % lime.
3.14.6 Fly Ash
Fly Ash is the fine ash that is produced when coal is burnt in a pulverized fuel furnace. The most suitable fly ash is formed as part of power generation where black coal is burnt. This fly ash is high in silica and alumina and low in calcium and carbon. Fly ash produced in Australia is a pozzolan and may be combined with lime to form supplementary cementitious materials (Austroads, 1998).
A common form of a blend that incorporates supplementary cementitious materials is a product called Triple Blend. This additive is made up of 60 % General Purpose Cement, 24 % slag and 16 % fly ash.
3.14.7 Chemical Binders
H2Off is an example of a polymer used in stabilisation for road construction. H2Off is a hydrophobic Dry Powdered Polymer (DPP) and is manufactured from selected alkali flocculants and water repellent (hydrophobic) additives (Blue Circle Southern, 2005). As the strength of a soil normally reduces as it becomes wet, H2Off has been designed to resist the ingress of water and maintain the dry strength of the soil. H2Off is not a cementitious binder or a polymer adhesive and is therefore different from the other stabilising additives already mentioned. According to the manufacturer, the intended aim of stabilising with H2Off is to maintain the dry strength of the soil as opposed to increasing the materials strength as is the case with the use of other additives.
Chapter 4:
Methodology
The final body of practices that forms the overall project methodology has been arrived at following discussions with experienced personnel working within or having had an association with the field of stabilisation in pavement construction. My personal research findings from previous experimental work have also been drawn upon. The testing procedures adopted for the experimental works are from Standards Australia test methods and are well recognised by State Road Authorities and private soils testing organisations.
An outline of the project methodology is provided below:
• Select sampling site locations.
• Sample representative soils from study area.
• Prepare and undertake initial classification testing. i.e. plasticity and particle size distribution testing.
• Conduct characterisation testing to further differentiate each of the soils.
• Establish the maximum dry density and optimum moisture contents for the soils.
• Undertake strength testing of stabilised soils. i.e. CBR and UCS testing.
• Undertake capillary rise, swell and absorption testing.
• Analyse testing results to establish suitable stabilising additives for each of the soil types and appropriate design strengths for pavement design purposes.
• Analyse the benefits of incorporating stabilisation of the subgrade soils into new flexible pavement construction in the Goulburn Valley. Design new flexible pavements for typical light trafficked conditions, considering both the natural subgrade strength of the soils and alternatively the stabilised strength. Calculate the savings in subbase material when incorporating stabilisation of the subgrade in new pavement construction.
Prior to undertaking the field and laboratory experimental work, all safety issues associated with the execution of the project have been considered and a risk management assessment has been undertaken to ensure the minimisation of potential hazards. A risk assessment analysis is provided in Appendix B.
4.1
Soil Sampling
4.1.1 Location of Sampling Sites
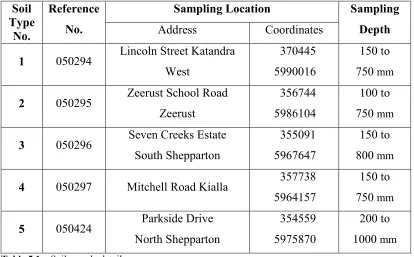
A total of five different soil types have been sampled from the Goulburn Valley region. The sampling depth has been limited to the upper soil stratum at each of the locations as this is considered to be the material most likely to be regarded as the “subgrade” when constructing a new pavement. The sample site locations were selected based on previous experience of the soil types located across the region together with guidance from geological maps.
4.1.2 Sampling Method
The soil samples were obtained using a mechanical drill fitted with a 300 mm diameter continuous flight auger. The sampling extended to a depth that corresponded to the change to a different soil type and this was generally at around 750 to 800 mm below the surface, with a maximum depth of 1000 mm in one of the sampling bores. The location of each test site was identified using the name of the adjacent road and the general district in which the test hole was positioned. The global coordinates were also recorded at each site using a hand held geographical positioning system instrument. The upper and lower sample depths were recorded to the nearest 50 mm.
Figure 4.1 – Mechanical Drill used for the sampling of soils.
4.2
Sample Preparation
The total soil sample from each individual site was combined and passed through a soil grater to reduce the soil clods to a size less than 10 mm. The soil was then split into representative samples and each sample was stored in an air-tight container until required for testing.
4.3
Soil Classification Testing
As noted earlier, the AS1726-1993 Geotechnical Site Investigations code, includes a system of classification that provides a means of describing a soil based primarily on the particle size distribution and plasticity of a soil. This system is similar in nature to the Unified Classification System and provides a common means of describing the characteristics of a soil for engineering purposes. This method of classification has been chosen to classify each of the soil types using the results of plasticity analysis and particle size distribution testing. Table A1, provided in AS1726, has been referred to when establishing each of the classifications. The classification testing has allowed an initial identification of the soils to ensure a range of different soil types have been considered and that possible future sampling of soils could be readily compared through relatively simple testing procedures.
4.3.1 Atterberg Limits
The plasticity of a soil often provides an approximate guide to the amount of clay within a soil. Generally speaking, a higher plasticity soil contains a higher percentage of clay. The plasticity is related to the clay mineral content or organic matter and can be established by determining the Atterberg limits through plasticity analysis testing. This testing involves determining the liquid limit, plastic limit and the linear shrinkage of a soil. The Liquid Limit and Plastic Limit are referred to as the Atterberg Limits, named after a Sweedish Scientist who first used them. The difference between the liquid limit and plastic limit of a soil is known as the plasticity index and this property is commonly used when describing a soil for engineering purposes.
• Determination of the Liquid Limit of a soil – One point Casagrande method - AS1289.3.1.2
• Determination of the Plastic Limit of a soil – Standard method - AS1289.3.2.1
• Calculation of the Plasticity Index of a soil - AS1289.3.3.1
• Determination of the Linear Shrinkage of a soil – Standard method - AS1289.3.4.1
4.3.1.1 Liquid Limit
The Liquid Limit is the water content at which a soil passes from the plastic to the liquid state (AS 1289.3.1.2, 1995). This occurs when the groove that has been scribed in the soil-water mixture, closes over for a length of 10 mm, when subjected to 25 blows in the liquid limit apparatus.
The liquid limit test is performed on the portion of the soil that passes a 0.425 mm sieve and has been air-dried or alternatively oven dried at between 45oC and 50oC. A sample of material is initially taken from the portion of soil passing the 2.36 mm sieve and rubbed down using a mechanical mortar and pestle. The material is then sieved through a 0.425 mm size sieve and the material passing the sieve is collected and wet-up to a moisture level estimated to be close to the liquid limit of the soil. The soil-water mixture is then covered and cured for a period of 12 hours.
groove closes over for a length of 10 mm. The moisture of the soil-water mixture is varied and retested until the closure of the groove occurs with around 25 blows. A small sample is taken from the mixture and the moisture content is measured by weighing the sample before and after drying to a constant mass. The calculated moisture content becomes the Liquid Limit of the soil.
Alternatively, the test may be performed, by recording the moisture content and corresponding blow counts for a range of points to either side of 25 blows. A best-fit line is drawn between the points that have been plotted on a log scale and the moisture content corresponding to 25 blows is then read.
Figure 4.2 –Liquid Limit machine used for determining the Liquid Limit of soils.
4.3.1.2 Plastic Limit
3 mm. The moisture content at which this occurs is known as the Plastic Limit of the soil.
The soil used in this test is also from the portion of material passing a 0.425 mm sieve and is prepared in a similar manner to that for the liquid limit test. The soil is however, only wet-up to a moisture level estimated to be slightly higher than the plastic limit. The moist soil sample is also cured for a period of at least 12 hours prior to performing the test. Following the curing period, the ball of soil is worked in the hands or rolled over a glass plate to reduce the moisture content. Smaller samples are taken and rolled in a thread on a glass plate until the thread begins to crumble when at a diameter of 3 mm. The sample is further dried or wet-up until crumbling can be achieved at a thread diameter of 3 mm. The crumbs are weighed and dried to constant mass to allow the determination of the moisture content. This moisture content is known as the plastic limit of the soil.
4.3.1.3 Plasticity Index
The plasticity index provides an indication of the level of plasticity of a soil and is commonly used when describing the properties of a soil. The index is the difference between the Liquid Limit and the Plastic Limit of a soil, expressed as a percentage.
4.3.1.4 Linear Shrinkage
The linear shrinkage test is used to determine the shrinkage of a soil when dried from the liquid limit moisture content. It provides an indication of the change to the volume of a soil as the soil dries and the extent of cracking that occurs as a result of this. An illustration of this test is provided in Figure 4.4 below.
This test is undertaken on soil that has been prepared following the same procedure used to prepare the liquid limit test. The sample used for the linear shrinkage test is normally obtained from the soil-water mixture when the liquid limit moisture content is achieved as part of the liquid limit test. The soil-water mixture used in the linear shrinkage should be at a moisture level that results in a closure of the groove at 25 ± 3 blows in the liquid limit machine.
Figure 4.4 – Linear Shrinkage of a soil.
4.3.2 Particle Size Distribution
The particle size distribution of each soil has been established by undertaking both a sieve analysis test and a sedimentation test using a hydrometer for the determination of the silt and clay fraction.