Rochester Institute of Technology
RIT Scholar Works
Theses
12-2018
Using Microalgae to Remediate Food and
Bio-Digester Effluents from Western New York Agro
Industries and Prospecting Harvested Algae
Biomass for Biofuel Feedstocks
Daniel Anini Baah
Follow this and additional works at:https://scholarworks.rit.edu/theses
This Thesis is brought to you for free and open access by RIT Scholar Works. It has been accepted for inclusion in Theses by an authorized administrator of RIT Scholar Works. For more information, please [email protected].
Recommended Citation
i
R.I.T
USING MICROALGAE TO REMEDIATE FOOD AND BIO-DIGESTER EFFLUENTS FROM WESTERN NEW YORK AGRO INDUSTRIES AND PROSPECTING
HARVESTED ALGAE BIOMASS FOR BIOFUEL FEEDSTOCKS
A THESIS SUBMITTED IN PARTIAL FULFILMENT OF THE REQUIREMENTS FOR THE DEGREE OF MASTER OF SCIENCE IN ENVIRONMENTAL SCIENCE
AT
THE ROCHESTER INSTITUTE OF TECHNOLOGY- USA.
DEPARTMENT OF ENVIRONMENTAL SCIENCE
THOMAS GOSNELL SCHOOL OF LIFE SCIENCES
DECEMBER 2018
Author: DANIEL ANINI BAAH
ii Approved by:
Dr. Jeffrey Lodge (Thesis Advisor)
Date
Dr. Ali Ogut
Committee member
Dr. Karl Korfmacher
iii ACKNOWLEDGEMENTS
This thesis is made possible through the guidance and support from the almighty God,
family, friends, faculty, and organizations. I am forever grateful to my advisor Dr. Jeffrey Lodge
for mentoring me throughout my research work. He gave me the liberty to independently explore
and investigate concepts relating to this work. His unique advising approach, encouragement and
timely feedback made this piece of work achievable.
I also owe an ocean of gratitude to my committee members, Dr. Karl Korfmacher and
Dr. Ali Ogut for their unrelenting efforts to advise and see to the success of this work. Their
constructive criticisms have helped to shape and prepare me to achieve greater heights in
academia. I am not also forgetting, Dr. Robert Osgood and Dr. Susane Pagano for their
encouragement through out my postgraduate journey.
I am also thankful to Ghana Education Trust Fund (GETFUND) for providing the needed
financial resources to funding this research in its entirety especially the fund administrator, Mr.
Baffoe, his deputies and the Government of Ghana (GoG).
I am also grateful to friends and lab members especially Katelyn Whitburn and Thulfiqar
Ali Al-Graiti for their encouragement and show of united spirit in difficult moments. Finally, I
would like to dedicate this thesis to my wife Alice Fiatsonu and kids Jeffery and Jadon.
iv
TABLE OF CONTENTS
List of tables vi
List of figures………....vi
Abbreviations………vii
Abstract ………viii
Chapter One Introduction………...1
1.1 Background………...1
1.1.1 Waste handling and treatment ……….………..1
1.1.2 Algal bioremediation as suitable alternative……….……….2
1.2 Knowledge gap………..………..3
1.3 Food waste streams in Western New York………...3
1.3.1 Case study 1: Dairy and Biodigester waste……….………..3
1.3.2 Case study 2: Greek Yogurt, Tofu and Cheese whey………6
1.3.3 Case study3: Egg waste water………..….8
1.4 Current treatment technologies and limitations………...9
1.5 Problem statement and Objective………..12
1.5.1 Hypothesis……….…12
1.5.2 Scientific mechanism supporting the research………..13
1.5.3 Aims and specific objectives……….14
1.5.4 Significance of the study ………..14
1.6 Methodology………..……...16
1.6.1 Establishing baseline parameters………..16
1.6.2 Algae culturing and growth studies……….17
1.6.3 Photobioreactor treatment………18
1.6.4 Greenhouse and onsite open pond treatment ………...19
1.6.5 Algae biomass harvest and lipid extraction………..20
1.6.6 Ultrasonication of algae cell walls………22
1.6.7 Thin layer chromatography………...………23
1.6.8 Carbohydrate extraction………23
1.6.9 Fermentation of extracted carbohydrates by yeast………25
1.6.10 Biochemical Methane Potential (BMP)………26
Chapter Two: Analysis of the different waste streams ……….29
2.1 Baseline characterization of the various wastewaters……….29
2.2 Microbial sampling in ADE ………...32
2.3 Discussion of results………32
2.3.1 Synergy’s ADE……… ………32
2.3.2 Feta cheese, Tofu, and Greek yogurt whey……….………….………34
2.3.3 Egg wastewater from Kreher farms……….35
2.3.4 Microbial diversity………..36
2.4 Conclusions ………37
Chapter Three 3.1 Algae cultures and treatment ……….37
3.2 ADE treatment with microalgae ………39
3.2.1 Small scale treatment in lab……….39
v
3.2.3 Onsite treatment and the effect of dilutions on treatment outcome………45
3.3 Isolation of ADE algae……… ………..47
3.4 Discussions 3.4.1 Algae growth studies……….49
3.4.2 Small scale lab experiments……….50
3.4.3 Extended treatment periods in the Greenhouse………...52
3.4.4 Onsite treatments in HRAP and impact of pre-treatment dilutions………...54
3.3 Conclusions………..55
Chapter Four: Egg wastewater nutrient reduction by various algae 4.1 Introduction………..56
4.2 Nutrient removal from egg wastewater with detergent by various algae………56
4.3 Nutrient removal from Egg waste water with no detergent……… ………59
4.4 Egg wastewater treatment in the greenhouse…..………...61
4.5 Experimental controls……… ………62
4.6 Discussions………..63
4.6.1 Reduction by Nostoc and Anabaena sp……… ………..64
4.6.2 Nutrient uptake by Web3 and Chlorella sp………..64
4.6.3 No Detergent egg wastewater nutrient reduction……….65
4.6.4 Greenhouse and field based HRAP treatment ………...66
4.6.5 Greenhouse based treatment of egg wastewater………..……….67
4.6.6 Experimental controls………..……….68
4.7 Conclusions……….69
Chapter Five Nutrient reduction in Feta cheese and Tofu whey……….…..70
5.1 Treatment of combined ADE and Whey effluents ……….72
5.2 Discussions………..72
5.3 Conclusions……….74
5.4 Summary and recommendations to RIT partner industries……….74
Chapter Six: Lipid extractions and thin layer chromatography (TLC)……….78
6.1 TLC Analysis………..78
6.2 Ultrasonication effect on lipid yield………...80
6.3 Carbohydrate extraction and quantification………....82
6.4 Effect of sequential extractions on yield……….84
6.5 Feeding algae sugars to Yeast……….………85
6.6 Utilizing algae chaff for biomethane………...87
6.7 Discussions……….………67
6.71Lipid extraction and TLC………..89
6.7.2 Algae oil versus food oil for biodiesel feedstock………90
6.7.3 Sonication effect on lipid yield………...91
6.7.4 Sugar extraction, quantification and fermentation………..92
6.7.5 Algae biomass in methane production………..……..93
6.8 Conclusions………94
Chapter Seven: Conclusions and recommendations for future work………...95
7.1 Conclusions………95
7.2 Recommendations for future work………97
vi
LIST OF TABLES
Table 1.1 Sample microalgae and cell wall sugar compositions ………... 29
Table 1.2 Summary sugar extraction and yeast fermentation procedure……….30
Table 2.1 Pollutants concentrations across Synergy LLC’s three lagoons ……….……..35
Table 2.2 Wastewater characterization for various wastewaters from partner industries……36
Table 2.3 Bacteria culturing and counts from ADE………37
Table 3.1 Dry biomass yield from growth studies………....43
Table 3.2 Comparing Greenhouse and site conditions during treatment ……….…50
Table 3.3 Effect of pretreatment dilutions on treatment efficiency……….…51
Table 4.1 Biomass yield from 1.5L Photobioreactors ……….66
Table 5.1 Outcome of Tofu whey treatment with microalgae………..74
Table 5.2 Summary of nutrient removal rates by various microalgae………..77
Table 6.1 Optical densitites of standard glucose concentrations……….83
LIST OF FIGURES
Figure 1.1 Dairy farms in NY State
Figure 1.2 Dug-out reservoirs containing dairy waste onsite at Synergy LLC Figure 1.3 Sample Cheese and Tofu whey from Yancy Fancy® and Northern Soy
Figure 1.4 Wastewater nutrient transformations for microalgae uptake Figure 1.5 Study Area (Synergy LLC site)
Figure 1.6 Photobioreactor
Figure 1.7 Open pond treatment in 10L, 50 gal, and 1220 gal tanks Figure 1.8 Biomass collection through centrifugation
Figure 1.9 Lipid extraction from biomass using organic solvents
Figure 1.11 Wastewater treatment in photobioreactors and open systems Figure 2.1 Variations in pollutant concentrations in ADE with time
Figure 3.1 Growth rate studies under various light spectra and egg wastewater Figure 3.2 Bioreactor based ADE nutrient reductions and pH changes
Figure 3.3 pH changes during ADE treatment
Figure 3.4 Extended ADE treatment with Chlorella,Scenedesmus, and Anabaena sp Figure 3.5 Open pond treatment in Greenhouse and onsite
Figure 3.6 Comparing nutrient reduction trends in diluted versus undiluted waste Figure 3.7 Testing growth rates of isolated ADE algae
Figure 3.8 Treating ADE with isolated ADE Algae
Figure 4.1 Treating Egg wastewater+det with Nostoc and Anabaena sp Figure 4.2 Treating Egg wastewater +det with Web3 and Chlorella sp
Figure 4.3 Detergent free egg wastewater treatment with variously selected microalgae Figure 4.4 Greenhouse based treatment of Egg wastewater with Botyrccocus sp
vii
Figure 5.1 Cheese whey nutrient reduction using selected strains Figure 5.2 Treating mixed ADE-whey with Chlorella sp
Figure 5.3 Pathways from waste-to-value products
Figure 6.1 Thin Layer Chromatography Analysis (TLC) from Chlorella sp Figure 6.2 Comparing TLC chromatogram of food and algae oil
Figure 6.3 TLC analysis of sonicated algae Figure 6.4 TLC from magnified sonication Figure 6.5 Deriving standard curve from glucose Figure 6.6 quantitative analysis of Algae sugars
Figure 6.7 Influence of sequential extractions on resource yield
Figure 6.8 Algae sugar fermentation by Kluveromyces sp and Saccharomyces sp Figure 6.9 Methane yield from algae biomass
Figure 6.10 Transesterification reaction
Figure 7.1 Pathways from waste to resource extractions
Abbreviations
ADE Anaerobic Digester Effluents BOD Biochemical Oxygen Demand COD Chemical Oxygen Demand EW Egg wastewater
EW+det Detergent containing egg wastewater FFA Free Fatty Acids
HRAP High Rate Algae Pond HRT Hydraulic Residence Time LED light emitting Diode MDL Maximum Daily Loads
POTW Publicly owned treatment works RIT Rochester Institute of Technology RPM Revolutions Per Minute
The USEPA United States Environmental Protection Agency TSA Tryptic Soy Agar
viii
ABSTRACT
Agro-industries of Western NY contributes to the US economy in diverse ways. Among
these are dairy, poultry, cheese, tofu and Greek Yogurt plants whose processes discharge
effluents high in pollutants such as NH3, PO4, NO3, and Fe which adversely affect aquatic
systems and the watershed if discharged untreated. Waste hauling causes an economic burden to
industries as WWTPs remain restrictive to these effluents, but Algae Remediation Technology
provides a sustainable alternative to treating agricultural wastewaters onsite. This study
sampled, assessed and treated effluents from selected production plants within NY State with
various algae. The research applied free suspended Algae technology to treat food-based waste
waters that have pollutant levels exceeding USEPA limits. While Botyroccocus sp and Chlorella
sp reduced 99% of NO3from Synergy’s dairy and bio digester effluents within 5 days residence
time, all algae species removed 75% of phosphorus within 5 days Residence Time (RT). Nostoc
sp removed 98% NO3 from Kreher farm’s Egg wash effluents but moderately removed PO4
within 6 days RT while Anabaena and Chlorella sp impressively removed 90% PO4 and over
90% NO3 within an average of 3 and 12-days RT respectively. Tofu, cheese, and Greek yogurt
whey all achieved bioremediation targets in less than 15 days RT. Post-treatment biomass
harvested contained triglycerides and FFA fraction. Ultrasonication did not influence lipids,
glucose and methane yields. Chlorella sp showed an avg 27g/L sugar yield compared to coffee
and other algae biomass which yielded only avg 10g/L sugars. Lipid or lipid-sugar extractions
from biomass increased Bio methane potential (BMP) by 1 and 5-fold respectively to 10ml
meth/gVS and 25ml meth/g VS. Analysis and results indicate that algae are effective at reducing
pollutants in agro-industrial effluents while producing high quality biomass for bioenergy
1 CHAPTER ONE
INTRODUCTION
1.1 BACKGROUND
1.1.1 WASTE HANDLING AND TREATMENT
When Abraham Maslow described the hierarchy of human needs, he prioritized food,
water, air, and health as the fundamental and most critical for human survival (McLeod, 2007).
However, these basic human needs cannot be possible if we sideline Environmental quality and
Sustainability since these complement one another. It is, therefore, imperative that industry
players pay critical attention to how they handle and treat their waste even as we strive to
achieve food security. As technology advances, various methods have been utilized ranging from
wastewater treatment plants to landfilling, composting and bio-digesters to handle and treat
different waste streams. However, these methods produce substandard outputs and the cost of
handling and treatments of secondary waste are economically unfeasible. The efficiencies of
WWTPs have been questioned in recent years (Panepinto, Fiore, Zappone, Genon, & Meucci,
2016) while state and federal regulations remain firm on the type of waste allowed in POTWs.
The cost of hauling waste to landfills and compost sites burdens most food processing industries
and facility managers (Oliveira, Oliveira, Bezerra, Silva Pereira, & Battistelle, 2017). In some
cases, facility owners pay surcharges if BOD and TSS limits exceed 300mg/l for discharged
waste into POTWs (Trabold, Ramchandra, Haselkorn, & Williamson, 2011). Therefore, a more
2 1.1.2 ALGAL BIOREMEDIATION AS SUITABLE ALTERNATIVE
Bioremediation technologies using both macro and microalgae have in recent years
gained momentum as suitable and more efficient means of liquid waste treatment onsite.
Microalgae are autotrophic species capable of utilizing nutrients in various waste media for
growth. The algae treatment technology was used on dairy farm effluents at Poisy in the French
Alps which resulted in 82-96% removal of nutrient loads removal compared to 76% removal of
nitrogen from WWTPs (G. Merlin & A. Gaillot, 2010). Similarly, both mono and polyculture
algae applied onto carpet mill effluents from north-central Georgia in open pond treatment style
achieved over 90% pollutants removal efficiency (Chinnasamy, Bhatnagar, Hunt, & Das, 2010).
Chlorella sp and Scenedesmus sp have been determined to be highly effective bio-sorbents in
heavy metal remediation compared to conventional activated carbons and Zeolite methods
(Suresh Kumar, Dahms, Won, Lee, & Shin, 2015). Hence, their potential to be used in the
treatment of high metallic mine effluents is justified, although certain physicochemical
parameters need to be constantly checked.
Higher treatment efficiencies were achieved when municipal wastewater mixed with
dairy wastewater was used as growth media for algae cultivation for biofuel. The treatment pond,
when supplemented with CO2, recorded a near 100% efficiency, but biomass lipid content varied
with nutrient availability and aging algal cells (Woertz, Feffer, Lundquist, & Nelson, 2009).
Given that CO2 can be sequestered into algae pond treatment systems, there is a high probability
that algal remediation systems could simultaneously reduce global climate change via CO2
sequestrations into treatment ponds. Eibl et al. (2014) went to the extent of isolating pH tolerant
3
pH as low as 4.0, a condition crucial to reducing the risk of contamination and also serve as a
very robust species in extreme environments.
1.2 KNOWLEDGE GAP
The applications of algae in diverse wastewater sources have seen many successes
ranging from manufacturing, municipal waste to mining effluents (Suresh Kumar et al., 2015;
Wang et al., 2010; Woertz et al., 2009). However, fewer investigations have been done to
simulate the concept of algal bioremediation to treat effluents from the food and agro-processing
industries in the United States, especially Western New York. The following case studies open
up potential opportunities to utilize algal remediation technology in the agro-industrial sector.
1.3 FOOD WASTE STREAMS IN WESTERN NY
1.3.1 CASE STUDY 1: DAIRY AND BIO-DIGESTER WASTE
Today the United States is home to some 51,000 dairy farms which provide milk
and beef to local and international markets. Production is expected to grow by some 5.1% in first
half of 2018 with a projected decline in meat prices due to high production and relatively low
demands (“USDA ERS - Market Outlook Dec 18th, 2017,” n.d.). The downside to commercial
dairy and livestock production is the magnitude of wastewater generated which can be
detrimental to the environment and human health. Tunçsiper et al. (2015) documented a mass
flow rate of 500 -10,000 l/day of dairy wastewater from the University of Vermont dairy farm
with high nitrate and phosphate concentrations above USEPA Maximum Daily Loads (MDL).
Also, an assessment of two major stall dairy farm sites in Wisconsin and Indiana have on-site
stabilization lagoons holding 23,400 and 48,212 cubic meters respectively of liquid manure
4
into WWTPs but could serve as an unending source of growth media for cultivating microalgae
for the biofuel industry while the recycled water could be harnessed for secondary purposes.
As of 2011, New York State hosted 5,300 dairy farms (fig 1.1) with Synergy farms
[image:13.612.76.414.205.476.2]being the largest in the State housing about 2000 dairy cattle and generating close to 425 tons of
Figure 1.1 Dairy farms in New York State
dairy waste per Day (“New York’s Largest On-Farm Biogas Power Project Generates Renewable
Energy for Nearly 1,000 Homes,” 2012). Although, Synergy farms based in Covington, NY
partners with CH4-Biogas to co-digest most of its dairy waste in a 2.1M -gallon digester,
digestate from the Anaerobic digester is confined in 3 onsite dug-out lagoons waiting to be
treated. The digestate cannot be channeled into a local POTWs since pollutants far exceed
acceptable limits and hence require some form of pre-treatment. Direct land application as
5
Digestate confined in dug-out lagoons can also cause local air quality issues. The situation gets
worse in the case of smaller farms which cannot finance exorbitant biodigester facilities. In the
words of farm owner John Noble, “It is an expensive venture which our sister farms cannot
afford. Thanks to our partners from Denmark and the NYSERDA providing $1M as an
incentive” (personal communication, 2nd December 2017).
In the summer of 2016, Synergy – CH4 Biogas partnered with Dr. Jeffrey Lodge’s lab
at the Rochester Institute of Technology on a pilot project to use microalgae to treat wastewater
from their digester (fig 1.2). Sample analysis of the digestate (ADE) shows phosphate and
ammonia high above the State’s permissible limits. Samples of ADE taken and tested in the
winter and summer of 2016 showed around 1789ppm and 318ppm for ammonia and phosphate
respectively while no nitrate was recorded. However, as a tiny fraction of ammonia volatilize,
some ammonia will undergo undergo oxidation via ammonia and nitrogen oxidizing bacteria.
The project could impact the environment positively by reducing the nutrient loads in
wastewaters to avoid possible eutrophication in water systems. Additionally, an unending source
of nutrient rich effluents could be used as growth media for algae cultivation for biofuels which
could be a sustainable replacement for corn for ethanol in the United States while saving the
company thousands of dollars in waste hauling. Equally large farms like the Willet and
6
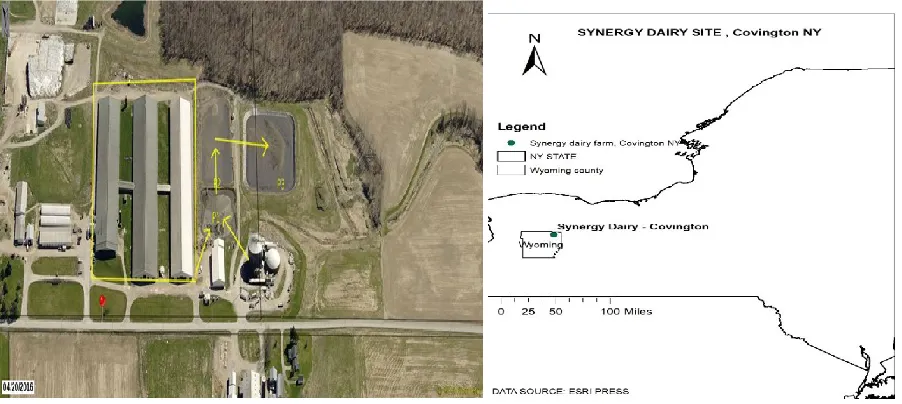
Figure 1.2: Synergy LLC site with a dug-out reservoir containing digestate and dairy waste
1.3.2 CASE STUDY 2: GREEK YOGURT, TOFU AND CHEESE WHEY
Two of the major leading brands of Greek yogurt, Chobani, and Fage are located in
upstate New York. This type of yogurt has most of the water and whey strained out, hence the
potential to generate high volumes of liquid waste to be treated (fig 1.3). By the year 2012,
Alpina had increased its production of the Greek yogurt from 24 million pounds to 123 million
pounds, and dairy farmers within New York State stand to benefit from the growing market
(Neuman, 2012). The market boom stems from the Yogurt industry’s reliance on milk from local
dairy farmers for their production. As New York State officials hint of welcoming larger
facilities for yogurt production, the most potentially sustainable way to handle and treat high
volume whey is through remediation with microalgae. Whey contains a high amount of organic
nitrogen due to its high protein content. At the time of this research, no concrete evidence was
published on the fate of organic nitrogen (Org-N) in the wastewater although there is speculation
7
growth (Huo et al., 2013). The research, thereofore, anticipates high Org-N and phosphate
removal from cheese and yogurt whey by the microalgae.
Cheese Whey
Cheese whey (fig 1.3) is also another major issue as the whey from production is equally rich in
lactose. It is estimated that every 1 kg of Feta cheese produced generates approximately 10 liters
of wastewater also high in BOD and Chemical oxygen demand (COD) (Trabold et al., 2011)
However, the whey containing lactose can be partly fed to Kluyveromyces marxianus, a unique
Yeast capable of producing ethanol from lactose fermentation (Hegde, Lodge, & Trabold, 2018).
Although high-quality whey from cheese can equally be processed into animal feed and food
additive, most of the whey ends up as an environmental nuisance which could be treated using
microalgae. In February 2015, the Yancy Fancy Cheese processing plant in Corfu, NY received a
$100,000 grant from National Grid to expand its facilities for managing excess whey as a
by-product from by-production (“Yancey’s Fancy,” n.d.). This research lab has conducted initial
parameters testing from sampled Cheese and Yogurt whey from Yancy Fancy® and Lively Run®
and found they contain high phosphate and nitrate above permissible levels of discharge. Cheese
whey showed 90.9 ppm and 33.0 ppm for nitrates and phosphate respectively thereby far
exceeding US EPA maximum allowable limits of 2.2ppm of Nitrates and 1.0ppm of phosphate
8
[image:17.612.82.487.110.242.2]A) Cheese and Tofu whey B) Greek Yogurt Whey- Alpina
Figure 1.3 Sampled Cheese and Tofu whey from Yancy Fancy and Northern Soy respectively
1.3.3 CASE STUDY 3: EGGWASH WASTEWATER
The poultry industry is no exception to businesses generating high nutrient wastewater.
Wastewater generated from eggwash (which contains detergent), meat processing, and cage
cleaning contains high levels of PO4, NO3, and fecal coliforms which might wash into nearby
surface waters. Kreher farms in Clarence NY is a conglomerate of poultry farms interspersed in
the Empire State and has adopted a more sustainable approach to compost most of its poultry
waste into fertilizers (“Kreher Family Farms - Compost & Fertilizer,” n.d.). However,
wastewater generated from egg processing facilities needs to be treated to reduce high nutrient
levels. Two different eggwash wastewater samples are currently being analyzed in our lab:- 1)
high detergent stream from the washing of eggs to remove coliforms 2) low detergent wastewater
generated from equipment and cage cleaning.
1.3.4 CASE STUDY 4: TOFU WASTEWATER
Northern Soy, Rochester NY produces organic Tofu and other products sold in Wegmans
9
and coagulated in tubs which are then passed through a belt press to squeeze the whey from the
tofu and boiled at 900C. Tofu whey can have Biochemical oxygen demand (BOD) as high as
18,000 ppm. . The study assessed and found high P and N levels among other parameters of
interest in sampled Tofu whey obtained from Northern Soy in Rochester, NY which results in a
frequent surcharge due to high BOD and nitrogen exceeding 300ppm. Also, general food
processing plants like tomato canneries, baked goods, milk, and oil processing exceed their
MDLs of 300ppm of BOD. Hence, managers of these production plants constantly pay a
surcharge to discharge into WWTPs.
1.4 SOME CURRENT TREATMENT TECHNOLOGIES AND LIMITATIONS
(a) POTWs (WWTPs): Various scientific disciplines have been working through
various technologies to effectively treat wastewater and recover high-value products in an
energy efficient manner. As mentioned earlier, POTWs currently remain our first point of
call to remediate and handle most liquid waste. However, high energy demands and
inefficiencies with their mechanical components (particularly aerators) have called this
procedure into question. A re-assessment of Spain’s WWTPs energy efficiencies after 18
years ranged from 5.3% to 16.1 % with efficiencies decreasing as facility ages
(Hernández-Sancho, Molinos-Senante, & Sala-Garrido, 2011a). In some cases, desired nutrient removal
efficiencies are not achieved, as effluents are partially treated and discharged, which could
still be deleterious to receiving ecosystems (Kontas, Kucuksezgin, Altay, & Uluturhan,
2004). Pollutant removal efficiencies could be as low as 45% -66%, thereby having the
potential to affect receiving waters through eutrophication (Kontas et al., 2004). Also,
WWTPs are limited in their ability to receive high nutrient waste and in some instances
10 (b) CONSTRUCTED WETLANDS (CW): Several scholarly works have explored
the possible utilization of both natural and constructed wetlands in wastewater remediation
efforts. Batavia and Red Creek WWTPs utilize constructed wetlands for nutrient reduction.
The use of common reeds to remove pesticide residues like Boscalid have proven
successesful (Papaevangelou, Gikas, Vryzas, & Tsihrintzis, 2017), as remediation of heavy
metals from livestock wastewater yielded great results with Phragmites australis even in the
presence of antibiotic residues from the farm. Although, constructed wetlands have the
natural capacity to remediate high-level P and N effluents, the degree of nutrient levels and
loading rates could defeat this purpose (White, 2007). There are instances where the USEPA
has also raised red flags on that continued reliance on Natural Wetlands for wastewater
remediation which could disrupt the ecosystem services provided by quality natural wetlands
(Bastian, Shanaghan, & Thompson, 1989)
(c) CO-DIGESTION FOR BIOGAS: In the case of agriculturally related waste
biomass, the US and highly industrialized nations have made significant efforts to co-digest
dairy manure and food grade organic waste in anaerobic digestors for methane production
while composting large portions of biomass for organic fertilizers. These technologies have
helped to reduce waste while enhancing clean energy through methane production.
However, digestates from these digesters are high in NH3, PO4, and NO3 that they can
neither be applied to land nor be channeled into public sewer systems and hence require
some form of pre-treatment before discharge (Mendonça, Ometto, & Otenio, 2017). It is also
necessary to carry out a detailed economic assessment to ensure constant and significant
11
operate. Installing Biodigesters for smaller farms seem to be economically conterproductive
unless strategically sited to serve a cluster of farms.
(d ) PHYSICO-CHEMICAL TREATMENT: This method has achieved some
level of successes in recent years where certain chemical compounds are used to coagulate
and flocculate pollutants in wastewaters. For instance, alum and ferric chloride could achieve
about 90% removal and decolorization in dye wastewater. However, this method is highly
affected by pH fluctuations, and the emergence of high metallic pollutants is seen (Teh,
Budiman, Shak, & Wu, 2016). Biopolymers like chitosan and Moringa olifeira (drumstick
tree) are non-toxic and recyclable, offering an environmentally friendly alternative to
chemical reagents.
(e) BIOLOGICAL TREATMENTS: Agro-industrial waste is mostly treated either
through aerobic or anaerobic means using microbial biofilms due to their high BODs, CODs
and Total Suspended Solids (TSS). However, these methods, especially Upflow Anaerobic
Sludge Blanket (UASB) and Anaerobic Filter (AF) which remove pollutants from
wastewater using anaerobic microbes are not economical to small and medium scale farms
due to their high energy demand and the requirement for high technical know-how (Labbé,
Ramos-Suárez, Hernández-Pérez, Baeza, & Hansen, 2017). A more improved method,
supplementing biological treatment with autotrophic algae, has proven to be successful with
as high as 98% removal efficiencies while producing high-value products for the agricultural,
pharmaceutical and the energy sector through through resultant biofuel feedstocks (Wang et
al., 2010). However, it is imperative to know that treatment efficiencies differ among
different algal species and lipid production is highly influenced by nutrient availability or
12 1.5 PROBLEM STATEMENT AND OBJECTIVES
Western New York and the Fingerlakes contain about 280 dairy and food
processing facilities (as of 2013) whose activities generate billions of dollars annually to the
State. However, large volumes of wastewater with various degrees of pollutants are generated
along the production chain which can neither go into POTWs nor be directly applied to land.
Moreover, attempts to haul wastewater to specialized waste facilities increases the cost of
production. It is, therefore, germane to have well functioning onsite treatment systems. This
research strives to explore different algal strains for their efficiency in treating various
food-based wastewaters and digester effluents in both laboratory food-based bioreactors and High Rate
Algae Ponds (HRAP) in field trials. Bioreactor based treatments involve the use of closed vessels
retofited with LED lights to treat wastewater under constant aerobic conditions where as HRAP
utilizes an open pond system to treat wastewater. The outcome could be a trailblazer for
sustainable agriculture through nutrient recovery and reapplication while serving as viable
feedstock for the biofuel industry.
1.5.1 HYPOTHESIS
Various nutrient-rich synthetic media have been documented to promote microalgae
cultivation effectively mainly due to the ability of microalgae to utilize the nutrients for growth
among other environmental factors and stressors, but synthetic media at the large scale is
expensive. Various types of wastewater can provide all the nutrients requirements for algae
growth resulting in a nutrient reduction of these waste streams. Also, nutrient uptake by algae in
a relatively shorter Hydraulic residence time (HRT) would conform to the periodic waste
13 1.5.2 SCIENTIFIC MECHANISM SUPPORTING THE RESEARCH
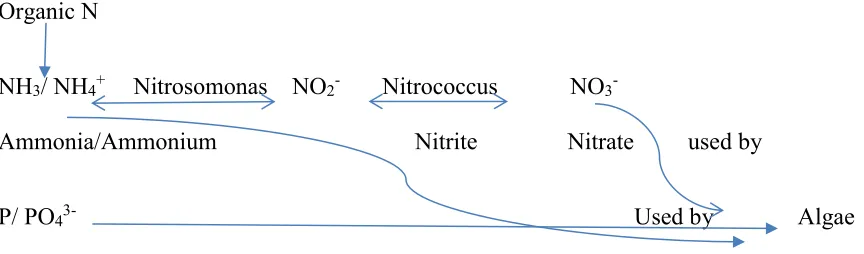
This research is underscored by the principle of the nitrogen cycle where ammonia and
nitogen oxiding bacteria catalyze the aerobic conversion of organic ammonia into nitrate which
is then readily utilized by primary producers (algae) for growth. The algae also can directly
utilize ammonium (NH4+) as seen in fig 1.4 under aerobic conditions without undergoing
[image:22.612.73.505.297.424.2]complete nitrification.
Figure 1.4 Pathways from nutrient availability to transformation until algae intake
Organic N
NH3/ NH4+ Nitrosomonas NO2- Nitrococcus NO3-
Ammonia/Ammonium Nitrite Nitrate used by
P/ PO43- Used by Algae
1.5.3 AIMS AND SPECIFIC OBJECTIVES
Aim: The primary aim of this research is to study the efficiencies of various algae to
efficiently remediate various waste streams in shorter HRT and explore their potential to be used
as biofuel feedstocks
Objectives:
• To test the nutrient reduction potential of various microalgae on different wastewaters
(ADE, eggwash, tofu, cheese, and yogurt whey)
14 • To harvest algae and extract lipids for thin layer chromatographic studies to profile
harvested algae for biofuel potential.
• To establish carbohydrate content in various algae biomass as the potential for
bio-ethanol
• To ascertain the potential of algae biomass for methane production through anaerobic
digestion
1.5.4 SIGNIFICANCE AND BROADER IMPACTS OF THE RESEARCH
Algal wastewater treatment technology would not only ensure that less polluted
effluents are released into streams, lakes or land but also contribute positively to sustainable
agriculture, energy conservation, climate change, water conservation, to mention a few. For
sustainable agricultural practices, biomass for algae treatment could be used as fertilizers to recylce
N and P back to soils. Also, algal treatment has been documented to yield exceedingly high
treatment efficiency compared to mechanical WWTPs at a rate of 96-99% as compared to the
latter’s 66-68% removal (Kontas et al., 2004). Since we can not take chances with or risk the
integrity of aquatic ecosystems with quasi-treated wastewater, supplementing WWTPs with algal
treatment as a tertiary level treatment would ensure environmental quality and sustain the health
of receiving waters. Continuous research and development in this area could augment WWTPs
with algal treatment and to mitigate the high energy demands from WWTPs (Hernández-Sancho,
Molinos-Senante, & Sala-Garrido, 2011). For industries, algal treatment technology will not only
15
significantly reducing pollutant levels to avoid fines and earn some federal tax credits for
environmental compliance.
Treated water could always be used for irrigation onto crop fields or reuse in manufacturing
industries for processes not requiring high water quality. The US is currently using Corn and
Soybean as feedstocks for biofuels, this over-reliance on food crops frequently leads to prices hikes
as well as food versus fuel competition in the market. The algae wastewater treatment could,
therefore, provide a sustainable replacement for staple crops as feedstock in the biofuels industry.
Climate change could be significantly minimized as cleaner fuels could be generated from
lipid-rich algae biomass, and industrial generated CO2 could be used for algae bioreactors for effluent
treatment. Last but not least, resultant algae biomass can e used directly as nutrient-rich organic
fertilizer for crop production thereby cutting down on the use of chemical fertilizers.
[image:24.612.72.523.433.635.2]1.6 METHODOLOGY
16 AlGAE STRAINS STUDIED:Chlorella vulgaris., Nostoc sp., Scenedesmus sp Anabena sp
were obtained from Ward’s Scientific®, Boyteroccocus sp.was obtained from the University of
Texas algae culture collection,and Web3 algae wereisolated from a primary clarifier of a
WWTP in Webster, NY. The above strains have been tested in our lab in the past and exhibited
higher longevity and robust in extreme wastewater environments.
1.6.1 ESTABLISHING BASELINE PARAMETERS
From fig 1.5 above, the aerial satelite imagery of Synergy-CH4 biogas facility shows
effluents flow pathways into storage lagoons using arrows. Wastewater from both digester and
dairy house are collected in Pond 1(P1) for gravity settling and later pumped into pond 2(P2) and
pond 3 (P3) Samples of digestate were taken from stabilization pond 3, and initial baseline
parameters were determined for Ammonia ( NH3), Phosphate (PO4), Nitrate (NO3), Nitrite
(NO2), Potassium (K), Salinity, pH, and Iron( Fe). Sampling was done at both peak (summer
2016) and off-peak times (spring 2016) of the year. Nutrient tests would be carried out using
Hach Pocket Calorimeter II kit 58700-40 for NH3, Hach PC II 58700-02 for NO3, Hach PC II
58700-06 for PO4. Fe and NO2 test were also determined with 0-1 mg/l IR-18A NJ1465-00 and
0-0.5 mg/l N1-15 21820-00 respectively. These Calorimeter kits can determine small to very
high concentrations of nutrients with high sensitivity and with approval by the USEPA and the
American Public Health Association (APHA). All pH measurements were made using an IQ
Scientific Instrument probe IQ240 preceded by standard calibration.
1.6.2 ALGAE CULTURING AND GROWTH STUDIES
Strains of algae to be cultured for inoculation includes Boytrococcus sp, Chlorella
17
obtained and cultured on synthetic Bristol salts prepared from stock solutions of (NaNO3,
KH2PO4, K2HPO4, MgSO4. 2H2O, CaCl2.2H2O, NaCl, FeCl3. 6H2O) diluted in distilled water for
small scale experiments and pond water for larger scale experiements. Stock solutions were
prepared by dissolving 10g NaNO3, 7g KH2PO4, 3g K2HPO4, 3g MgSO4.2H2O, 1g CaCl.2H2O,
1g NaCl in 400ml each of distilled water and 1g FeCl.6H2O in 100 ml distilled water. Portions
of stock solution were added in a 1:100 ratio of pond water or distilled water and placed on
Biomega® Magnetic stirrer for uniform mixing. Culturing was carried out in a 300ml Erlenmeyer
flask and later scaled up to a 2000ml glass jar photobioreactors under White, Blue, and Red LED
lights. Oxygen is constantly supplied to the system using 120V 60Hz 1.5 watts powered Whisper
10® aerators. In the process of culturing, growth rates of these species would be studied under
White, Blue and Red LED lights at pH of 7.1- 7.4 at room temperature for 5- 7 days. Growth
rates would be studied by taking 2ml of each set up at 2 –day interval and analyzing optical
densities with the Clinical Diagnostics® Spectrophotometer 554142.
1.6.3 PHOTOBIOREACTOR GROWTH
A 10% inoculum of freshly cultured Chlorella vulgaris is inoculated into 1500 ml of
1:5 or 1:10 Digester effluent-pond water dilutions under a bioreactor set-up with an adjusted
initial pH of 7.1-7.4. The reactor is then constantly aerated under a white LED powered 16:8
light-dark cycles while pH and other parameters of interest (NH3-N, NO3-N, NO2, Fe, PO4) were
monitored in 2-3 day intervals over 30 days. Aeration for the bioreactor was carried out using
01G38 or 01B36 Whisper 10® airpump. Occasionally, 300ml of the initial dilution ratio of the
Anaerobic digester effluents (ADE) may be added to revive the system’s depleted nutrients.
18
batch culture open treatment method. The entire cycle would be repeated with other algal strains,
[image:27.612.73.310.136.315.2]and other wastewater types like eggwash effluents, cheese, and yogurt whey. (Fig 1.6)
Figure 1.6 A Photo-bioreactor treatment set-up in the Lab
1.6.4 GREENHOUSE AND ON-SITE OPEN POND TREATMENT
Since laboratory conditions differ from ambient environmental conditions, it was
necessary to simulate treatment design in RIT’s greenhouse and in-the-field settings. A 2000ml
culture of Chlorella vulgaris or any other algae strain was added to 10L wastewater in a 15L
rectangular tank. It was necessary to dilute effluents to allow sufficient light penetration into the
system. Constant aeration is carried out for 5-7 days, after which the process may be scaled up
in the same ratio in a 50-gallon tank in the greenhouse. The necessary parameters were then
19
Figure 1.7 High Rate Algal Pond treatment at RIT's Green house and on-site. Treatment in a
50-gallon tank (Upper). Treatment in 15L basins (Lower left) and treatment in 1220-gal tank onsite
at Synergy LLC (Lower right)
For this research, a 1220 gallon tank was constructed onsite at Synergy Biogas in
Wyoming County to serve as a study site. An 80 gallon volume of algae would be cultured in the
Greenhouse and transported to site for use. To sustain a constant nutrient supply for algae
growth, NutriCote 13:13:13 in pond water were used for culturing. Transported algae would
then be inoculated into a 1220 gallon gallon tank with diluted ADE in batch culture with constant
aeration at a rate of 440L/m. Environmental conditions such as light intensity, temperature, wind
intensity, and humidity, and water depth would be monitored together with other parameters of
20 1.6.5 ALGAE BIOMASS HARVEST AND LIPID EXTRACTION
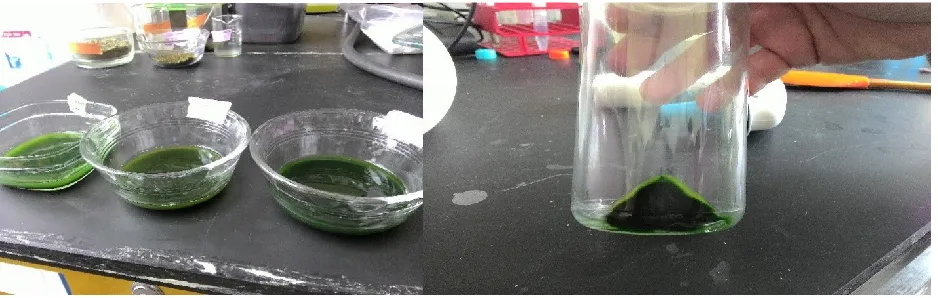
Centrifugation was used as the main harvesting technique for fully grown algae from the
treatment bioreactors. In open ponds and large-scale facilities, biomass may be harvested through
gravity settling induced by pH. Biomass from photobioreactors is centrifuged at 250C at 2500
RPM for 5 minutes with AllegraTM 6R ALR 03b254 Centrifuge from Beckman Coulter (fig 1.8).
Resultant pellets are collected and oven dried with VWR International® oven at 800C-900C for
[image:29.612.72.541.284.433.2]72 hours in glass bowls for the lipid extractions stage. Treated water is then discharged.
Figure 1.8 Harvested algae after centrifugation
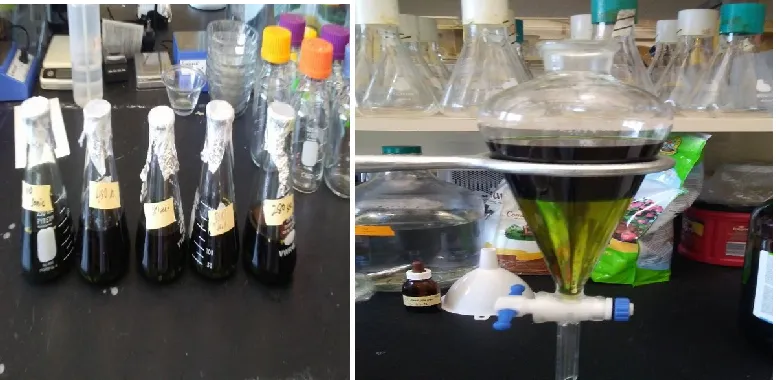
Lipid extraction from algae biomass is performed by crushing dried algae in a mortar and
pestle and the biomass is dissolved in a 3:2 hexane -isopropanol solvent. The mixture containing
20g of algae in 150 ml of hexane:isopropanol is shaken vigorously at 150rpm in an auto shaker
Max Q 4000 instrument from Barnstead Labline® for 24hours and filtered. The filtrate is added
to a separatory funnel, 40ml of hexane and 40ml distilled water is added. The addition of
hexane-distilled water is to form a two-phase system with the more denser isopropanol-water
layer at the bottom while a lipid-hexane layer is at the top (figure 1.9). Dissolved isopropanol in
21
placed in an evaporator. The isopropanol-water mixture was tested for triglycerides before
discarding to ensure no quantity of triglycerides was lost. Volatile hexane evaporates leaving
lipids in the beaker. In a commercial production situation, hexane may be reclaimed through
distillation apparatus for reuse.
1.6.6 ULTRASONICATION OF ALGAE CELLWALLS
Algae biomass disruption was tested using ultrasonication techniques to disrupt cell
walls with the aim of maximizing lipid yield from algae cell walls. Algae were exposed to
different magnitudes ( 0, 180, 280, 380, and 480 secs) of sonic waves in an attempt to break
open cell walls before lipid extractions. A second experiment treated biomass longer sonication
times ( 480, 960, 1440 secs) using a 160W Aucma ultrasonic device SU-767 from Intertek® and
their effects on lipid yields compare (Fig 1.9)
[image:30.612.73.461.444.634.2]A) Sonicated Biomass B) Hexane-isopropanol extraction of lipids
Figure 1.9: Lipid extraction from sonicated algae biomass using organic solvents
22 1.6.7 THIN LAYER CHROMATOGRAPHY (TLC)
Thin Layer chromatography was used to assess the quality of lipids extracted from the
algae biomass for biodiesel. TLC analysis is used to separate non-volatile lipids into its
constituents using a TLC Silica gel F254 (5 X 20cm) plates obtained from VWR Wheaton. The
goal of this step is to assay the composition of algae lipids especially its triglyceride to FFA
content. Lipids may be composed of free fatty acids (FFA), monoglycerides, diglycerides and
triglycerides which may influence the quantity and quality of ester formation into biodiesel. For
TLC analysis, the solvent was 85:15:2 (hexane: ethyl ether: glacial acetic). Lipids were then
dissolved in small amount of solvent. An origin is made at 2cm length on the plate, and a 2µL-
8µL of the sample is spotted at the origin and allowed to dry. The silica plates were placed in the
developing tank containing 100ml of the solvent after 20 minutes of equalization and allowed to
run for as long as 1 hour such that the solvent travels ¾ of the distance of the TLC plates. The
plate is then air dried and sprayed with a detection spray made of 10g of CuSO4 dissolved in
10% phosphoric acid. After drying, the plate is then placed a Napco® Vacuum Oven 952 at a
pressure of 18-20 Hg for 10 minutes at a temperature of 90-1000C to char the lipids.
1.6.8 CARBOHYDRATE EXTRACTION- QUALITATIVE AND QUANTITATIVE
Algae biomass does not only contain lipids but is also rich in carbohydrates which can
be extracted and fed to yeast to produce Bio-ethanol. 20g of lipid extracted algae is added to the
250ml flask and 100ml of 2% sulfuric acid is added. The mixture is then placed in an oven at
105 0C for 4-8 hours after which it is allowed to cool. Residual algae are separated from the
23
filtrate collected is then quantified as described below and the remaining algae biomass can be
composted or added to a biodigester to boost methane production.
QUANTIFICATION OF SUGARS FROM ALGAE BIOMASS
A 0.4 ml of a 1:1000 dilution of the Carbohydrate extract is placed in a test tube and
mixed with 0.4ml of 5% phenol, 2.0 ml of concentrated H2SO4 is then added to the mixture
which results in orange coloration. The mixture is read at 490nm wavelength upon cooling using
Clinical Diagnostics Spectrophotometer 554142, with 0.4ml distilled water instead of
carbohydrate sample to serve as a blank. The value obtained is then compared to a standard
curve to obtain the concentration of the carbohydrate. The standard curve was made using pure
glucose at 2%, 4%, 6%,8% and 10% which were taken through the same procedure and their
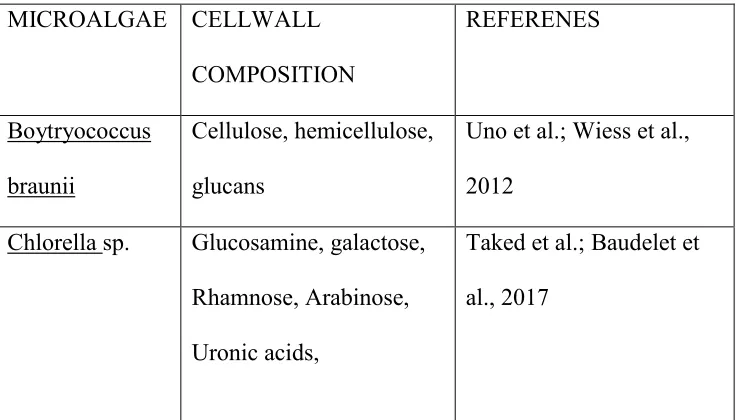
respective absorbence recorded at 490nm. Table 1.1 shows some selected algae and qualitative
[image:32.612.74.442.469.679.2]analysis of their cell wall constituents.
TABLE 1.1 Representative algae and their cell wall composition
MICROALGAE CELLWALL
COMPOSITION
REFERENES
Boytryococcus
braunii
Cellulose, hemicellulose,
glucans
Uno et al.; Wiess et al.,
2012
Chlorella sp. Glucosamine, galactose,
Rhamnose, Arabinose,
Uronic acids,
Taked et al.; Baudelet et
24
rhamnopyrnose,
glycopyranurosyl
Scenedesmus
spp.
Hydrocarbons,unsaturated
fatty acids, glycoproteins,
carboxyl groups, neutrl
sugars, uronic acids
Allard et al, 2002
Voigtet et el 2015
Nostoc sp. Rhamnose, mannose,
galactose , glucose A
Delattre et al 2016
1.6.9 FERMENTATION OF ISOLATED ALGAE CARBOHYDRATE BY
SACCHAROMYCES AND KLUVEROMYCES
To test whether algae sugars can be fermented by yeast to produce bioethanol, extracted
sugars were fed to Kluveromyces marxianus and Saccharomyces cereviciae, ethanol producing
yeast strains. Seed cultures were made by adding 50ml of SAB into a sterilized 250ml flask and
adding a loopful of yeast cells and then shaken for 1-2 days in MaxQ 4000 auto shaker at room
temperature. 5.0ml each of culture is centrifuged and suspended in 5.0ml of sterile saline
(0.9%NaCl). 5ml of Saccharomyces and Kluveromyces is cells are added to 45ml of extracted
sugar in a 250 ml flask, and the fermentation is run at room temperature and shaken at 130 rpm.
To test whether the additional protein is required for the yeast fermentation, 0.5g of peptone is
25
TABLE 1.2 YEAST FERMEMNTATION PROCESSES
FLASK CELLS Amount of cells/
ml
Amount of
carbos/ml
Peptone in
grams
A Kluveromyces 5.0 50.0 0.5
B Saccharomyces 5.0 50.0 0.5
C Kluveromyces 5.0 50.0 0
D Saccharomyces 5.0 50.0 0
E No yeast ( control) 0 50 0
Each culture is shaken at room temperature and 1.5ml of each culture including the
control, removed roughly 3-4hr intervals for 33 hours. Each sample is centrifuged in microfuge
tubes for 5 minutes at 13000 rpm using the VWR® Galaxy 16 C0170. 1 ml of supernatant of
each tube is removed and diluted with 1000 parts of distilled water. Carbohydrate concentration
was determined using already descried process above. The value is then compared to a
pre-existing standard curve to determine the concentration of carbohydrates. A graph for
26
1.6.10. BIOCHEMICAL METHANE POTENTIAL
The Biochemical methane potential (BMP) is a standard method for testing substrates in
small scale anaerobic digesters. Algae biomass was co-digested with dairy manure.
Microcrystalline cellulose with 20-µm (Sigmacell type 20) used as a positive controls sample for
system testing. The inoculum was obtained from a full-scale anaerobic digester operated at
mesophilic temperatures that co-digested dairy manure with food related waste. The inoculum
was pre-incubated at 370 C for 5 days to minimize gas production from undigested biomass.
Samples were prepared to achieve an inoculum-to- substrate ratio (ISR) of 1:2 (gVS inoculum:
gVS substrate added) to prevent biomass limiting kinetics. The total solids content of all samples
was less than 3% in prepared samples, and the dairy manure inoculum provided nutrient
requirements for anaerobic microorganisms. No additional external nutrients or elements were
added, and the average pH range for the entire process was between 6.9 for the initial feedstock
to 7.9 after the process run to completion. Feedstocks were flushed with N2 to create an
anaerobic environment and incubated at 370C with mixing rate at 10 sm-1. The 500ml BMP
vessels were used with working volumes ranging between 300-400ml. Biomethane production
from substrates, blanks, and controls were all operated under standard temperature and pressure
of 00C and 1 atm respectively. The BMP assay was conducted for 33 days after which
biomethane production climaxed. All samples and blanks (only inoculum) were run in triplicate,
and actual Bio-methane production was obtained after subtracting values of the blank the
27
300 ml culture
SCALED UP ALGAE Bioreactor treatment
FIGURE 1.6.11.: Algae culture to waste treatment
From fig 1.10, startup cultures were initiated in 500ml vessels or conical flasks which is later scaled up to 1.5L in 2L vessels using Bristol salts as growth medium. Matured algae cultures were added to wastewaters in a 1:10 ratio (algae: waste). For field trials, cultures were scaled up in 60 gal tanks in the greenhouse which is later transported to the site to be applied onto agricultural wastewaters. Biomass from treatment tanks was harvested and brought to the lab for further analysis.
2L cultures in bioreactor vessels
Cultures scaled up in 30
gal tanks in Greenhouse High rate algae pond with
300gals of wastewater Dry algae biomass centrifuged
28 CHAPTER TWO
ANALYSIS OF THE DIFFERENT WASTE STREAMS
2.1 BASELINE CHARACTERIZATION OF THE DIFFERENT WASTEWATERS
It was imperative to ascertain the various pollutant levels in the AD digestate and other
wastestreams before treatment. Initial site visits, sampling, and analysis of ADEs from all three
stabilization lagoons located on-site at Synergy CH4-biogas were carried out. Concentrations of
ammonia, nitrate, nitrite, Iron, and pH were determined using the Hach test kit if the needed
samples were diluted with distilled water to be in the proper range of test kits. The pH probe was
calibrated daily within ranges of 7.0- 10.5 before pH readings for quality assurance.
Table 2.1 Concentrations of various parameters of digester effluents from Synergy’s three storage lagoons
ANAEROBIC DIGESTER EFFLUENTS
NH3 ppm NO3 ppm NO2
ppm
PO4
ppm
Fe
ppm
storage lagoon 1 2145 0 0 330 553
storage lagoon 2 1922 0 0 330 393
Storage lagoon 3 1789 0 0 318 190
Table 2.1 shows, high ammonia levels between 1700 ppm-2000 ppm were recorded as
compared to phosphate and Iron which shows concentrations of 300 – 400 ppm. However, all
29
0.3 ppm for phosphorus and Iron respectively which justifies the need for urgent remediation.
(“USGS Fact Sheet 2010–3078: Nutrients in the Nation’s Streams and Groundwater: National
Findings and Implications,” n.d.). Although the USEPA has not establiahed clear cut-off
concentrations for these nutrients, it has recommended limiting nitrate in discharged effluents to
10ppm and a near zero tolerance for phosphorus as these nutrients are triggers for harmful algal
blooms. From the Table 2.1, there is absence of Nitrates (NO3) and Nitrites(NO2), but high
ammonia (NH3) is a cause for concern as ammonia can be nitrified to nitrate to cause
eutrophication in waters. In addtion, successive gravity settling from lagoon 1 to lagoon (3) has
little to no impact on nutrients concentrations but rather on Total Suspended Solids (TSS). This
research, therefore, focused on treating lagoon three effluents due to its reduced TSS, less murky
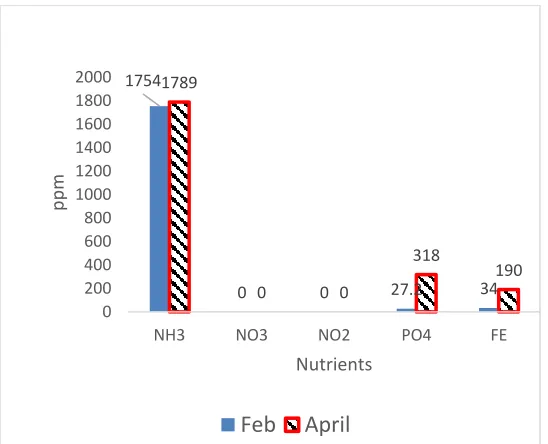
[image:38.612.72.346.383.605.2]which otherwise, could cause photo-inhibition during treatment processes.(Fig 2.1)
Figure 2.1 Nutrient variations in lagoon 3 between February and April of 2016
1754
0 0 27.2 34
1789
0 0
318
190
0 200 400 600 800 1000 1200 1400 1600 1800 2000
NH3 NO3 NO2 PO4 FE
ppm
Nutrients
30
Figure 2.1 goes a step further to access how nutrients vary over time between February to April 2016 within Synergy’s lagoon 3 ADE. While there was no significant difference in NH3
[image:39.612.70.513.221.575.2]concentration, PO4, and Fe concentrations were higher in April compared to February.
TABLE 2.2 CHARACTERIZATION FOR VARIOUS WASTEWATER TYPES SAMPLED FROM PARTNER
INDUSTRIES
EFFLUENT
PARAMETER
USEPA
STANDARDS
A.DE FETA
CHEESE WHEY TOFU WHEY EGGWASH + DET EGG WASH WASTEWATER GREEK YOGURT WHEY AMMONIA (NH3) in ppm
1.9 mg TAN/L
(EPA 2015)
1789 49.8 60.5 335 1037 28.47
NITRATES (NO3-) in ppm
10 ppm (EPA
2018)
0 82.9 33.8 308 792 30.8
PHOSPHATES (PO4-2) in ppm
< 0.1 ppm 318 33 15.3 23 350 13.2
Nitrite (NO2-)
in ppm
1ppm (EPA
2018)
0 0 0 0 0 0
Iron (Fe) 0.4ppm (USEPA 2015)
190 7.2 2.6 0.3 45 0.73
pH 6.0-90 9.29 4.65 4.3 8.47 6.45 4.16
Hardness (Caco3)
<60ppm 4000 - - - - -
Salinity in ppt <1200 ppt in drinking water
and <3000ppt
in fresh water
(epa.gov 2018)
30 - - - - -
From Table 2.2, higher than acceptable concentrations of nitrate nitrogen (NO3-N) in
both eggwash wastewater types were recorded. 300ppm and 780ppm were recorded in
detergent and detergent free egg wastewater respectively. Tofu, Yogurt, and Feta cheese whey all
recorded some level of nitrate between 30-80 ppm, but ADE showed no nitrates. Phosphate was
31
other wastewater types recorded relatively lower phosphate levels with a range between 13-35
ppm. Nitrate and phosphate are major plant nutrients. Hence, exceedingly higher concentrations
in discharged effluents could cause eutrophication and uncontrolled algal growth in receiving
waters. Significant Iron levels were observed in egg wastewater without detergent and ADE as
other wastewater types showed negligible amounts. Although there is no definite toxicity from
Iron in the environment, concentrations betweeen 5- 200 mg/l aqeuous Fe concentration may be
fatal to plant communities (“Iron (Fe) and water,” n.d.).
2.2 MICROBIAL DIVERSITY IN ADE WASTEWATER
Pretreatment analysis of ADE effluents was extensive to include assesssment of
microbial community on the wasewater. Microbes play a critical role in nitrification and break
down of organic matter during treatment under both aerobic and anaerobic conditions. In one
study, microbial granules were used to treat abattoir wastewater which caused a reduction in
phophorus by 97% (Lemaire, Webb, & Yuan, 2008). Tryptic Soy Agar is commonly used to
enumerate heterotrophic populations in soils, water, and wastewater.
2.3 DISCUSSION OF RESULTS
2.3.1 SYNERGY’S A.D.E
Assessment of pollutant levels in digestate from Synergy’s three storage lagoons all
exceeded the permissible limits for any wastewater treatment plant in New York state. Ammonia
ranged between 2145 ppm in storage pond 1 to 1789 ppm in the lagoon (3) which meant
discharge through WWTPs for treatment was not possible. High ammonia resulted from excreta
discharging directly from the dairy farm into lagoon 1. According to the farm owner and manager
32
production (personal communication, 2nd December 2017). This revelation implies that the bulk
of the dairy waste is directly discharged and stabilized in storage lagoon 1. Although total
ammonia concentration is dependent on conditions like pH, temperature and moisture, treating
manure waste in Anaerobic digester had been documented to significantly increase ammonia
concentrations and volatilization (Evans et al., 2018). High ammonia levels disrupt local air
quality and can be toxic to aqautic life through acidification and eutrophication in waters, whereas
low concentrations in soil and water could also be beneficial for nutrient cycling. Synergy Biogas
receives different foodgrade waste from Foodlink, surrounding restaurants and other food
industries in Western New York which could contribute to the presence of high phosphorus and
Iron in the digestate. Also, digester conditions like pH variations, moisture, and temperature,
could all result in the High PO4 (318-330ppm) and Fe ( 190- 553 ppm) levels. No nitrate nitrogen
( NO3-N) and nitrite (NO2-N) were recorded in the digester effluents.
Intermittent qualitative and quantitative analysis of the digestate carried out over the
Winter, Spring, Summer, and Fall of 2016 continued to reveal higher than normal levels of NH3,
Fe, and PO4 but no nitrates which are characteristic of the type of waste constantly fed to the
digester. Although seasonal variations for NH3 was not signifiant as shown in Fig 2.1, variations
in PO4 and Fe were significant. These variations could result from the diverse biodegradable
waste fed to the digester in addition to the roller coaster operational behaviour of the digester
during peak and off-peak times. Similarly, high Iron (Fe) content in digestate could stem from the
possible use of FeO or Fe(OH)2 coated woodchips as solid scavengers for hydrogen sulphide
33
Gravity sedimentation across the three storage ponds caused slight reductions in NH3, and PO4
levels but signifiantly reduced Fe levels by 65%. The Fe could have precipitated and be
sequestered into solids removed through gravity settling. Stabilizing effluents in storage ponds is
a primary treatment technique used to reduce BODs and TSS drastically. The pH of the digestate
ranged from 8.5- 9.2 which favors microbial communities expediting the nitrification process
during treatment. Ammonia nitrogen was the predominant nitrogen type in the ADE before
treatment representing total kejeldahl nitrogen (TKN) of 1789 ppm which was high enough to
intoxicate and cause eutrophication in receiving waters bodies if untreated.
2.3.2 FETA CHEESE, TOFU, AND GREEK YOGURT WHEY
Whey from cheese, yogurt, and tofu are generated in high volumes along the production
chain of which a fraction is channelled to Synergy’s Anaerobic digester to boost methane
production. Other conversions to animal feed and bioethanol as a clean fuel source are also
currently being explored (Hegde et al., 2018), but a large fraction of whey from these processes
remains an environmental issue. Also, transport of whey to digester facilities incurred additional
production cost. The study carefully analyzed the different whey seperately to ascertain their
potential to serve as growth media for algae cultivation and subsequent remediation. Nitrate-
nitrogen (NO3-N) was detected to be 82.9 ppm in cheese whey and relatively lower in Greek
yogurt, and tofu whey is showing approximately 31 ppm and 34 ppm respectively. Nitrate in the
different Whey all exceeded US EPA levels for discharge into waters, and their low pH (4.1-4.7)
rendered them unsuitable to be channelled into POTWs. Wastewater treatment plants operate
within a stringent pH range of 6.0- 9.0 for which the whey could cause pH imbalances and hence
disrupt treatment efficiencies. Total Kejeldahl nitrogen (TKN) across the three different whey was
34
found to be 133mg/l for cheese, 60mg/l for greek yogurt and 95mg/l for Tofu. Total nitrogen in
the different whey can be used as growth media for algae to reduce nitrates levels to permissible
levels for discharge. Phosphate levels in the three different wheys were approximately 33ppm,
16ppm, and 14ppm for cheese, tofu, and greek yogurt. These figures far exceed allowable limits
for discharging wastewater which needs to be remediated. The acceptable limits for total
phosphate-phosphorus (Total PO4-P) for any fresh water systems are at 0.1mg/L above which
accelerated eutrophication would be inevitable (“Lead, Plumbosolvency, and Phosphates in the
Environment,” 2016). Microalage are capable of utilizing the phosphorus in the whey to levels
which can then be applied to soils for irrigation and fertilizer without risking the health of surface
and ground waters.
2.3.3 EGGWASH WASTEWATER
Both eggwash with (EW+det) and without detergent (EW) were sampled from Kreher
Farms and characterized which showed high levels of kejeldahl nitrogen (TKN) of 335ppm and
1037 ppm respectively. Also, Nitrate-nitrogen for EW+det and EW were determined to be 308
ppm, and 792 ppm respectively bring total nitrogen in both wastewater types to 643ppm and 1829
ppm respectively. The total nitrogen in both wastewater types makes them sustainable media for
microalgae growth while remediating the eggwash wastewater. Moreover, phosphate phosphurus
(PO4-P) recorded for EW+det was 23 ppm as compared to 350ppm for EW, therfore, rendering
both effluent types inappropriate for direct discharge. Nutrient levels in EW were significantly
higher than that of EW+det due to the former resulting from the first phase of washing and
cleaning of farm equipment. Daily routine cleaning in the pens and coop which contains debris
35
nitrogen (TKN) and phosphate in EW than EW+det. However, detergent usage for second phase
cleaning of egg processing facilities resulted in high pH (8.47) for EW+det over that of EW (6.45)
although both effluent types had pH values within regulatory limits of 6.0-9.0.
Fe recorded in EW was excessively high (45mg/l) and exceeded USEPA limits of
2.0mg/L as compared to 0.3 mg/l for EW+det. While the cause of high iron (Fe) content in the
former remains unknown, wear-out of older machinery parts with other management pratices
could contribute to the high Iron content. Over 75 % of egg processing facilities in the US utilize
about 4.4gals/min of fresh water in eggwashing, and most farms and egg processing facilities
regularly suffer closure by the USEPA due to their inability to meet regulatory discharge
requirements (Northcutt, Musgrove, & Jones, 2005). Hence, The implementation of the algal
treatment technology could be a relief to the poultry industry through pollution reduction and
water recycling back to processing plants.
2.3.4 MICROBIAL DIVERSITY
The ADE effluents sampled from Synergy-CH4Biogas was qualitatively and
quantitatively assayed for their microbial diversity. TSA plates which are non restrictive and non
selective contain an array of nutrients wide enough to enable a diversity of bacterial populations
to grow. Higher TSA counts are indications of this diversity and associated role in wastewater
treatment. Relatively high counts for TSA show the presence of heterotrophic bacteria population
which play a critical role in nutrient transformation and CO2 production for the algae (Table 2.3).
Microbial diversity is good for nutrients transformation and BOD reduction through various
microbiological activies. For instance, lithotrophic bacteria play a critical role in NH3-NO3
36 Table 2.3 Bacterial culture counts in ADE
10-6 10-5 10-4 10-3 10-2
D0 TSA* 2 9 87 TNTC* TNTC
D3 TSA 1 12 191 TNTC TNTC
D7 TSA - - TNTC TNTC TNTC
TSA = Tryptone Soya Agar *TNTC = Too numerous to count
2.4 CONCLUSIONS
From the above analyses, it can be deduced that all the effluents types analyzed have
shown concentrations extrememly above that which can be directly discharged hence the need for
remediation efforts. Digester effleunts and egg wastewater contained high ammonia and Fe levels
where as the different whey all exhibited high N and P with low pH. Also, microbial diversity in
the biodigester effleunts is generally helpful for biological treatments of the wastewater.
CHAPTER THREE
3.1 PRELIMNINARY ALGAE GROWTH STUDIES ON WASTEWATER
Intitial growth studies were carried out, and cell densities were measured at 680nm. Fig
3.1A shows Web3 microalgae growing under different light spectra on synthetic bristol salts as
medium. Full spectrum white light maximized growth compared to blue and red lights
individually. Fig 3.1b below further investigated the potential of egg wash wastewater to be used
as growth media for algae cultivation and treatment purposes. Significant growth densities were
recorded for four different algae with Botyroccocus sp exhibiting the highest growth and