METHOD DEVELOPMENT AND VALIDATION OF NEWER
ANALYTICAL TECHNIQUES
Ph.D. thesis Submitted to
The Tamil Nadu Dr. M.G.R. Medical University,
Chennai - 600 032, Tamilnadu, India.
In partial fulfilment for the award of Degree of
DOCTOR OF PHILOSOPHY
(Faculty of Pharmacy)
Submitted by
G. ABIRAMI, M.Pharm.
Under the Guidance of
Dr. T. VETRICHELVAN, M.Pharm., Ph.D.
Principal and Head
(Department of Pharmaceutical Analysis)
ADHIPARASAKTHI COLLEGE OF PHARMACY
(Accredited by “NAAC” with CGPA of 2.74 on a four point scale at “B” Grade)
MELMARUVATHUR – 603 319
DECLARATION
I hereby declare that the thesis entitled
“METHOD DEVELOPMENT
AND VALIDATION OF NEWER ANALYTICAL TECHNIQUES”
submitted
by me, as a partial fulfilment for the award of Degree of Doctor of Philosophy
(Faculty of Pharmacy) is a record of research work done by me during 2008 to
2013, under the guidance and supervision of
Dr. T. VETRICHELVAN,
M. Pharm, Ph.D.,
Head and Principal of Adhiparasakthi College of Pharmacy,
Melmaruvathur, TamilNadu, India, and has not formed the basis for the award of
any other degree, diploma, associateship, fellowship or any other similar title to any
other university or similar institute of higher learning.
Place: Melmaruvathur
Mrs. G.ABIRAMI, M. Pharm.,
Date:
Assistant Professor,
CERTIFICATE
This is to certify that the thesis entitled
“METHOD DEVELOPMENT
AND VALIDATION OF NEWER ANALYTICAL TECHNIQUES”
submitted
to The TamilNadu. Dr. M.G.R. Medical University, Guindy, Chennai-600032,
TamilNadu, India as a partial requirement for the award of Degree of Doctor of
Philosophy (Faculty of Pharmacy) is a record of research work done by
Mrs
.
G.ABIRAMI, M. Pharm.,
during 2008 to 2013, under my guidance and
supervision at Adhiparasakthi College of Pharmacy, Melmaruvathur, TamilNadu,
India and that the thesis has not formed the basis for the award of any other degree,
diploma, associateship, fellowship or any other similar title to the candidate and the
thesis represents independent work of the candidate.
Place: Melmaruvathur
Prof. Dr. T. VETRICHELVAN, M.Pharm., Ph.D.,
Date:
Principal,
ACKNOWLEDGEMENT
It gives me immense pleasure to acknowledge, the help rendered to me by
a host of a people, to whom I owe gratitude for successful completion of Ph.D. First
and foremost, I wish to express my deep sense of gratitude to his Holiness
ARULTHIRU AMMA,
President, ACMEC Trust, and Melmaruvathur for his ever
growing blessings in each step of the study.
I am grateful to
THIRUMATHI LAKSHMI BANGARU ADIGALAR,
Vice President, ACMEC Trust, Melmaruvathur for having given me an opportunity
and encouragement all the way in completing the study.
The research work embodied in dissertation has been carried out under
supervision of my esteemed and most respected guide
Prof. (Dr.) T.
VETRICHELVAN, M.Pharm., Ph.D.,
Principal and Head, Department of
Pharmaceutical Analysis, Adhiparasakthi College of Pharmacy, my greatest debt of
gratitude is to him for their continuous encouragement, valuable suggestions,
dynamic guidance, eve readiness to elucidate problems a source of inspiration and
constant motivation throughout the dissertation work.
I express my deep sense of gratitude to respected
Prof. (Dr.) P.Perumal,
M.Pharm., Ph.D.,
and
Prof. (Dr.) G.Krishnamoorthy M.Pharm., Ph.D.,
Doctoral committee members for their support for the research work.
I conceitedly take the dispensation to present my special wisdom of thanks
Pharmacy, Melmaruvathur, for their valuable help and guidance during the course
of my research work.
I acknowledge the help and support rendered by our laboratory staff members
Mrs. S. KARPAGAVALLI, D.Pharm., Mr. M.GOMATHISHANKAR, D.Pharm.,
Mrs. S.SHOBANA B.Sc., throughout my project work.
I am indeed very much thankful to the librarian
Mr. M. SURESH, M.L.I.S.,
Adhiparasakthi College of Pharmacy, for providing all reference books and journals
for the completion of this project.
A word of thanks to office staffs
Mr. S.ELUMALAI, Mr. M.
KARTHIKEYAN
and other members of our college for providing all the help
when required.
I wish to regard my heartfelt thanks to
Mr. M.THIRUGNAM B.Sc., Senior
Analyst, A.M.RAVISANKAR B.Sc.,
Senior Analyst,
Pharma Analytical Lab, at
Pondicherry to carry out the project work.
I wish to thanks
Mrs. NIRMALA M.Pharm.,
Lecturer, Vel’s University
Pallavaram to carry out the project work
I express my deep love and sincere sense of gratitude to my father
Mr. R.GANESAN
my beloved mother
Mrs. G.THAILNAYAKI,
my Husband
Mr. N.S.ASHOK KUMAR
for their support, guidance, inspiration and constant
prayers for my successful endeavors.
DEDICATED
TO MY
CONTENT
SECTION TITLE Page No.
1. INTRODUCTION 1-24
1.1 Basic criteria for new method development of drug analysis 1
1.2 UV spectrophotometry 2
1.3 Chromatographic method (RP-HPLC) 5
1.4 HPTLC 8
1.5 Method Validation 14
1.6 Basic Statistical Parameters 20
2. LITERATURE REVIEW 25-82
2.1 Drug Profile 25
2.2 Reported Methods 54
3. AIM AND PLAN OF WORK 83-86
3.1 Aim of Work 83
3.2 Plan of Work 85
4. MATERIALS AND METHODS 87-136
4.1 Materials 87
4.2 Methods 91
4.2.1.1 UV Spectroscopy 92
4.2.1.2 HPLC 96
4.2.1.3 HPTLC 103
4.2.2.1 UV Spectroscopy 107
4.2.2.2 HPLC 110
4.2.2.3 HPTLC 116
4.2.3.1 UV Spectroscopy 121
4.2.3.2 HPLC 124
4.2.4.1 UV Spectroscopy 131
4.2.5.1 UV Spectroscopy 134
5. RESULTS AND DISCUSSION 137-169
5.1.1 UV Spectroscopy 137
5.1.1.1 Simultaneous Equation Method 137
5.1.1.2 Absorption Ratio Method 140
SECTION TITLE Page No.
5.1.1.4 Derivative Spectroscopy Method 143
5.1.2 High Performance Liquid Chromatography 145
5.1.3 High Performance Thin Layer Chromatography 147
5.2.1 Derivative Spectroscopy Method 149
5.2.2 High Performance Liquid Chromatography 151
5.2.3 High Performance Thin Layer Chromatography 154
5.3.1 Derivative Spectroscopy Method 155
5.3.2 High Performance Liquid Chromatography 157
5.4.1 UV Spectroscopy 160
5.4.1.1 Absorption Ratio Method 160
5.4.1.2 Derivative Spectroscopy Method 162
5.5.1 UV Spectroscopy 164
5.5.1.1 Simultaneous Equation Method 164
5.5.1.2 Area Under Curve Method 166
5.5.1.2 Derivative Spectroscopy Method 168
6. SUMMARY AND CONCLUSION 170
7. IMPACT OF THE STUDY 174
8. APPENDIX
Figures
Tables
Copies of research article
9. BIBLIOGRAPHY
LIST OF FIGURES
FIGURE
No. SUBJECT
1 IR SPECTRUM OF TOLPERISONE HYDROCHLORIDE
2 IR SPECTRUM OF PARACETAMOL
3
OVERLAID SPECTRUM OF TOLPERISONE HYDROCHLORIDE AND
PARACETAMOL
4
FIRST ORDER DERIVATIVE SPECTRUM OF TOLPERISONE
HYDROCHLORIDE AND PARACETAMOL
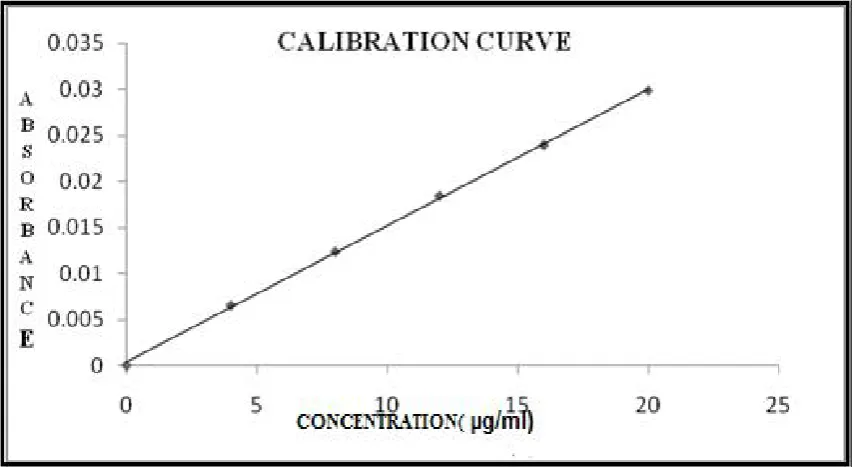
5
CALIBRATION CURVE OF TOLPERISONE HYDROCHLORIDE AT 261
nm (SIMULTANEOUS EQUATION METHOD)
6
CALIBRATION CURVE OF TOLPERISONE HYDROCHLORIDE AT 243
nm (SIMULTANEOUS EQUATION METHOD)
7
CALIBRATION CURVE OF PARACETAMOL AT 261nm
(SIMULTANEOUS EQUATION METHOD)
8
CALIBRATION CURVE OF PARACETAMOL AT 243 nm
(SIMULTANEOUS EQUATION METHOD)
9
CALIBRATION CURVE OF PARACETAMOL AT 254 nm
(ABSORBANCE RATIO METHOD)
10
CALIBRATION CURVE OF TOLPERISONE HYDROCHLORIDE AT
254 nm (ABSORBANCE RATIO METHOD)
11 FIRST ORDER DERIVATIVE UV SPECTRUM OF PARACETAMOL
12
FIRST ORDER DERIVATIVE UV SPECTRUM OF TOLPERISONE
HYDROCHLORIDE)
13
CALIBRATION CURVE OF TOLPERISONE HYDROCHLORIDE AT 253
FIGURE
No. SUBJECT
14
CALIBRATION CURVE OF TOLPERISONE HYDROCHLORIDE AT 254
nm - 267nm ( AREA UNDER CURVE METHOD)
15
CALIBRATION CURVE OF PARACETAMOL AT 253 nm – 269 nm
(AREA UNDER CURVE METHOD)
16
CALIBRATION CURVE OF PARACETAMOL AT 274 nm – 284 nm
(AREA UNDER CURVE METHOD)
17
RP-HPLC LINEARITY CHROMATOGRAM OF TOLPERISONE
HYDROCHLORIDE AND PARACETAMOL (2 g/ml + 4 g/ml)
18
RP-HPLC LINEARITY CHROMATOGRAM OF TOLPERISONE
HYDROCHLORIDE AND PARACETAMOL (4 g/ml +8 g/ml)
19
RP-HPLC LINEARITY CHROMATOGRAM OF TOLPERISONE
HYDROCHLORIDE AND PARACETAMOL (6 g/ml +12 g/ml)
20
RP-HPLC LINEARITY CHROMATOGRAM OF TOLPERISONE
HYDROCHLORIDE AND PARACETAMOL (8 g/ml +16 g/ml)
21
RP-HPLC LINEARITY CHROMATOGRAM OF TOLPERISONE
HYDROCHLORIDE AND PARACETAMOL (10 g/ml +20 g/ml)
22
CALIBRATION CURVE OF TOLPERISONE HYDROCHLORIDE BY
RP-HPLC METHOD
23 CALIBRATION CURVE OF PARACETAMOL BY RP-HPLC METHOD
24 ANALYSIS OF FORMULATION -I
25 ANALYSIS OF FORMULATION - 2
26 ANALYSIS OF FORMULATION - 3
27 CHROMATOGRAM FOR 80% RECOVERY ANALYSIS
FIGURE
No. SUBJECT
29 CHROMATOGRAM FOR 120% RECOVERY ANALYSIS
30
HPTLC LINEARITY CHROMATOGRAM OF TOLPERISONE
HYDROCHLORIDE AND PARACETAMOL (20 ng/ l +40 ng/ l)
31
HPTLC LINEARITY CHROMATOGRAM OF TOLPERISONE
HYDROCHLORIDE AND PARACETAMOL (40 ng/ l +80 ng/ l)
32
HPTLC LINEARITY CHROMATOGRAM OF TOLPERISONE
HYDROCHLORIDE AND PARACETAMOL (60 ng/ l + 120 ng/ l)
33
HPTLC LINEARITY CHROMATOGRAM OF TOLPERISONE
HYDROCHLORIDE AND PARACETAMOL (80 ng/ l +160 ng/ l)
34
HPTLC LINEARITY CHROMATOGRAM OF TOLPERISONE
HYDROCHLORIDE AND PARACETAMOL (100 ng/ l +200 ng/ l)
35
CALIBRATION CURVE OF TOLPERISONE HYDROCHLORIDE BY
HPTLC METHOD
36 CALIBRATION CURVE OF PARACETAMOL BY HPTLC METHOD
37 ANALYSIS OF FORMULATION - REPEATABILITY -1
38 ANALYSIS OF FORMULATION - REPEATABILITY -2
39 ANALYSIS OF FORMULATION - REPEATABILITY - 3
40 RECOVERY ANALYSIS OF FORMULATION - 80%
41 RECOVERY ANALYSIS OF FORMULATION – 100%
42 RECOVERY ANALYSIS OF FORMULATION - 120%
43 IR SPECTRUM OF SITAGLIPTIN PHOSPHATE
44 IR SPECTRUM OF SIMVASTATIN
FIGURE
No. SUBJECT
SIMVASTATIN
46
FIRST ORDER DERIVATIVE SPECTRUM OF SITAGLIPTIN
PHOSPHATE AND SIMVASTATIN
47
CALIBRATION CURVE OF SITAGLIPTIN PHOSPHATE ( FIRST
ORDER DERIVATIVE METHOD)
48
CALIBRATION CURVE OF SIMVASTATIN ( FIRST ORDER
DERIVATIVE METHOD)
49
RP-HPLC LINEARITY CHROMATOGRAM OF SITAGLIPTIN
PHOSPHATE AND SIMVASTATIN (160, 64 g/ml)
50
RP-HPLC LINEARITY CHROMATOGRAM OF SITAGLIPTIN
PHOSPHATE AND SIMVASTATIN (180, 72 g/ml)
51
RP-HPLC LINEARITY CHROMATOGRAM OF SITAGLIPTIN
PHOSPHATE AND SIMVASTATIN (200, 80 g/ml)
52
RP-HPLC LINEARITYCHROMATOGRAM OF SITAGLIPTIN
PHOSPHATE AND SIMVASTATIN (220, 88 g/ml)
53
RP-HPLC LINEARITY CHROMATOGRAM OF SITAGLIPTIN
PHOSPHATE AND SIMVASTATIN (240, 96 g/ml)
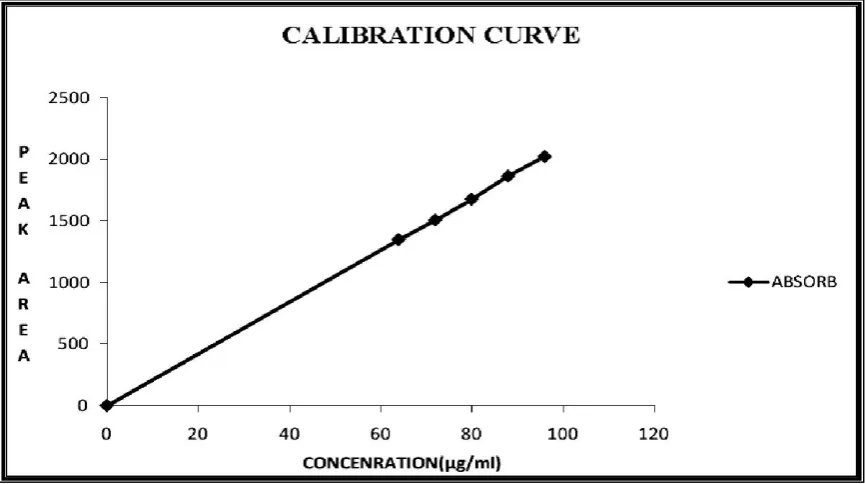
54
CALIBRATION CURVE OF SITAGLIPTIN PHOSPHATE BY RP-HPLC
METHOD
55 CALIBRATION CURVE OF SIMVASTATIN BY RP-HPLC METHOD
56 CHROMATOGRAM FOR FORMULATION – 1
57 CHROMATOGRAM FOR FORMULATION – 2
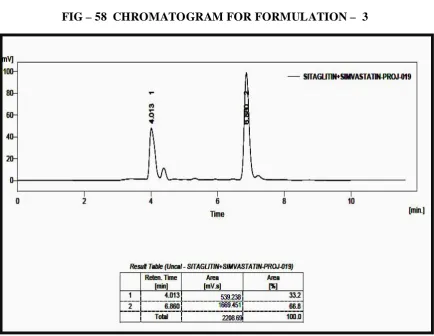
58 CHROMATOGRAM FOR FORMULATION – 3
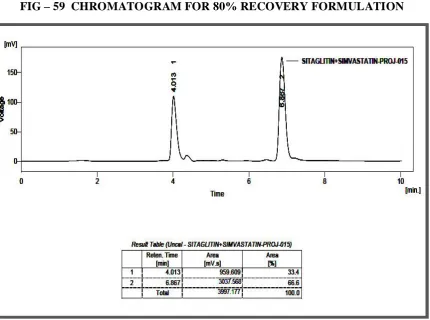
FIGURE
No. SUBJECT
60 CHROMATOGRAM FOR 100% RECOVERY FORMULATION
61 CHROMATOGRAM FOR 120% RECOVERY FORMULATION
62
HPTLC LINEARITY CHROMATOGRAM OF SITAGLIPTIN
PHOSPHATE AND SIMVASTATIN (40 ng/ l + 100 ng/ l)
63
HPTLC LINEARITY CHROMATOGRAM OF SITAGLIPTIN
PHOSPHATE AND SIMVASTATIN (80 ng/ l + 200 ng/ l)
64
HPTLC LINEARITY CHROMATOGRAM OF SITAGLIPTIN
PHOSPHATE AND SIMVASTATIN (120 ng/ l+ 300 ng/ l)
65
HPTLC LINEARITY CHROMATOGRAM OF SITAGLIPTIN
PHOSPHATE AND SIMVASTATIN (160 ng/ l + 400 ng/ l)
66
HPTLC LINEARITY CHROMATOGRAM OF SITAGLIPTIN
PHOSPHATE AND SIMVASTATIN (200 ng/ l+ 500 ng/ l)
67
CALIBRATION CURVE OF SITAGLIPTIN PHOSPHATE BY HPTLC
METHOD
68 CALIBRATION CURVE OF SIMVASTATIN BY HPTLC METHOD
69 CHROMATOGRAM FOR FORMULATION – 1
70 CHROMATOGRAM FOR FORMULATION – 2
71 CHROMATOGRAM FOR FORMULATION – 3
72 CHROMATOGRAM FOR 80% RECOVERY ANALYSIS
73 CHROMATOGRAM FOR 100% RECOVERY ANALYSIS
74 CHROMATOGRAM FOR 120% RECOVERY ANALYSIS
75 IR SPECTRUM OF THIOCOLCHICOSIDE
76 IR SPECTRUM OF KETOPROFEN
FIGURE
No. SUBJECT
78
OVERLAID FIRST ORDER DERIVATIVE SPECTRUM OF
THIOCOLCHICOSIDE AND KETOPROFEN
79
CALIBRATION CURVE OF THIOCOLCHICOSIDE ( FIRST ORDER
DERIVATIVE SPECTRUM)
80
CALIBRATION CURVE OF KETOPROFEN ( FIRST ORDER
DERIVATIVE SPECTRUM)
81
RP- HPLC LINEARITY CHROMATOGRAM OF KETOPROFEN AND
THIOCOLCHICOSIDE (80 g/ml + 6.4 g/ml)
82
RP- HPLC LINEARITY CHROMATOGRAM OF KETOPROFEN AND
THIOCOLCHICOSIDE (90 g/ml+ 7.2 g/ml)
83
RP- HPLC LINEARITY CHROMATOGRAM OF KETOPROFEN AND
THIOCOLCHICOSIDE (100 g/ml+ 8 g/ml)
84
RP- HPLC LINEARITY CHROMATOGRAM OF KETOPROFEN AND
THIOCOLCHICOSIDE (110 g/ ml + 8.8 g/ ml)
85
RP- HPLC LINEARITY CHROMATOGRAM OF KETOPROFEN AND
THIOCOLCHICOSIDE (120 g/ml + 9.6 g/ml)
86 CALIBRATION CURVE OF KETOPROFEN BY RP-HPLC METHOD
87
CALIBRATION CURVE OF THIOCOLCHICOSIDE BY RP-HPLC
METHOD
88 CHROMATOGRAM FOR FORMULATION – 1
89 CHROMATOGRAM FOR FORMULATION – 2
90 CHROMATOGRAM FOR FORMULATION – 3
91 CHROMATOGRAM FOR 80% RECOVERY FORMULATION
FIGURE
No. SUBJECT
93 CHROMATOGRAM FOR 120% RECOVERY FORMULATION
94 IR SPECTRUM OF DESLORATADINE
95 IR SPECTRUM OF AMBROXOL HYDROCHLORIDE
96
OVERLAID SPECTRUM OF DESLORATADINE AND AMBROXOL
HYDROCHLORIDE
97 FIRST ORDER DERIVATIVE SPECTRUM OF DESLORATADINE AND AMBROXOL
98 CALIBRATION CURVE OF AMBROXOL HYDROCHLORIDE at 244 nm ( ABSORPTION RATIO METHOD )
99 CALIBRATION CURVE OF AMBROXOL HYDROCHLORIDE at 288 nm ( ABSORPTION RATIO METHOD)
100 CALIBRATION CURVE OF DESLORATADINE at 288 nm (ABSORPTION RATIO METHOD)
101 CALIBRATION CURVE OF DESLORATADINE at 244 nm (ABSORPTION RATIO METHOD)
102 CALIBRATION CURVE OF DESLORATADINE at 277 nm (DERIVATIVE METHOD)
103 CALIBRATION CURVE OF AMBROXOL HYDROCHLORIDE at 320 nm ( DERIVATIVE METHOD)
104 IRSPECTRUM OF DOXOFYLLINE
105 IRSPECTRUM OF SALBUTAMOL SULPHATE
106
OVERLAID SPECTRA OF DOXOFYLLINE AND SALBUTAMOL
SULPHATE
107
SECOND ORDER DERIVATIVE SPECTRUM OF DOXOFYLLINE AND
SALBUTAMOL SULPHATE
108
CALIBRATION CURVE OF DOXOFYLLINE AT 224 nm
FIGURE
No. SUBJECT
109 CALIBRATION CURVE OF DOXOFYLLINE AT 274 nm (SIMULTANEOUS EQUATION METHOD)
110
CALIBRATION CURVE OF SALBUTAMOL AT 224nm
(SIMULTANEOUS EQUATION METHOD)
111
CALIBRATION CURVE OF SALBUTAMOL AT 274nm
(SIMULTANEOUS EQUATION METHOD)
112 CALIBRATION CURVE OF DOXOFYLLINE AT 270nm - 280 nm (AREA UNDER CURVE METHOD)
113 CALIBRATION CURVE OF DOXOFYLLINE AT 220 nm - 230 nm (AREA UNDER CURVE METHOD)
114 CALIBRATION CURVE OF SALBUTAMOL SULPHATE 220 nm - 230 nm (AREA UNDER CURVE METHOD)
115 CALIBRATION CURVE OF SALBUTAMOL SULPHATE 270 - 280 nm (AREA UNDER CURVE METHOD)
116 CALIBRATION CURVE OF SALBUTAMOL SULPHATE AT 233nm ( DERIVATIVE METHOD)
117
CALIBRATION CURVE OF DOXOFYLLINE AT 229 nm (DERIVATIVE
LIST OF TABLES
TABLE
NO. CONTENT
1 SOLUBILITY PROFILE OF TOLPERISONE HYDROCHLORIDE
2 SOLUBILITY PROFILE OF PARACETAMOL
3 OPTICAL CHARACTERISTICS OF TOLPERISONE HYDROCHLORIDE
(SIMULTANEOUS EQUATION METHOD)
4 OPTICAL CHARACTERISTICS OF PARACETAMOL (SIMULTANEOUS
EQUATION METHOD)
5 SYNTHETIC MIXTURES (SIMULTANEOUS EQUATION METHOD)
6 QUANTIFICATION OF FORMULATION (SIMULTANEOUS EQUATION
METHOD)
7 INTRA DAY AND INTER DAY ANALYSIS OF FORMULATION
(SIMULTANEOUS EQUATION METHOD)
8 RUGGEDNESS STUDY(SIMULTANEOUS EQUATION METHOD)
9 RECOVERY ANALYSIS OF FORMULATION (SIMULTANEOUS EQUATION
METHOD)
10 OPTICAL CHARACTERISTICS OF TOLPERISONE HYDROCHLORIDE
(ABSORPTION RATIO METHOD)
12 OPTICAL CHARACTERISTICS OF PARACETAMOL (ABSORPTION RATIO
METHOD)
TABLE
NO. CONTENT
14 QUANTIFICATION OF FORMULATION (ABSORPTION RATIO METHOD)
15 INTRA DAY AND INTER DAY ANALYSIS OF FORMULATION
(ABSORPTION RATIO METHOD)
16 RUGGEDNESS STUDY (ABSORPTION RATIO METHOD)
17 RECOVERY ANALYSIS (ABSORPTION RATIO METHOD)
18 OPTICAL CHARACTERISTICS OF TOLPERISONE HYDROCHLORIDE
(AREA UNDER CURVE METHOD)
19 OPTICAL CHARACTERISTICS OF PARACETAMOL (AREA UNDER CURVE
METHOD)
20 SYNTHETIC MIXTURES (AREA UNDER CURVE METHOD)
21 QUANTIFICATION OF FORMULATION (AREA UNDER CURVE METHOD)
22 INTRA DAY AND INTER DAY ANALYSIS OF FORMULATION (AREA
UNDER CURVE METHOD)
21 RUGGEDNESS STUDY (AREA UNDER CURVE METHOD)
23 RECOVERY ANALYSIS OF FORMULATION (AREA UNDER CURVE
METHOD)
24 OPTICAL CHARACTERISTICS OF TOLPERISONE HYDROCHLORIDE AND
PARACETAMOL (FIRST ORDER DERIVATIVE METHOD)
25 SYNTHETIC MIXTURES (FIRST ORDER DERIVATIVE METHOD)
26 QUANTIFICATION OF FORMULATION (FIRST ORDER DERIVATIVE
METHOD)
TABLE
NO. CONTENT
ORDER DERIVATIVE METHOD)
28 RUGGEDNESS STUDY (FIRST ORDER DERIVATIVE METHOD)
29 RECOVERY ANALYSIS OF FORMULATION (FIRST ORDER DERIVATIVE
METHOD)
30 OPTICAL CHARACTERISTICS OF TOLPERISONE HYDROCHLORIDE AND
PARACETAMOL (RP- HPLC METHOD)
31 QUANTIFICATION OF FORMULATION FOR RP - HPLC METHOD
32 SYSTEM SUITABILITY PARAMATERS
33 INTRA DAY AND INTER DAY ANALYSIS OF FORMULATION (RP- HPLC
METHOD)
34 RECOVERY ANALYSIS OF FORMULATION (RP-HPLC METHOD)
35 OPTICAL CHARACTERISTICS (HPTLC METHOD)
36 QUANTIFICATION OF FORMULATION (HPTLC METHOD)
37 INTRA DAY AND INTER DAY ANALYSIS OF FORMULATION (HPTLC
METHOD)
38 RECOVERY ANALYSIS OF FORMULATION (HPTLC METHOD)
39 SOLUBILITY PROFILE OF SITAGLIPTIN PHOSPHATE
40 SOLUBILITY PROFILE OF SIMVASTATIN
41 OPTICAL CHARACTERISTICS ( DERIVATIVE SPECTROSCOPY METHOD)
42 SYNTHETIC MIXTURES (DERIVATIVE SPECTROSCOPY METHOD)
TABLE
NO. CONTENT
44 INTER DAY AND INTRADAY ANALYSIS OF FORMULATION (DERIVATIVE
METHOD)
45 RUGGEDNESS STUDY ((DERIVATIVE METHOD)
46 RECOVERY ANALYSIS OF FORMULATION (DERIVATIVE METHOD)
47 OPTICAL CHARACTERISTICS OF SITAGLIPTIN PHOSPHATE AND
SIMVASTATIN BY RP-HPLC METHOD
48 QUANTIFICATION OF FORMULATION ( RP-HPLC METHOD)
49 INTER DAY AND INTRADAY ANALYSIS OF FORMULATION (RP-HPLC
METHOD)
50 RECOVERY ANALYSIS (RP-HPLC METHOD)
51 SYSTEM SUITABILITY PARAMATERS FOR RP-HPLC METHOD
52 OPTICAL CHARACTERISTICS ( HPTLC METHOD)
53 QUANTIFICATION OF FORMULATION (BY HPTLC METHOD)
54 INTER AND INTRADAY ANALYSIS OF FORMULATION (HPTLC METHOD)
55 RECOVERY ANALYSIS ( HPTLC METHOD)
56 SOLUBILITY PROFILE OF KETOPROFEN
57 SOLUBILITY PROFILE OFTHIOCOLCHICOSIDE
58 OPTICAL CHARACTERISTICS (DERIVATIVE SPECTROSCOPY METHOD)
59 SYNTHETIC MIXTURES (DERIVATIVE SPECTROSCOPY METHOD)
60 QUANTIFICATION OF FORMULATION ( DERIVATIVE SPECTROSCOPY
TABLE
NO. CONTENT
61 INTER DAY AND INTRADAY ANALYSIS OF FORMULATION (DERIVATIVE
METHOD)
62 RUGGEDNESS STUDY ((DERIVATIVE METHOD)
63 RECOVERY ANALYSIS OF FORMULATION (DERIVATIVE METHOD)
64 OPTICAL CHARACTERISTICS OF THIOCOLCHICOSIDE AND
KETOPROFEN BY RP-HPLC METHOD
65 QUANTIFICATION OF FORMULATION ( RP-HPLC METHOD)
66 INTER DAY AND INTRADAY ANALYSIS OF FORMULATION (RP-HPLC
METHOD)
67 RECOVERY ANALYSIS OF FORMULATION (RP-HPLC METHOD)
68 SYSTEM SUITABILITY PARAMATERS FOR RP-HPLC METHOD
69 SOLUBILITY PROFILE OF DESLORATADINE
70 SOLUBILITY PROFILE OF AMBROXOL HYDROCHLORIDE
71 OPTICAL CHARACTERISTICS OF DESLORATADINE ( ABSORPTION RATIO
METHOD)
72 OPTICAL CHARACTERISTICS OF AMBROXOL HYDROCHLORIDE
(ABSORPTION RATIO METHOD)
73 SYNTHETIC MIXTURES (ABSORPTION RATIO METHOD)
74 QUANTIFICATION OF FORMULATION (ABSORPTION RATIO METHOD)
75 INTER DAY AND INTRADAY ANALYSIS OF FORMULATION (ABSORPTION
TABLE
NO. CONTENT
76 RUGGEDNESS STUDY (ABSORPTION RATIO METHOD)
77 RECOVERY ANALYSIS OF FORMULATION (ABSORPTION RATIO METHO)
78 OPTICAL CHARACTERISTICS OF DESLORATADINE AND AMBROXOL
HYDROCHLORIDE (DERIVATIVE METHOD)
79 SYNTHETIC MIXTURES (DERIVATIVE METHOD)
80 QUANTIFICATION OF FORMULATION (DERIVATIVE METHOD)
81 INTER DAY AND INTRADAY ANALYSIS OF FORMULATION
82 RUGGEDNESS STUDY (DERIVATIVE METHOD)
83 RECOVERY ANALYSIS (DERIVATIVE METHOD)
84 SOLUBILITY PROFILE OF DOXOFYLLINE
85 SOLUBILITY PROFILE OF SALBUTAMOL SULPHATE
86 OPTICAL CHARACTERISTICS OF DOXOFYLLINE ( SIMULTANEOUS
EQUATION METHOD)
87 OPTICAL CHARACTERISTICS OF SALBUTAMOL SULPHATE
(SIMULTANEOUS EQUATION METHOD)
88 SYNTHETIC MIXTURES (SIMULTANEOUS EQUATION METHOD)
89 QUANTIFICATION OF FORMULATION (SIMULTANEOUS EQUATION
METHOD)
90 INTER DAY AND INTRADAY ANALYSIS OF FORMULATION
(SIMULTANEOUS EQUATION METHOD)
TABLE
NO. CONTENT
92 RECOVERY ANALYSIS OF FORMULATION (SIMULTANEOUS EQUATION
METHOD)
93 OPTICAL CHARACTERISTICS OF DOXOFYLLINE ( AREA UNDER CURVE
METHOD)
94 OPTICAL CHARACTERISTICS OF SALBUTAMOL ( AREA UNDER CURVE
METHOD)
95 SYNTHETIC MIXTURES (AREA UNDER CURVE METHOD)
96 QUANTIFICATION OF FORMULATION (AREA UNDER CURVE METHOD)
97 INTER DAY AND INTRADAY ANALYSIS OF FORMULATION (AREA
UNDER CURVE METHOD)
98 RUGGEDNESS STUDY (AREA UNDER CURVE METHOD)
99 RECOVERY ANALYSIS OF FORMULATION (AREA UNDER CURVE
METHOD)
100 OPTICAL CHARACTERISTICS OF DOXOFYLLINE & SALBUTAMOL
(DERIVATIVE METHOD)
101 SYNTHETIC MIXTURES (DERIVATIVE METHOD)
102 QUANTIFICATION OF FORMULATION (DERIVATIVE METHOD)
103 INTER DAY AND INTRADAY ANALYSIS OF FORMULATION(DERIVATIVE
METHOD)
104 RUGGEDNESS STUDY (DERIVATIVE METHOD)
SYMBOLS AND ABBREVIATIONS
ICH - International Conference on Harmonization
- Lambda
SD - Standard Deviation
SE - Standard Error
UV-VIS - Ultraviolet - Visible
USP - United States Pharmacopoeia
IP - Indian Pharmacopoeia
BP - British Pharmacopoeia
IR - Infra Red
°C - Degree Celsius
LOD - Limit of Detection
LOQ - Limit of Quantitation
g/ ml - Microgram per Millilitre
mg/ tab - Milligram per Tablet
ml - Millilitre
MM - Milli Mole
nm - Nanometre
pH - Negative Logarithm of Hydrogen Ion Concentration
% - Percentage
RP - HPLC - Reverse Phase -High Performance Liquid Chromatography
HPTLC - High Performance Thin Layer Chromatography
TPE - Tolperisone Hydrochloride
PCL - Paracetamol
SIM - Simvastatin
SITA - Sitagliptin Phosphate
THI - Thiocolchicoside
KET - Ketoprofen
DES - Desloratadine
AMB - Ambroxol Hydrochloride
DOX - Doxofylline
SAL - Salbutamol Sulphate
Gms - Grams
l - Micro litre
Rpm - Rotation per minute
- Micron
V/v/v/v - Volume/Volume/Volume/Volume
min - Minute
ml/ min - Millilitre/minute
ng/ l - Nanogram/ micro litre
LC-MS - Liquid Chromatography Mass Spectrometry
GC-MS - Gas Chromatography Mass Spectrometry
GC - Gas Chromatography
CRF - Chromatographic Response Factor
USFDA - United States Food and Drug Administration
WHO - World Health Organization GLP
GMP - Good Laboratory Practice
S/N - Signal to Noise ratio
LDP - Low Density Lipoprotein
HMG – COA - Hydroxy Methyl Glutaryl – Co-Enzyme
CYP - Cytochrome Phosphate
COX - Cyclo Oxygenase
PGH2 - Prostaglandin Hydroxy Synthase
ILC - Inverse Least Square
PCR - Principle Component Regression
PLS - Partial Least Square
ODS - Octa Decyl Silane
AR - Analytical Reagent
NaI - Sodium Iodide
1
1. INTRODUCTION
Pharmaceutical products formulated with more than one drug, typically referred to as
combination products, are intended to meet previously unmet patients need by combining
the therapeutic effects of two or more drugs in one product. These combination products
can present daunting challenges to the analytical chemist responsible for the development
and validation of analytical methods.
The number of drugs introduced into the market is increasing every year. These drugs may
be either new entities or partial structural modification of the existing one. Very often there
is a time lag from the date of introduction of a drug into the market to the date of its
inclusion in pharmacopoeias. This happens because of the possible uncertainties in the
continuous and wider usage of these drugs, reports of new toxicities (resulting in their
withdrawal from the market), development of patient resistance and introduction of better
drugs by competitors. Under these conditions, standards and analytical procedures for
these drugs may not be available in the pharmacopoeias. It becomes necessary, therefore to
develop newer analytical methods for such drugs.
1.1. Basic criteria for new method development of drug analysis:1
The drug or drug combination may not be official in any pharmacopoeias,
A proper analytical procedure for the drug may not be available in the literature due
to patent regulations,
Analytical methods may not be available for the drug in the form of a formulation
due to the interference caused by the formulation excipients,
Analytical methods for the quantitation of the drug in biological fluids may not be
Analytical methods for a drug in combination with other drugs may not be
available,
The existing analytical procedures may require expensive reagents and solvents. It
may also involve cumbersome extraction and separation procedures and these may
not be reliable.
1.2. INTRODUCTION TO SPECTROPHOTOMETRIC METHODS OF ANALYSIS
FOR DRUGS IN COMBINATION2
Simultaneous estimation of drug combination is generally done by separation using
chromatographic methods like HPLC, GC and HPTLC etc. These methods are accurate
and precise with good reproducibility, but the cost of analysis is quite high owing to
expensive instrumentation, reagent and expertise. Hence it is worthwhile to develop
simpler and cost effective method for simultaneous estimation of drugs for routine
analysis of formulation. Spectrophotometric analysis fulfils such requirement where the
simultaneous estimation of the drug combination can be done with similar effectiveness as
that of chromatographic methods.
A number of modifications to the simple spectrophotometric procedure are available to the
analyst, which may eliminate certain sources of interference and permit the accurate
determination of all of the absorbing components. Each modification of the basic
procedure may be applied if certain criteria are satisfied.
The basis of all the spectrophotometric techniques for multicomponent samples is the
property that at all wavelengths:
the absorbance of a solution is the sum of absorbance of the individual components
3
The measured absorbance is the difference between the total absorbance of the
solution in the sample cell and that of the solution in the reference cell.
There are various spectrophotometric methods are available which can be used for the
analysis of a combination samples. Following methods can be used
Simultaneous equation method
Derivative spectrophotometric method
Absorbance ratio method ( Q-Absorbance method)
Difference spectrophotometry
Solvent extraction method
Simultaneous Equation Method2
If a sample contains two absorbing drugs (X and Y) each of which absorbs at the max of
the other it may be possible to determine both drugs by the technique of simultaneous
equation (Vierodt’s method) provided that certain criteria apply.
The in formations required are:
the absorptivities of X at 1 and 2, ax1 and ax2 respectively
the absorptivities of Y at 1 and 2, ay1 and ay2 respectively
The absorbance of the diluted sample at 1 and 2, A1 and A2 respectively.
Therefore
Cx = (A1 ay2 - A2 ay1) / (ax1 ay2 - ax2 ay1) ……… (1)
Q - Absorbance Method (Absorbance Ratio Method) 2
Q - Absorbance method depends on the property that, for a substance which obeys Beer's
law at all wavelength, the ratio of absorbances at any two wavelengths is a constant value
independent of concentration or path length. For example, two different dilution of the
same substance give the same absorbance ratio A1/A2. In the USP, this ratio is referred to
as Q value.
In the quantitative assay of two components in a mixture by the absorbance ratio method,
absorbances are measured at two wavelengths. One being the max of one of the
component ( 2) and the other being a wavelength of equal absorptivities of the two
components i.e. an isoabsorptive point8.
Let QX = ax2/ ax1, QY = ay2/ ay1, and QM = A2/ A1
QM = Fx(QX - QY) + QY
Fx= (QM - QY) / (QX - QY)
Derivative Spectroscopy2
For the purpose of spectral analysis in order to relate chemical structure to electronic
transitions, and for analytical situations in which mixture contribute interfering absorption,
a method of manipulating the spectral data is called derivative spectroscopy. Derivative
spectrophotometry involves the conversions of a normal spectrum to its first, second or
higher derivative spectrum. In the context of derivative spectrophotometry, the normal
5 Solvent Extraction Method2
In solvent extraction method quantitation of individual drugs in combinations has been
performed by separation of individual drugs based on their selective solubility followed by
spectrophotometric measurement17
1.3. INTRODUCTION TO HPLC METHODS OF ANALYSIS FOR DRUGS IN
COMBINATION3 – 5
Most of the drugs in multi component dosage forms can be analyzed by HPLC method
because of the several advantages like rapidity, specificity, accuracy, precision and ease of
automation in this method. HPLC method eliminates tedious extraction and isolation
procedures. Some of the advantages are:
Speed (analysis can be accomplished in 20 minutes or less),
Greater sensitivity (various detectors can be employed),
Improved resolution (wide variety of stationary phases),
Reusable columns (expensive columns but can be used for many analysis),
Ideal for the substances of low volatility,
Easy sample recovery, handling and maintenance,
Instrumentation tends itself to automation and quantitation (less time and less
labour),
Precise and reproducible,
Calculations are done by integrator itself,
1.3.1. System Suitability Tests for Chromatographic Methods6, 7, 9
System suitability is the checking of a system to ensure system performance before or
during the analysis of unknowns. Parameters such as plate count, tailing factors, resolution
and reproducibility (% RSD retention time and area for six repetitions) are determined and
compared against the specifications set for the method. These parameters are measured
during the analysis of a system suitability "sample" that is a mixture of main components
and expected by-products. Lists of the terms to be measured and their recommended limits
obtained from the analysis of the system suitability sample are given below.
System Suitability Parameters and Recommendations
Parameter Recommendation
Capacity Factor (k’) the peak should be well-resolved from other peaks and the
void volume, generally k’>2.0
Repeatability RSD </= 1% for N >/= 5 is desirable.
Relative retention not essential as long as the resolution is stated.
Resolution (Rs)
Rs of > 2 between the peak of interest and the closest
eluting potential interferent (impurity, excipient,
degradation product, internal standard, etc.
Tailing Factor (T) T of </= 2
7 1) Capacity Factor (or) Retention (KA)
The retention of a drug with a given packing material and eluent can be
expressed as retention time or retention volume, but both of these are dependent on flow
rate, column length and column diameter. The retention is best described as a column
capacity ratio (K), which is independent of these factors. The column capacity ratio of a
compound (A) is given as
0 0 A 0 0 A A t t t V V V K
2) Resolution (RS)
The resolution, Rs of two neighboring peaks is defined by the ratio of the distance
between the two peak maxima. It is the difference between the retention times of two
solutes divided by their average peak width. For baseline separation, the ideal value of Rs
is 2.0. It is calculated by using the formula,
) W W ( 5 . 0 Rt Rt R 2 1 1 2 f Where,
Rt1 and Rt2 are the retention times of components 1 and 2
W1 and W2are peak widths of components 1 and 2
3) Selectivity ( )
The selectivity (or separation factor) , is a measure of relative retention of two
components in a mixture. The ideal value of selectivity is 2. It can be calculated by using
Where, V0 is the void volume of the column and V2 and V1 are the retention
volumes of the second and the first peak, respectively.
4) Column efficiency
Efficiency, N, of a column is measured by the number of theoretical plates per
meter. It is a measure of band spreading of a peak. Smaller the band spread, higher is the
number of theoretical plates, indicating good column and system performance. Columns
with N ranging from 5,000 to 1, 00,000 plates/meter are ideal for a good system.
Efficiency is calculated by using the formula,
2 2 16
W Rt N
Where, Rt is the retention time and W is the peak width.
5) Peak asymmetry factor (As)
Peak asymmetry factor, Ascan be used as a criterion of column performance. The
peak half width b of a peak at 10 % of the peak height, divided by the corresponding front
half width a gives the asymmetry factor.
1.4. INTRODUCTION TO HPTLC METHODS OF ANALYSIS FOR DRUGS IN
COMBINATION2, 7
HPTLC (High Performance Thin Layer Chromatography) is a well known and versatile
separation method which shows a lot of advantages in comparison to other separation
9 Layer of Sorbent 100µm
Efficiency High due to smaller particle size generated
Separations 3 - 5 cm
Analysis Time Shorter migration distance and the analysis time is greatly reduced
Solid support Wide choice of stationary phases like silica gel for normal phase
and C8 , C18 for reversed phase modes
Development
chamber New type that require less amount of mobile phase
Sample spotting Auto sampler
Scanning Use of UV/ Visible/ Fluorescence scanner scans the entire
chromatogram qualitatively and quantitatively and the scanner is an
advanced type of densitometer
1.4.1 Features of HPTLC
1. Simultaneous processing of sample and standard - better analytical precision and
accuracy less need for Internal Standard
2. Several analysts work simultaneously
3. Lower analysis time and less cost per analysis
4. Low maintenance cost
5. Simple sample preparation - handle samples of divergent nature
6. No prior treatment for solvents like filtration and degassing
7. Low mobile phase consumption per sample
8. No interference from previous analysis - fresh stationary and mobile phases for
each analysis - no contamination
9. Visual detection possible - open system
1.4.2. Steps involved in HPTLC
1. Selection of chromatographic layer
2. Sample and standard preparation
3. Layer pre-washing
4. Layer pre-conditioning
5. Application of sample and standard
6. Chromatographic development
7. Detection of spots
8. Scanning
9. Documentation of chromatic plate
1.4.3. Selection of chromatographic layer
- Precoated plates - different support materials - different Sorbents available
- 80% of analysis - silica gel GF · Basic substances, alkaloids and steroids Aluminium
oxide
- Amino acids, dipeptides, sugars and alkaloids - cellulose
- Non-polar substances, fatty acids, carotenoids, cholesterol - RP2, RP8 and RP18
- Preservatives, barbiturates, analgesic and phenothiazines - Hybrid plates -RPWF254s
1.4.4.Sample and Standard Preparation
- To avoid interference from impurities and water vapours.
- Low signal to noise ratio - Straight base line- Improvement of LOD
- Solvents used are Methanol, Chloroform: Methanol (1:1), Ethyl acetate: Methanol (1:1),
11 1% Ammonia or 1% Acetic acid
- Dry the plates and store in dust free atmosphere
1.4.5. Activation of pre-coated plates
- Freshly open box of plates do not require activation
- Plates exposed to high humidity or kept on hand for long time to be activated
- By placing in an oven at 110-120ºc for 30 minutes prior to spotting
- Aluminium sheets should be kept in between two glass plates and placing in oven at
110-120ºc for 15 minutes.
1.4.6. Application of sample and standard
- Usual concentration range is 0.1-1µg / µl
- Above this causes poor separation
- Linomat IV (automatic applicator) - nitrogen gas sprays sample and standard from
syringe on TLC plates as bands
- Band wise application - better separation - high response to densitometer
Selection of mobile phase
Trial and error
one’s own experience and Literature
Normal phase
Stationary phase is polar
Mobile phase is non polar-Non-polar compounds eluted first because of lower affinity with
stationary phase
Reversed phase
Stationary phase is non polar
Mobile phase is polar
Polar compounds eluted first because of lower affinity with stationary phase
Non-Polar compounds retained because of higher affinity with the stationary phase- 3 - 4
component mobile phase should be avoided
Multi component mobile phase once used not recommended for further use and solvent
composition is expressed by volumes (v/v) and sum of volumes is usually 100
Twin trough chambers are used only 10 -15 ml of mobile phase is required Components of
mobile phase should be mixed introduced into the twin - trough chamber
Pre- conditioning (Chamber saturation)
- Un- saturated chamber causes high Rf values
Saturated chamber by lining with filter paper for 30 minutes prior to development
-uniform distribution of solvent vapours - less solvent for the sample to travel - lower Rf
values.
Chromatographic development and drying
After development, remove the plate and mobile phase is removed from the plate - to avoid
contamination of lab atmosphere
Dry in vacuum desiccators - avoid hair drier - essential oil components may evaporate
Detection and visualization
Detection under UV light is first choice - non destructive
Spots of fluorescent compounds can be seen at 254 nm (short wave length) or at 366 nm
13
Spots of non fluorescent compounds can be seen fluorescent stationary phase is used
-silica gel GF
Non UV absorbing compounds like ethambutol, dicylomine etc - dipping the plates in
0.1% iodine solution
When individual component does not respond to UV - derivatisation required for
detection
Quantification
- Sample and standard should be chromatographed on same plate
- After development chromatogram is scanned
- Camag TLC scanners III scan the chromatogram in reflectance or in transmittance
mode by absorbance or by fluorescent mode
- scanning speed is selectable up to 100 mm/s - spectra recording is fast
- 36 tracks with up to 100 peak windows can be evaluated
- Calibration of single and multiple levels with linear or non-linear regressions are possible
- When target values are to be verified such as stability testing and
- Dissolution profile single level calibration is suitable
- Statistics such as RSD or CI report automatically
- Concentration of analyte in the sample is calculated by considering the sample
1.5. VALIDATION 8, 12
The word “Validation” means “Assessment” of validity or action of proving effectiveness.
Validation as defined by different agencies
USFDA -According to this “validation” is the process of establishing documented
evidence which provides a high degree of assurance that a specific process will
consistently produce a product meeting its predetermined specifications and quality
attributes.
WHO - Defines validation as an action of providing any procedure process equipment
material, activity or system actually leads to the expected results.
EUROPEON COMMITTEE -Defines validation as an action of providing in a
accordance with the principles of GMP that any procedure, process material and activity or
system actually leads to expected result.
1.5.1 Method Validation 8
Method validation is the process used to confirm that the analytical procedure employed
for a specific test is suitable for its intended use. Results from method validation can be
used to judge the quality, reliability and consistency of analytical results; it is an integral
part of any good analytical practice.
Analytical methods need to be validated or revalidated
before their introduction into routine use;
whenever the conditions change for which the method has been validated (e.g., an
15
Whenever the method is changed and the change is outside the original scope of the
method.
The various validation parameters are:
Accuracy,
Precision (repeatability and reproducibility),
Linearity and Range,
Limit of detection (LOD)/ Limit of quantitation (LOQ),
Selectivity/ Specificity,
Robustness/ Ruggedness and
Stability and System suitability studies.
Advantages of Analytical method
Validation:-The biggest advantage of method validation is that it builds a degree of confidence,
not only for the developer but also to the user.
Although the validation exercise may appear costly and time consuming, it results
inexpensive, eliminates frustrating repetitions and leads to better time management
in the end.
Minor changes in the conditions such as reagent supplier or grade, analytical setup
are unavoidable due to obvious reasons but the method validation absorbs the shock
Key parameters of the Analytical method validation:-19, 20
It is important for one to understand the parameters or characteristics involved in the
validation process. The various Performance parameters, which are addressed in a
validation exercise, are grouped as follows.
(1) Accuracy:
-The accuracy of an analytical method may be defined as the closeness of the test results
obtained by the method to the true value. It is the measure of the exactness of the analytical
method developed. Accuracy may often express as percent recovery by the assay of a
known amount of analyte added.
Accuracy may be determined by applying the method to samples or mixtures of excipients
to which known amount of analyte have been added both above and below the normal
levels expected in the samples. Accuracy is then calculated from the test results as the
percentage of the analyte recovered by the assay.
(2) Precision:
-The precision of an analytical method is the degree of agreement among individual test
results when the method is applied repeatedly to multiple samplings of homogenous
samples. This is usually expressed as the standard deviation or the relative standard
deviation (coefficient of variation). Precision is a measure of the degree of reproducibility
or of the repeatability of the analytical method under normal operating circumstances.
Repeatability involves analysis of replicates by the analyst using the same equipment and
method and conducting the precision study over short period of time while reproducibility
17 Different Occasions,
Different Laboratories,
Different Batch of Reagent,
Different Analysts,
Different Equipments.
Determination of Repeatability: - Repeatability can be defined as the precision of the
procedure when repeated by same analyst under the same operating conditions (same
reagents, equipments, settings and laboratory) over a short interval of time.
Determination of reproducibility: -Reproducibility means the precision of the procedure
when it is carried out under different conditions-usually in different laboratories-on
separate, putatively identical samples taken from the same homogenous batch of material.
Comparisons of results obtained by different analysts, by the use of different equipments,
or by carrying out the analysis at different times can also provide valuable information.
(3) Linearity and
range:-The linearity of an analytical method is its ability to elicit test results that are directly (or
by a well defined mathematical transformation) proportional to the analyte concentration in
samples within a given range. Linearity usually expressed in terms of the variance around
the slope of regression line calculated according to an established mathematical
relationship from test results obtained by the analysis of samples with varying
concentrations of analyte.
The linear range of detectability that obeys Beer’s law is dependent on the compound
Data is processed by linear least square regression declaring the regression co-efficient and
b of the linear equation y = ax + b together with the correlation coefficient of determination
r. For the method to be linear the r value should be close to1.
The range of an analytical method is the interval between the upper and lower levels of the
analyte (including these levels) that have been demonstrated to be determined with
precision, accuracy and linearity using the method as written.
(4) Limit of Detection and limit of
Quantitation:-Limit of detection: -The limit of detection is the parameter of limit tests. It is the lowest
level of analyte that can be detected, but not necessarily determined in a quantitative
fashion, using a specific method under the required experimental conditions. The limit test
thus merely substantiates that the analyte concentration is above or below a certain level.
The determination of the limit of detection of instrumental procedures is carried out by
determining the signal-to-noise ratio by comparing test results from the samples with
known concentration of analyte with those of blank samples and establishing the minimum
level at which the analyte can be reliably detected. A signal-to-noise ratio of 2:1 or 3:1 is
generally accepted.
Limit of quantitation: -Limit of quantitation is a parameter of quantitative assays for low
levels of compounds in sample matrices such as impurities in bulk drugs and degradation
products in finished pharmaceuticals. The limit of quantitation is the lowest concentration
of analyte in a sample that may be determined with acceptable accuracy and precision
19 (5) Selectivity and
Specificity:-The selectivity of an analytical method is its ability to measure accurately and specifically
the analyte of interest in the presence of components that may be expected to be present in
the sample matrix.
Selectivity may be expressed in terms of the bias of the assay results obtained when the
procedure is applied to the analyte in the presence of expected levels of other components,
compared the results obtained when the procedure is applied to the analyte in the presence
of expected levels of other components, compared to the results obtained on the same
analyte without added substances.
6) Robustness and
Ruggedness:-Robustness: - The robustness of an analytical method is a measure of its capacity to
remain unaffected by small but deliberate variation in method parameters and provides an
indication of its reliability during normal usage. The determination of robustness requires
that methods characteristic are assessed when one or more operating parameter varied.
Ruggedness:- The ruggedness of an analytical method is the degree of reproducibility of
test results obtained by the analysis of the same samples under a variety of normal test
conditions such as different laboratories, different analysts, using operational and
environmental conditions that may differ but are still within the specified parameters of the
assay. The testing of ruggedness is normally suggested when the method is to be used in
more than one laboratory. Ruggedness is normally expressed as the lack of the influence
on the test results of operational and environmental variables of the analytical method.
For the determination of ruggedness, the degree of reproducibility of test result is
precision of the assay under normal condition to obtain a measure of the ruggedness of the
analytical method.
(7) Stability and System suitability
tests:-Stability of the sample, standard and reagents is required for a reasonable time to generate
reproducible and reliable results. For example, 24 hour stability is desired for solutions and
reagents that need to be prepared for each analysis.
System suitability test provide the added assurance that on a specific occasion the method
is giving, accurate and precise results. System suitability test are run every time a method
is used either before or during analysis.
The results of each system suitability test are compared with defined acceptance criteria
and if they pass, the method is deemed satisfactory on that occasion. The nature of the test
and the acceptance criteria will be based upon data generated during method development
optimization and validation experiments.
1.6. BASIC STATISTICAL PARAMETERS17
Statistical techniques have been widely used in many diverse areas of scientific
investigation. Statistical applications have been recognized as crucial to quality control
procedure, test, specification and definitions. Principle of modern analytical techniques and
skill in their application are necessary attribute of the successful pharmaceutical analyst,
thus does not ensure the satisfactory solution of all the problem that may encountered.
Some auxiliary knowledge methods those can aid the analyst in designing experiment,
21 1.6.1 Linear Regression
Linear regression is a statistical technique that defines the functional relationship
between two variables by best-fitting straight line. Once a linear relationship has been
shown to have a high probability by the value of the correlation coefficient ‘r’, then the
best straight line through the data points has to be estimated. This can often be done be
done by visual inspection of the calibration graph, but in many cases it is far more sensible
to evaluate the best straight line by linear regression (the method of least squares).
The equation of straight line is
y = mx + c
Where, y the dependent variable is plotted as result of changing x, the independent
variable.
To obtain the regression line ‘y on x’ the slope ‘m’ of the line and the intercept ‘c’ on
the y axis are given by the following equation.
m = ( () () ) and c =( ) )( ) ( )
1.6.2 Correlation Coefficient (r)
It is a procedure commonly used to characterize quantitatively the relationship
between variable. Correlation is related to linear regression. To establish whether there is a
linear relationship between two variables x1 and y1,use Pearson’s correlation coefficient r.
r = n x y x y
{[ ) ] [ ) ]}
The value of r must lie between +1 and -1, the nearer it is to +1, the greater the
probability that a definite linear relationship exists between the variables x and y, values
close to +1 indicate positive correlation and values close to -1 indicate negative correlation
values of ‘r’ that tend towards zero indicate that x and y are not linearly related (they made
be related in a non-linear fashion)
1.63 Standard Deviation (SD)
It is commonly used in statistics as a measure of precision statistics as a measure of
precision and is more meaningful than is the average deviation. It may be thought of as a
root-mean-square deviation of values from their average and is expressed mathematically
as
1 N
x x S
n i
1 i
i
Where,
S is standard deviation.
If N is large (50 or more) then of course it is immaterial whether the term in the
denomination is N -1 or N
= sum
x = Mean or arithmetic average.
x
-x = deviation of a value from the mean.
23
1.6.4 Percentage Relative Standard Deviation (%RSD)
It is also known as coefficient of variation (CV). It is defined as the standard
deviation (SD) expressed as the percentage of mean.
C 100 x S.D RSD % or V
Where,
SD = the standard deviation,
x = Mean or arithmetic average.
The variance is defined as S2 and is more important in statistics than S itself.
However, the latter is much more commonly used with chemical data.
1.6.5 Standard Error of Mean (SE)
Standard error of mean can be defined as the value obtained by division of standard
deviation by square root of number of observations. It is mathematically expressed as
n S.D. S.E.
Where,
SD = Standard deviation.
n = number of observation
1.6.6 Confidence Interval (CI)
A confidence interval gives an estimated range of values which is likely to include
sample data. A confidence interval with a particular confidence level (95% selected by the
user) is intended to give the assurance that, if the statistical model is correct then the
interval could deliver the true value.
Confidence interval for a normal population,
Where = Sample mean
= upper critical value of standard normal distribution
N = Size of sample
25
2.1 DRUG PROFILE
2.1.1 TOLPERISONE HYDROCHLORIDE 20, 21
Molecular structure:
Chemical name:
2-methyl-1-(4-methylphenyl)-3-(1-piperidyl) propan-1-one
Molecular Formula:
C16H23NO
Molecular Weight:
281.81 g/mol.
Category:
Anti-spasmodic
Storage:
26 Description:
White amphorous powder.
Solubility:Freely soluble in water.
Melting Point:
Standard value Observed value*
181-183°C. 182°C.
*Average of six determinations
Pharmacological Parameters:
Side Effects: Adverse effects of Tolperisone includes
In hypersensitivity: muscle weakness, headache, arterial hypotension, nausea, vomiting,
dyspepsia.
Skin allergic reactions: skin rash, hives, Quincke's edema, anaphylactic shock.
Contraindications:
Not to be used during Myasthenia, Children under 1 years of age, Pregnancy,
Breastfeeding.
Interactions:
27 Clinical Pharmacology:
Mechanism of action: Tolperisone suppressed the spinal monosynaptic reflex
transmission invivo as well as invitro by both presynaptic and postsynaptic mechanisms.
In general, Tolperisone was more potent inhibitor of the spinal reflexes, showed a
relatively stronger depressant effect on electrical excitability of motoneurones, and on the
A- fibre mediated afferent nerve conduction. On the other hand, both compounds equally
depressed conduction in C-fibres. The ionic mechanisms underlying the effects were
further analyzed by whole cell patch - clamp studies on dorsal root ganglion (DRG) cells
isolated from newborn rats.
Dosage & Administration: It comes as a tablet, and taken with food.
Adult: The recommended dose is 50-150 mg 3 times /day.
Pharmacokinetics:
Drugs are metabolized by the body in much the same way as food, herbals, and
environmental pollutants; they are broken down by liver and gut enzymes or other
mechanisms so they can be absorbed and eliminated in the bile and urine. Enzymes are
available to metabolize specific substances- a medication is referred to as asubstrateof the
28 2.1.2 PARACETAMOL10, 19
Molecular structure:
Chemical Name:
N- (4-hydroxy phenyl) ethanamide.
N- (4-hydroxy phenyl) acetamide.
Molecular Formula:
C8H9NO2
Molecular Weight:
151.17g/mol
Dose:0.5 to 1g up to 4g daily in divided doses
Description:
29 Solubility:
Sparingly soluble in water, freely in alcohol, soluble in acetone and in solution of sodium
hydroxide.
Assay: I.P 1996
Dissolved 0.3g in a mixture of 10 ml water and 30 ml of 2N sulphuric acid. Boiled under
reflux for 1 hr, and diluted to 100 ml with water. To 20 ml of the solution added 40 ml of
water, 40g of ice, 15 ml of 2N Hcl, and 0.1 ml ferroin sulphate solution and titrated with
0.1M Cerric ammonium sulphate until a yellow colour was obtained. Repeated the
procedure without sample being examined. Each ml of 0.1M Cerric Ammonium Sulphate
is Equivalent to 0.00756g of C8H9NO2
Melting Point:
Standard value Observed value*
169°C. 168°C.
*Average of six determinations
Storage Conditions:
Tablet, syrup, suspension: Store in a well closed container, Below 40°C. Protect from
Sunlight and Moisture.
Adverse effects:
In recommended doses, the side effects of Paracetamol are mild to non-existent.
30
risk of upper gastrointestinal complications such as stomach bleeding, and may cause
kidney or liver damage.
Chronic users of Paracetamol May have a higher risk of developing blood cancer.
Overdose
Main article: Paracetamol toxicity
Paracetamol hepatotoxicity is, by far, the most common cause of acute liver failure in both
the United States and the United Kingdom. Toxicity of paracetamol arises often due to its
quinone metabolite. Paracetamol overdose results in more calls to poison control centers in
the US than overdose of any other pharmacological substance. Signs and symptoms of
Paracetamol toxicity may initially be absent or vague. Untreated overdose can lead to liver
failure and death within days. Treatment is aimed at removing the Paracetamol From the
body and replacing glutathione. Activated charcoal can be used to decrease absorption of
Paracetamol if the patient presents for treatment soon after the overdose
Mechanism of Action:
The main mechanism proposed is the inhibition of Cyclooxygenase (COX), and recent
findings suggest that it is highly selective for COX-2. While it has analgesic and
antipyretic properties comparable to those of aspirin or other NSAIDs, its peripheral
anti-inflammatory activity is usually limited by several factors, one of which is the high level of
peroxides present in inflammatory lesions. However, in some circumstances, even
31 2.1.3. SITAGLIPTIN PHOSPHATE20, 24
Chemical Structure:
Chemical Name:
(R)-4-oxo-4-[3-(trifluoromethyl)-5,6-dihydro[1,2,4]triazolo[4,3-a]pyrazin-7(8H)-yl]-1-(2,4,5-trifluorophenyl)butan-2-amine.
Molecular Formula:
C16H15F6N5O .H3PO4.H2O
Molecular Weight:
523.32 g/mol.
Melting point:
Standard value Observed value*
198°C- 202°C. 201°C.
32 Description:
Sitagliptin Phosphate Monohydrate is a white to off-white, crystalline, non hygroscopic
powder.
Solubility:
Soluble in methanol, N, N dimethyl for amide and water. Insoluble in isopropanol
Storage:
Store at 20°C
Adverse effects:
In clinical trials, adverse effects were as common with Sitagliptin (whether used alone or
with metformin or Pioglitazone) as they were with placebo, except for extremely
rare nausea and common cold-like symptoms. There is no significant difference in the
occurrence of hypoglycaemia between placebo and Sitagliptin.
Side effects:
Signs of an allergic reaction: hives; difficulty breathing; swelling of face, lips, tongue, or
throat.
Side effect such as: pancreatitis - severe pain in upper stomach spreading to back, nausea
and vomiting, loss of appetite, fast heart rate; or fever, sore throat, and headache with a
severe blistering, peeling, and red skin rash.
Less serious side effects may include: runny or stuffy nose, sore throat; headache; or
33 Drug Interactions:
Sitagliptin is unlikely to interact with most other medications. In fact, there is only one
known drug interaction with Sitagliptin. Taking Sitagliptin and Digoxin (Digitek®,
Lanoxin®) together can slightly increase the level of Digoxin in blood.
Contraindications:
Acute Inflammation of the Pancreas, Recent Operation, Body Temperature More Than 101
Degrees F, Injury, Infection, Low Blood Sugar, Moderate to Severe Kidney Impairment.
Mechanism of action:
Sitagliptin works to competitively inhibit the enzyme dipeptidyl peptidase 4 (DPP-4). This
enzyme breaks down the in cretins GLP-1 and GIP, gastrointestinal hormones released in
response to a meal. By preventing GLP-1 and GIP inactivation, they are able to increase
the secretion of insulin and suppress the release of glucagon by the pancreas. This drives
blood glucose levels towards normal. As the blood glucose level approaches normal, the
amounts of insulin released and glucagon suppressed diminishes, thus tending to prevent
an "overshoot" and subsequent low blood sugar (hypoglycaemia) which is seen with some
other oral hypoglycaemic agents.
Sitagliptin is recommended as a second line drug (in combination with other drugs) after
the treatment based on a combination of diet and metformin fails.
Pharmacokinetics:
Oral absorption of Sitagliptin is found to be 87%. Volume of distribution is found
34
CYP3A4 and CYP2C8. Renal Excretion accounts for primarily active tubular secretion
and plasma half life is 8-14 hour
2.1.4 SIMVASTATIN20, 21
Chemical Structure:
Chemical Name:
(1S, 3R, 7S, 8S,
8aR)-8-{2-[(2R,4R)-4-hydroxy-6-oxotetrahydro-2H-pyran-2-yl]ethyl}-3,7-dimethyl-1,2,3,7,8,8a-hexahydronaphthalen-1-yl 2,2dimethylbutanoate.
Molecular Formula:
C25H38O5
Molecular Weight:
418.566 g/mol
Melting Point:
Standard value Observed value*
135°C- 138°C. 136°C.
35 Description:
White Amorphorous powder
Solubility:
Insoluble in water, soluble in Methanol
Storage:
Store below 40°C. Protect from Sunlight and Moisture.
Side Effects:
The severe or irreversible adverse effects of Simvastatin, which give rise to further
complications, include acute renal failure.
The symptomatic adverse reactions produced by Simvastatin, can be treated
symptomatically, these include Flatulence, Headache, Fatigue, Nausea, Diarrhoea,
Constipation, Abdominal pain, Elevation of liver enzymes, Myopathy, Rhabdomyolysis,
Muscle tenderness, Increased intracranial pressure, Hepatitis, Pancreatic.
Contraindications:
Simvastatin is contraindicated with pregnancy, breast feeding and liver disease. Pregnancy
must be avoided while on Simvastatin due to potentially severe birth defects. Patients
cannot breast feed while on Simvastatin due to potentially disrupting the infant's lipid
metabolism. Simvastatin is also contraindicated with Amlodipine and should not exceed a
36 Mechanism of Action:
HMG CoA reductase inhibitors competitively inhibit the activity of HMG CoA reductase,
the rate-limiting enzyme in cholesterol synthesis. Inhibition of this enzyme results in a
transient, modest decrease in cellular cholesterol concentration. The decrease in cholesterol
concentration activates a cellular signalling cascade culminating in the activation of sterol
regulatory element binding protein (SREBP), a transcription factor that up-regulates
expression of the gene encoding the LDL receptor. Increased LDL receptor expression
causes increased uptake of plasma LDL, and consequently decreases plasma
LDL-cholesterol concentration. Approximately 70% of LDL receptors are expressed by
hepatocytes, with the remainder expressed by a variety of cell types in the body.
Pharmacokinetics:
Oral absorption of Simvastatin is found to be 42.5% ±42.5. Volume of distribution is found
to be 98% and plasma protein binding is ~95%. Presystemic metabolism is noted to be
83% ±7 and metabolism is reported Hepatic. Renal Excretion accounts for 13% and
37 2.1.5. THIOCOLCHICOSIDE21, 24
Chemical Structure:
Molecular Formula:
C27H33NO10S
Chemical name:
N-[(7S)-3-(beta-D-glucopyranosyloxy)-1,2-dimethoxy-10(methylsulfanyl)-9-oxo-5,6,7,9-tetrahydrobenzo[a]heptalen-7-yl]acetamide
Molecular Weight:
38 Melting Point:
Standard value Observed average value*
208 ºC – 213ºC 211ºC
*Average of six observations
Description:
Yellow crystalline powder
Solubilit