White Rose Research Online URL for this paper:
http://eprints.whiterose.ac.uk/137339/
Version: Published Version
Monograph:
Castelli, Adriana orcid.org/0000-0002-2546-419X and Nizalova, Olena Yelena (2011)
Avoidable mortality : what it means and how it is measured. Discussion Paper. CHE
Research Paper . Centre for Health Economics, University of York , York, UK.
[email protected] https://eprints.whiterose.ac.uk/ Reuse
Items deposited in White Rose Research Online are protected by copyright, with all rights reserved unless indicated otherwise. They may be downloaded and/or printed for private study, or other acts as permitted by national copyright laws. The publisher or other rights holders may allow further reproduction and re-use of the full text version. This is indicated by the licence information on the White Rose Research Online record for the item.
Takedown
If you consider content in White Rose Research Online to be in breach of UK law, please notify us by
Avoidable Mortality: What it Means and
How it is Measured
Avoidable mortality: what it means and how it
is measured
Adriana Castelli
1Olena Nizalova
21 Centre for Health Economics, University of York, UK 2
Kyiv School of Economics and Kyiv Economics Institute
CHE Discussion Papers (DPs) began publication in 1983 as a means of making current research material more widely available to health economists and other potential users. So as to speed up the dissemination process, papers were originally published by CHE and distributed by post to a worldwide readership.
The CHE Research Paper series takes over that function and provides access to current research output via web-based publication, although hard copy will continue to be available (but subject to charge).
Acknowledgements
Thanks are due to Chris Bojke and Andrew Street. The project was funded by the Department of Health in England as part of a programme of policy research at the Centre for Health Economics, University of York. The views expressed are those of the authors and may not reflect those of the funder.
Disclaimer
Papers published in the CHE Research Paper (RP) series are intended as a contribution to current research. Work and ideas reported in RPs may not always represent the final position and as such may sometimes need to be treated as work in progress. The material and views expressed in RPs are solely those of the authors and should not be interpreted as representing the collective views of CHE research staff or their research funders.
Further copies
Copies of this paper are freely available to download from the CHE website
www.york.ac.uk/che/publications/ Access to downloaded material is provided on the understanding that it is intended for personal use. Copies of downloaded papers may be distributed to third-parties subject to the proviso that the CHE publication source is properly acknowledged and that such distribution is not subject to any payment.
Printed copies are available on request at a charge of £5.00 per copy. Please contact the CHE Publications Office, email [email protected], telephone 01904 321458 for further details.
Centre for Health Economics Alcuin College
University of York York, UK
www.york.ac.uk/che
We explore in this research paper the concept of avoidable mortality and how the way it is measured has evolved over time. Starting from an earlier review by Nolte and McKee (2004), we review the empirical studies which have been produced since then. Finally we appraise the empirical applications of the most recent literature. The concept of “avoidable mortality” refers, broadly speaking, to all those deaths that, given current medical knowledge and technology, could be avoided by the healthcare system through either prevention and/or treatment. It originates from the pioneering work by Rutstein, Berenberg et al. (1976) which introduced the notion of „unnecessary untimely deaths‟ as a new way to measuring the quality of medical care.
The most recent empirical literature shows that the notion of avoidable mortality continues to be used to establish the extent to which people are dying from amenable conditions within and/or across countries and over time, and whether socio-economic status and ethnicity are related to mortality from amenable conditions. Most studies use data taken from national death registries, with only two which link the concept of avoidable mortality to routinely collected administrative data of healthcare provision, such as hospitals. A number of criticisms are raised, with probably the most remarkable being the lack of association found between avoidable mortality and healthcare inputs. No study has actually attempted to use the concept of avoidable mortality within the original aim envisaged by Rutstein, i.e. as a quality indicator of healthcare provision.
The concept of “avoidable mortality” refers, broadly speaking, to all those deaths that, given current medical knowledge and technology, could be avoided by the healthcare system through either prevention and/or treatment. It originates from the pioneering work by Rutstein, Berenberg et al. (1976) which introduced the notion of „unnecessary untimely deaths‟ as a new way to measuring the quality of medical care (healthcare). They proposed a list of 91 conditions –„sentinel health events‟ – for which death should not occur if „timely and effective‟ healthcare is provided. Any unnecessary disease, disability or unnecessary untimely deaths that occur for any „sentinel health events‟ is included in a negative index to measure the (poor) quality of healthcare and should be further investigated (Rutstein, Berenberg et al. 1976).
A number of different lists of conditions1 has since been produced and updated over time. Likewise, a considerable number of empirical studies have been implemented for various countries, socio-economic groups and time periods.
The goals of this paper are (1) to describe the concept of avoidable mortality and the evolution of the way it has been measured along with the most recent criticisms, (2) to review the empirical studies which have been produced since year 2004, updating the earlier review by Nolte and McKee (2004) and (3) to appraise the recent empirical applications.
1
2. The concept of avoidable mortality
2.1 Health production process and avoidable mortality
Figure 1 describes the health production process and introduces the concept of avoidable mortality. Public Health programs and policies may have an impact on parental investments in health and education, but also may have an influence through the education of an individual, mass-media and environmental factors, as well as directly. All these factors along with the overall population health and individual health endowment at birth play a role in the formation of an individual‟s health beliefs, health behaviour and level of concern about health. Given these characteristics and the availability and costs of preventive and screening technology, an individual decides whether to engage in preventive behaviour and/or undergo screening and early diagnostics. Two outcomes are possible at this stage –either “good health” or contraction of a “disease”. If the contracted disease is classified as “amenable to health policy”, then a death from this condition is considered “avoidable” no matter whether the condition is “amenable to medical care” or not. Among the conditions which cannot be prevented through health policies are some which can be successfully treated (“amenable to medical care”). A death from one of such conditions is also considered “avoidable”. Only a death from conditions which neither could be prevented nor treated is thought to be unavoidable and should not be viewed as reflective of the quality of a healthcare system.
2.2 The concept of ‘avoidable mortality’ and its evolution over time
The first studies that concerned themselves with the concept of the „avoidability‟ of deaths date back to the early 20th century, when cases of maternal deaths were investigated as „confidential enquiries‟ in the UK (MacFarlane 2004) and later in the USA, with the New York Academy of Medicine investigating maternal deaths in New York City. These investigations are believed to have played an important role in saving maternal lives (Holland 2009).
However, it was only in the 70s that a thorough investigation into the causes of deaths was carried out by a group of researchers based in the United States and led by Rutstein (1976). Experts from medicine, epidemiology, public health and related fields worked together to identify a number of conditions for which death or disability should not occur if timely and effective medical care is administered. The group suggested that any „unnecessary disease or disability and unnecessary untimely death‟ that occurs in these conditions should serve as a warning signal, a “sentinel health event”, of the poor quality of healthcare received. Three separate sets of conditions were identified. The first set included 91 conditions, which were identified as “clear-cut immediate use” indices of the quality of healthcare and have been referred to as “single-case indexes” (Carr, Szapiro et al. 1989). It was suggested that even one case of death within this list should be thoroughly investigated. The second set of conditions was identified as “limited use”, for which a number of deaths (rather than a single event) should justify further investigation. These are also known as “indexes based on rates” (Carr, Szapiro et al. 1989). The third set included medico-social problems, which Rutstein and colleagues identified as the set demanding further work and clarification given that the medical knowledge of the time did not allow determining with certainty the contributions that healthcare could make in avoiding deaths from these conditions. Rutstein‟s original list was based on version 8 of the International Classification of Disease coding system.
Figure 1. Individual and healthcare factors and avoidability of death Socio-economic
background/ Parental investments
Education Mass-media Environmental factors
PUBLIC HEALTH PROGRAMS AND POLICIES
INDIVIDUAL
(health endowment at birth)
- health beliefs
- health behaviour
- level of concern about health
POPULATION HEALTH STATUS
Diseases not amenable to public policies/
programs (non-preventable)
Not amenable to medical care
Amenable to medical care
NON-AVOIDABLE
DEATH
Preventive behavior/ screening/ diagnostics
Healthcare - costs (travel time, waiting time, out-of-pocket costs, convenience) - existence of treatment technologies Healthcare
- costs of
prevention (travel time, waiting time, out-of-pocket costs, convenience) - existence of screening/ preventive technologies
Diseases amenable to public policies/
programs/ (preventable
)
Not amenable to medical
care
Death amenable
to health policy
(HPI)
Survival Survival
Good health
Disease
Survival
Death
amenable
to medical
care (
MCI
)
The concept of avoidable mortality refers, therefore, to all those deaths that, given current medical knowledge and technology, could be avoided by the healthcare system through either prevention and/or treatment. It follows clearly that the selection of conditions/diseases that are amenable to both healthcare treatment and prevention depends on the particular circumstances of any given country at any given point in time. Some of the deaths which are considered avoidable today in a developed country, half a century ago might well have been unavoidable (Dahl, Hofoss et al. 2007). Likewise, given the state of healthcare systems in the developing nations, many of the diseases for which the cure exists somewhere may be yet unavailable in this particular country. If the goal is to compare various countries and produce ranking of the healthcare systems using avoidable mortality as a measure of quality of service, this definition then might be problematic. The thing is that nowadays in the era of globalization and openness most technologies, especially health-related, are tradable. Therefore, what constrains less developed countries from using superior technologies is lack of resources or regulatory deficiencies not the technologies‟ availability (Tang, Petrie et al. 2009).
Rutstein et al. (1976) adopted the broadest definition of medical care, identifying 91 conditions leading to unnecessary untimely deaths. Charlton et al. (1983) narrowed the scope to medical interventions only, excluding conditions which depended mainly on prevention (e.g. lung cancer). They also set age limits for each condition, whilst excluding some conditions for which there were fewer than 200 deaths within the 5-year age groups in England and Wales. They identified 14 disease groups. The exclusion restrictions were justified by the fact that the authors analysed the conditions separately at the level of Area Health Authorities. Some later studies (Mackenbach, Looman et al. 1988; Schwartz, Kofie et al. 1990; Wood, Sallar et al. 1999) also used Charlton et al.‟s list (1983) without questioning the inclusion criteria.
Poikolainen and Eskola (1986; 1988) also based their list of conditions on Rutstein‟s list but excluded one condition, which they thought to be outside the control of health services in Finland, and grouped the remaining ones into 70 „amenable‟ conditions and 20 „partly amenable‟ conditions.
Holland et al. (1988; 1991; 1997) in their compilation of the European Community Atlas of Avoidable Deaths adopted the concept of avoidable mortality using as a starting point the work by Charlton et al. (1983). They identified 17 disease groups, considered to be either preventable or treatable by healthcare services. They also introduced age limits (5 to 64) for most conditions with the exception of measles and respiratory disease (1-14), tetanus (0-64), cancer of cervix uteri and cirrhosis of liver (15-64), whooping cough (0-14), osteomyelitis (1-64), and maternal conditions (no age limit).
Westerling and others (Westerling 1992; Westerling 1993; Westerling, Gullberg et al. 1996) were the first to introduce explicit comparisons of preventable versus treatable conditions, whilst Simonato et al. (1998) started differentiating between mortality amenable to primary prevention, early detection and treatment, and mortality amenable to improved treatment and medical care. Tobias and Jackson (2001) broadened the list of conditions substantially by reviewing the literature on medical advances since 1980s. They also increased the age limit to 75, and assigned relative weights to primary, secondary and tertiary prevention. However, this latter approach has not been followed in subsequent studies. The most influential methodological studies involved either consultations with experts from various fields of medicine, a systematic review of the relevant literature to update the list according to the most recent medical advances (Nolte and McKee 2004) or both (Page, Tobias et al.
Box 1
Avoidable mortality: causes of deaths that are considered amenable to both medical intervention and health policy.
Treatable causes or medical care indicators (MCI): causes of deaths amenable to medical intervention only.
consultations and the criteria used to eventually reach an agreement in the event of differences in opinions. The only exception is the work by Page, Tobias et al. (2006) where the authors provide the rationale for including various causes into the list.
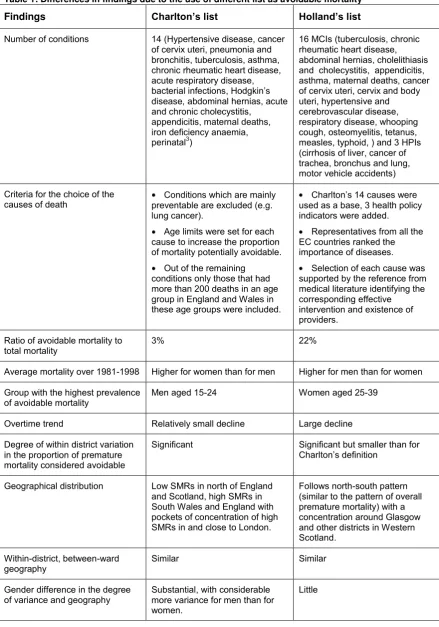
The variety of approaches to defining and identifying causes of death that are avoidable poses a number of challenges as patterns and trends of “avoidable mortality can be very sensitive to the use of different lists of causes of deaths (French and Jones 2006). The following table shows these differences by using the study by French and Jones (2006). The authors consider geographical trends in mortality over the period from 1981 to 1998 in Great Britain using both Charlton‟s et al.‟s list (1983) and Holland‟s lists (1988). They find that both average trends and spatial patterns vary greatly between the two lists. Since the Holland‟s list is longer, it classifies a higher proportion of deaths as „avoidable‟ –22% compared to 3% following the Charlton‟s list. Table 1 summarizes the difference in the lists and major findings.
An entirely different approach to the measurement of avoidable mortality worth mentioning is the one adopted by a group of researchers from Australia (Tang, Chin et al. 2008; Petrie, Tang et al. 2009;Tang, Petrie et al. 2009). They consider the world population as a whole and identify for each age-gender group the country with the lowest risk of mortality in that particular age-gender group. This risk of mortality is then considered as the level of mortality that is unavoidable. In this way they construct an unavoidable risk profile for all age and gender groups for a hypothetical „reference‟ country. The product of the population size in an age-gender group of a particular country and the risk of death from the reference distribution produces the number of unavoidable deaths in this country. Finally, the difference between the actual number of deaths and the number of calculated unavoidable deaths gives the number of deaths which could have been avoided in this country if it had as many resources and used them as effectively as the reference country (Tang, Petrie et al. 2009). However, this approach is subject to a number of limitations imposed by the availability of the data and strong underlying assumptions.
In summary, the way avoidable mortality is measured has undergone considerable changes over time, largely to reflect advances in medical knowledge and technology and to incorporate improvements in life expectancy, and across countries, mainly to adapt the list of amenable conditions to the characteristics of a specific country and/or to overcome data limitations.
2
Table 1: Differences in findings due to the use of different list as avoidable mortality
Findings Charlton’s list Holland’s list
Number of conditions 14 (Hypertensive disease, cancer of cervix uteri, pneumonia and bronchitis, tuberculosis, asthma, chronic rheumatic heart disease, acute respiratory disease, bacterial infections, Hodgkin‟s disease, abdominal hernias, acute and chronic cholecystitis,
appendicitis, maternal deaths, iron deficiency anaemia, perinatal3)
16 MCIs (tuberculosis, chronic rheumatic heart disease, abdominal hernias, cholelithiasis and cholecystitis, appendicitis, asthma, maternal deaths, cancer of cervix uteri, cervix and body uteri, hypertensive and cerebrovascular disease, respiratory disease, whooping cough, osteomyelitis, tetanus, measles, typhoid, ) and 3 HPIs (cirrhosis of liver, cancer of trachea, bronchus and lung, motor vehicle accidents)
Criteria for the choice of the causes of death
Conditions which are mainly preventable are excluded (e.g. lung cancer).
Age limits were set for each cause to increase the proportion of mortality potentially avoidable.
Out of the remaining conditions only those that had more than 200 deaths in an age group in England and Wales in these age groups were included.
Charlton‟s 14 causes were used as a base, 3 health policy indicators were added.
Representatives from all the EC countries ranked the importance of diseases.
Selection of each cause was supported by the reference from medical literature identifying the corresponding effective intervention and existence of providers.
Ratio of avoidable mortality to total mortality
3% 22%
Average mortality over 1981-1998 Higher for women than for men Higher for men than for women
Group with the highest prevalence of avoidable mortality
Men aged 15-24 Women aged 25-39
Overtime trend Relatively small decline Large decline
Degree of within district variation in the proportion of premature mortality considered avoidable
Significant Significant but smaller than for Charlton‟s definition
Geographical distribution Low SMRs in north of England and Scotland, high SMRs in South Wales and England with pockets of concentration of high SMRs in and close to London.
Follows north-south pattern (similar to the pattern of overall premature mortality) with a concentration around Glasgow and other districts in Western Scotland.
Within-district, between-ward geography
Similar Similar
Gender difference in the degree of variance and geography
Substantial, with considerable more variance for men than for women.
Little
3
mpirical research on ‘avoidable mortality’
3.1 Later empirical studies
Although there is no unanimous view in the literature on the ways of defining and measuring avoidable mortality, the concept itself is quite useful as it offers a relatively simple way to evaluate the performance of the healthcare sector. In this context, empirical studies of avoidable/ amenable mortality provide useful information on differences in this health outcome along various dimensions.
Empirical studies on avoidable/amenable mortality have been thoroughly reviewed by Nolte and McKee (2004). An overview of more than 70 studies allowed the authors to generalise findings on the topic up to the year 2004. Most of these studies focus on high-income countries, with a few specifically addressing the situation in the former socialist countries. The studies which focus on geographical variation in avoidable mortality rates, usually find little association between avoidable mortality and quantity (quality) of healthcare services, but significant association with the socio-economic conditions in the region. The studies focusing on socio-demographic variation tend to find that socially disadvantaged/ vulnerable groups are at a higher risk of death from avoidable conditions. Finally, the studies devoted to the analysis of time trends mostly show a consistent decline in avoidable mortality over time, which is more pronounced than the decline in all-cause mortality.
This section revisits the review of empirical studies by Nolte and McKee (2004) and expands on it by analysing more recent empirical literature up until 2010.
The literature search from 2004 onwards identified 39 empirical studies of avoidable mortality. Following Nolte and McKee (2004) the recent studies were analysed using the same structured protocol: (1) study region, (2) time period under investigation, (3) aim of study and definition of avoidable mortality, (4) causes of death and age group(s) under study, (5) analytical design and (6) main results. This information is used to compile the annotated bibliography (similar to the one in Nolte and McKee (2004)) which can be found in the Appendix, Tables A2-A4. Studies are grouped according to their study focus. Within each summary table, papers are sorted in alphabetical order according to the country under the investigation, and the year of publication.
In contrast to the previous empirical literature, the studies from 2004 onwards are much more homogeneous in terms of the selection of causes of deaths and methodological approach. 11 out of the 34 studies are based on Nolte and McKee‟s (2004) list of 33 conditions amenable to medical care and Ischemic Heart Disease (most often analysed separately). Three further studies use the same list, but focus on a selection of causes. One study is based on an earlier version of Nolte and McKee„s (Nolte, Scholz et al. 2002) list, which is 5 conditions shorter. Six studies use one or another variant of Holland‟s lists (1988; 1991; 1997), while six others are based on the work by Tobias and Jackson (2001) and Page, Tobias et al. (2006). There are also studies which analysed either one or a selected number of causes of avoidable mortality (Schwarz and Pamuk 2008; Schwierz and Wübker 2009).
With respect to the method used, 7 studies in our list were based on a cross-sectional analysis, 11 undertook a time trend analysis and 21 studies explored both cross-sectional and time dimensions of avoidable mortality (only two of which exploited the panel nature of the data). 18 studies analysed variation in avoidable/ amenable mortality by socio-demographic characteristics, among which some represent cross-sectional analysis while others study also the variation in time trends. Unlike the previous review, no study presented descriptive analysis at regional/country level at a point in time. Seven country/ regions studies covered considerable time periods. Five studies compared trends in different regions of the same country or across countries.
The list of reviewed studies mostly focused on high income countries (as before) with three evident clusters of „avoidable‟ mortality research: UK (Grant, Munoz-Arroyo et al. 2006; Gubb 2007; Wheller, Baker et al. 2007), Australia and New Zealand (Korda and Butler 2006; Page, Tobias et al. 2006; Korda, Butler et al. 2007; Tobias and Yeh 2007; Li, Gray et al. 2009; Tobias and Yeh 2009), and Spain (Bautista, Alfonso et al. 2005; Gispert, Gervas et al. 2007; Gispert, Serra et al. 2008; Melchor, Nolasco et al. 2008; Nolasco, Melchor et al. 2009). 6 studies either focused or included in the analysis countries of Central and Eastern Europe (Logminiene, Nolte et al. 2004; Newey, Nolte et al. 2004; Nolte, Scholz et al. 2004; Treurniet, Boshuizen et al. 2004; Burcin 2009; Schwierz and Wübker 2009).
Regarding the time period, most studies covered the 1990s and the 2000s, but some authors have extended the analysis further in the past and included data from early 1980s (Nolte, Scholz et al. 2004; Treurniet, Boshuizen et al. 2004; Grant, Munoz-Arroyo et al. 2006; Page, Tobias et al. 2006; Macinko and Elo 2009; Tobias and Yeh 2009) and a few even from 1970s and late 1960s (James, Manuel et al. 2006; Korda and Butler 2006; James, Wilkins et al. 2007). As before, the major theme is documentation of the downward trends in avoidable mortality as measures of quality of healthcare systems and comparison of the relative performance of regions and/or countries in this regard. Compared to the previous literature, there is a sizeable growth in the analysis of socio-economic and demographic disparities in avoidable mortality (18 out of 39 studies reviewed here compared to 11 out of 70 reviewed in Nolte and McKee (2004)). The rest of the section will compare the findings from the previous literature to the most recent ones in more detail.
3.1.1 Geographical variation
Nolte and McKee (2004) reported how avoidable mortality differs geographically, with these variations usually explained in terms of healthcare inputs and socio-economic factors. The results show generally weak and inconsistent associations with healthcare inputs. However, socio-economic factors (e.g. education, unemployment, socio-economic status, income level) were found to be strongly associated with avoidable mortality.
The more recent literature on geographical variation in avoidable mortality mostly focuses on analysing and reporting time trends for various countries; provides ranking of countries with respect to avoidable mortality and/or change in avoidable mortality. The overall trend is that the rates of avoidable mortality have been declining much faster in the last decade of the 20th century and early years of the 21st century. Further, the rates of decline in mortality determined by Schwierz and Wubker (2009) confirm this finding in that they show that the increased use of intra-cardiac catheter facilities (an important diagnostic tool for IHD) is significantly related to decreases in avoidable mortality from IHD.
Several studies found France to have the lowest avoidable mortality rates, while UK and USA are among those with the highest avoidable mortality rates, although they have experienced a considerable decline in this indicator over the recent years. Countries which joined the EU in 2004 have shown considerable improvements with respect to treatable mortality since 2004, and this despite the significant deterioration in health at the start of the transition period. Furthermore, there is a difference observed in the time trends of mortality amenable to medical care and that amenable to health policies. Although the first indicator has been declining over time in all countries studied, mortality amenable to health policies has been declining at a considerably slower pace and in some countries has in fact been on the rise (Newey, Nolte et al. 2004).
As avoidable mortality constitutes deaths that should not occur in the presence of timely healthcare, socio-demographic/economic inequalities in this indicator can be interpreted as stemming from the differential access to healthcare services or differences in the quality of care received by various groups. These studies mostly concern countries with historical ethnic inequalities, but also those which have been experiencing a significant growth of migrant population.
Earlier studies of variation in avoidable mortality by race in the United States have shown a consistent significant difference between whites and non-whites. As Nolte and McKee (2004) summarised, in the 1980s the avoidable/ amenable mortality rates from selected causes were three to nine times higher for African-Americans than for white Americans (2.6 times higher for cervical cancer and 8.9 times higher for tuberculosis). The study by Macinko and Elo (2009), using the Nolte and McKee (2004) list of avoidable causes and covering the period from 1980 to 2005, confirmed this finding. So, in 1980 the ratio of black to white mortality amenable to medical care was 2.9 for men and 2.2 for women. This ratio remained stable up to the year 1998 showing a slight improvement for men only in 1999 (2.6) and 2005 (2.5).
Similarly the ethnicity gap was explored in New Zealand and Australia. Earlier literature found a decline in the ratio of the Maori to non-Maori amenable mortality ratio from 2.3-2.5 to 2 over the period 1968-1987 (Malcolm and Salmond 1993) returning back to 2.5 in 1996-97 (Tobias and Jackson 2001). The findings from the Atlas of Avoidable Deaths for Australia and New Zealand (Page, Tobias et al. 2006) indicate no change in Maori/Europeans (others) amenable mortality ratio up to the year 2001 and reports a worsening of the ratio for avoidable mortality (treatable and preventable) from 2.15 in 1986 to 2.73 in 2001. The same study considered the change in outcomes for Pacific compared to Europeans (others) over the same period. The ratio of Pacific/ Europeans (others) for amenable mortality increased from 1.61 in 1986 to 2.27 in 2001, for avoidable mortality from 1.4 to 2.1. Li et al. (2009) added to this literature by studying the Northern Territories and comparing the avoidable mortality among Aboriginal and Non-Aboriginal population there and with all Australian population. It turned out that among non-Aboriginal NT population avoidable mortality was close to being the same as the overall Australian avoidable mortality (the ratio ranges from 1 to 1.2 over the period from 1985 to 2004). At the same time the ratio of NT Aboriginal population avoidable mortality to that of Australian was consistently increasing over the period from 2.8 to 4.3 for males and from 3.1 to 4.9 for females. This increase was mostly due to the worsening of the differences in mortality amenable to health policies, while the difference in mortality amenable to medical care slightly improved over time.
Stirbu et al. (2006) documented a slightly higher risk in total avoidable mortality for the migrant population in the Netherlands (relative risk of 1.3) with relative risks greater than 3 for all infectious diseases and greater than 1.7 for several chronic conditions including asthma, diabetes and cerebrovascular disorders. Most of the ethnic difference was explained by demographic and socio-economic characteristics of the migrant population relative to the native Dutch.
The literature that provided evidence on inequalities in amenable/avoidable mortality by ethnicity and race was reinforced by the studies of socioeconomic variations in these measures, which support the earlier finding of a significant income gradient in amenable mortality. Two studies used individual level data to compare the likelihood of deaths from avoidable causes depending on socio-economic factors. Hjern, Vinnerljung et al. (2004) found that being a foster child or other welfare recipient increases the likelihood of deaths from suicide or from other avoidable cause even after controlling for the characteristics of the biological mothers. Bautista et al. (2005) in a matched case-control study at a Spanish hospital concluded that the only significant factor in determining the likelihood of death from avoidable causes is education. Individuals with low or middle level of education are at a much greater risk than those with higher levels of education (adjusted odds ratios are 3.6 and 2.8 respectively).
In the earlier literature differences in avoidable/ amenable mortality were also reported between blue and white collar workers, working and non-working population (Westerling, Gullberg et al. 1996).
Table A3 in the Appendix provides information on all studies investigating socio-demographic/ economic variation in avoidable/ amenable mortality.
3.1.3 Time trends
All studies of avoidable mortality generally show a significant decline in mortality from causes amenable to medical care and that this decline is much stronger than the decline in mortality from „non amenable‟ causes. Wheller, Baker et al. (2007) for England and Wales estimated a 3.3-3.6% annual decline in amenable mortality for males and a 2.9-3.2% for females depending on the list of conditions used to measure amenable mortality over the period from 1993 to 2005. This is similar to the estimated annual decline of 3.6% over the period between 1970/74 and 1985/87 for the whole population and is somewhat higher than the 2.7% decline found for the period between 1955/59 and 1970/74 (Boys, Forster et al. 1991). In Australia the average annual decline was 3.5% for males and 3.9 % for females over the period from 1968 to 2001 (Korda and Butler 2006). Similarly, in South Korea the annual decline of 3.7% for mortality from treatable conditions and of 2.4% for mortality from preventable conditions was observed over the period from 1983 to 2004.
A summary of the literature on time trends in avoidable mortality can be found in Table A4 in the Appendix.
3.2 UK studies
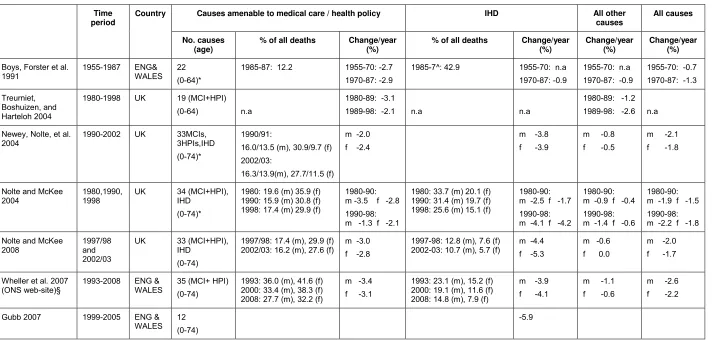
Table 2 summarizes the findings from 7 studies of time trends in amenable mortality measures, however defined, for the United Kingdom. It includes studies that either directly estimated avoidable mortality rates as a percentage of all-cause mortality or that included figures that allowed us to calculate these percentage rates. The studies are from 2004 onwards for the UK or for England and Wales only. In order to compare with previous time periods, the results by Boys, Forster et al. (1991) and Nolte and McKee (2004) are also reported.
Four of the studies focus on very similar conditions considered amenable. These also analyse separately deaths from IHD (Newey, Nolte et al. 2004; Nolte and McKee 2004; Wheller, Baker et al. 2007; Nolte and McKee 2008). Three further studies provide comparable estimates with respect to mortality amenable to medical care from 1980 to 2003, whilst two other studies allow for the comparison of mortality amenable to both medical care and health policies (from 1990 to 2008). In 1980s, avoidable mortality from causes other than the IHD constituted about 20% of all-cause mortality for males and about 36% of that for females. In 2003, these numbers fell to 16% and 28% respectively. Mortality from causes amenable to health policies remained stable or even increased slightly over this time period. For example, Newey, Nolte et al. (2004) show that from 1990/91 to 2002/03 this changed from 13.5% to 13.9% for males and from 9.7% to 11.5% for females. If considered jointly, avoidable mortality (both medical care indicators and health policy indicators) over the period from 1990 to 2008 declined from about 30% for males and 41% for females to about 28% and 32% respectively. Further, avoidable mortality from IHD in 1980 represented 34% of all-cause mortality for males and 20% for females. However, this has changed dramatically over time with the latest estimates being 14.8% for males and 7.9% for females.
Time period
Country Causes amenable to medical care / health policy IHD All other causes
All causes No. causes
(age)
% of all deaths Change/year (%)
% of all deaths Change/year (%)
Change/year (%)
Change/year (%)
Boys, Forster et al. 1991
1955-1987 ENG& WALES
[image:18.842.71.786.89.432.2]22 (0-64)*
1985-87: 12.2 1955-70: -2.7 1970-87: -2.9
1985-7^: 42.9 1955-70: n.a 1970-87: -0.9
1955-70: n.a 1970-87: -0.9
1955-70: -0.7 1970-87: -1.3
Treurniet, Boshuizen, and Harteloh 2004
1980-1998 UK 19 (MCI+HPI)
(0-64) n.a
1980-89: -3.1
1989-98: -2.1 n.a n.a
1980-89: -1.2 1989-98: -2.6 n.a
Newey, Nolte, et al. 2004
1990-2002 UK 33MCIs, 3HPIs,IHD (0-74)*
1990/91:
16.0/13.5 (m), 30.9/9.7 (f) 2002/03:
16.3/13.9(m), 27.7/11.5 (f)
m -2.0 f -2.4
m -3.8
f -3.9
m -0.8 f -0.5
m -2.1 f -1.8
Nolte and McKee 2004
1980,1990, 1998
UK 34 (MCI+HPI), IHD
(0-74)*
1980: 19.6 (m) 35.9 (f) 1990: 15.9 (m) 30.8 (f) 1998: 17.4 (m) 29.9 (f)
1980-90: m -3.5 f -2.8 1990-98: m -1.3 f -2.1
1980: 33.7 (m) 20.1 (f) 1990: 31.4 (m) 19.7 (f) 1998: 25.6 (m) 15.1 (f)
1980-90: m -2.5 f -1.7 1990-98: m -4.1 f -4.2
1980-90: m -0.9 f -0.4 1990-98: m -1.4 f -0.6
1980-90: m -1.9 f -1.5 1990-98: m -2.2 f -1.8
Nolte and McKee 2008
1997/98 and 2002/03
UK 33 (MCI+HPI), IHD
(0-74)
1997/98: 17.4 (m), 29.9 (f) 2002/03: 16.2 (m), 27.6 (f)
m -3.0 f -2.8
1997-98: 12.8 (m), 7.6 (f) 2002-03: 10.7 (m), 5.7 (f)
m -4.4 f -5.3
m -0.6 f 0.0
m -2.0 f -1.7
Wheller et al. 2007 (ONS web-site)§
1993-2008 ENG & WALES
35 (MCI+ HPI) (0-74)
1993: 36.0 (m), 41.6 (f) 2000: 33.4 (m), 38.3 (f) 2008: 27.7 (m), 32.2 (f)
m -3.4 f -3.1
1993: 23.1 (m), 15.2 (f) 2000: 19.1 (m), 11.6 (f) 2008: 14.8 (m), 7.9 (f)
m -3.9 f -4.1
m -1.1 f -0.6
m -2.6 f -2.2
Gubb 2007 1999-2005 ENG & WALES
12 (0-74)
-5.9
4. Some limitations of the empirical application of the concept of ‘avoidable
mortality’
Rutstein‟s seminal idea to use his list of conditions for which death could be avoided by timely and effective healthcare as indicators of the poor quality and effectiveness of healthcare, has over the years received a number of criticisms. In this section, we will briefly summarise some of these criticisms.
One of the most striking criticisms raised is the lack of a significant association found between avoidable mortality rates and healthcare inputs. The main argument posed is that healthcare inputs (e.g. number of doctors and nurses, expenditure, etc.) are not an ideal measure of healthcare as these merely reflect quantity and not the quality of healthcare.
Second, counts of deaths from amenable conditions are taken from death certificates compiled by medical doctors. Hence, some of the differences that we detect both at the country/regional level and over time may be due to dissimilarities in the death certification procedures and in diagnostic patterns (Nolte and McKee 2004). These limitations do not, however, undermine the concept of avoidable mortality itself but rather the use of these statistics as a source of data.
A further drawback of using death registries is that no mention is given to the incidence and severity of the diseases under investigation. In fact, no data on the incidence or severity of the disease seem to be reported in the studies on regional mortality. This poses a significant challenge to the interpretation of time trends and cross-regional differences in avoidable mortality as attributable to differences in healthcare quality. For example, an increase in the mortality rate due to tuberculosis/other disease in developed countries may be related to an increase in the incidence of the disease, for example due to immigration from countries with a high incidence of TB, and this certainly should not be attributed to a decline in the quality of healthcare. Further, the severity of a disease may be due to individuals‟ health-seeking behaviour, which may also vary by region and/or over time. Although this kind of behaviour may be affected by active health promoting policies, it is to a great extent outside the scope and control of healthcare providers. Despite these concerns, studies which do control for the incidence of a disease as measured from hospital discharge data (Carr, Szapiro et al. 1989; Treurniet, Looman et al. 1999) find a significant degree of variation in avoidable mortality, which is not explained by its incidence for the majority of conditions.
Another problem is posed by the introduction of somewhat arbitrary age limits. Rutstein‟s et al. list (1976) already contains some restrictions by age: e.g. only deaths occurring to people younger than 50 years from acute respiratory infections, influenza, pneumonia, and bronchitis are considered avoidable. Later studies imposed age limits on most conditions and these have been increasing over time. Unfortunately, these impositions and extensions of age limits seem to be poorly justified. Most studies do not provide any rationale for the age limits, while explanations of others could be questioned. For example, Charlton et al. (1983) set the age limits for each cause “to increase the proportion of mortality potentially avoidable”, Holland (1986) – to improve “validity of mortality as an indicator of health service outcome”. Nolte and McKee (2004) justify the setting of age limits for hypertension and stroke by referring to two large studies of systolic hypertension which summarized the existing evidence from clinical and epidemiological observational studies. However, this is provided only as an example and age limits for other conditions are simply chosen to “reflect increasing expectation of life” and to acknowledge the problem with the reliability of death certification at older ages. At the same time they confirm that the imposition of age limits should be an important issue in the debate on avoidable mortality that had not yet been properly addressed. A later study by Page et al. (2006) provides the following general arguments for further extending the age limit: (i) increase in overall life expectancy (now about 80 years in developed countries), (ii) better health at older age (probably relating to fewer comorbidities), and (iii) better coding “which allowed a single cause to be coded for most deaths” in spite of multiple comorbidities.
Jackson (2001) used experts‟ opinions to assign weights for primary, secondary, and tertiary avoidable mortality, with primary being due to wider healthcare policies and prevention. The problem with these partial „avoidability‟ weights is that often the authors do not provide the grounds for assigning them, referring at best to expert opinion. One of the conditions that poses most difficulties in this respect is Ischemic Heart Disease (IHD), given that medical knowledge in this area has been growing rapidly in recent years. Ideally one would like to have a systematic review of the medical literature, both experimental and epidemiological, on each of the avoidable mortality conditions so that an informed decision can be made on the appropriate degree of avoidability to assign to each condition. Nolte and McKee (2004) provide a review of the medical and epidemiological literature on the effectiveness of treatment for IHD and stroke, indicating for each the percentages of the effectiveness of various treatment. However, their review is far from being systematic. Based on the uncertainty surrounding the beneficial effects of healthcare on IHD, the authors choose to analyse it separately. Some later studies (e.g. Page, Tobias et al. (2006)) based their choices of the degree of avoidability on Nolte and McKee‟s conclusions, claiming that 50% of mortality due to IHD should be considered avoidable.
5. Conclusions and future work
This review of the literature has described the concept of avoidable mortality from its first inception to more recent days and summarised its empirical applications, following Nolte and McKee‟s extensive review of 2004, to which this review poses as an important update.
We found that the empirical applications of the notion of avoidable mortality have been widely used to establish the extent to which people are dying from amenable conditions within and/or across countries and over time, and whether socio-economic status and ethnicity are related to mortality from amenable conditions. Most studies have used data drawn from national death registries, with only two which to our knowledge have attempted to link the concept of avoidable mortality to routinely collected administrative data of healthcare provision, such as hospitals. A number of criticisms have been raised, with probably the most remarkable being the lack of association found between avoidable mortality and healthcare inputs. None have actually attempted to use the concept of avoidable mortality within the original aim envisaged by Rutstein, i.e. as a quality indicator of healthcare provision.
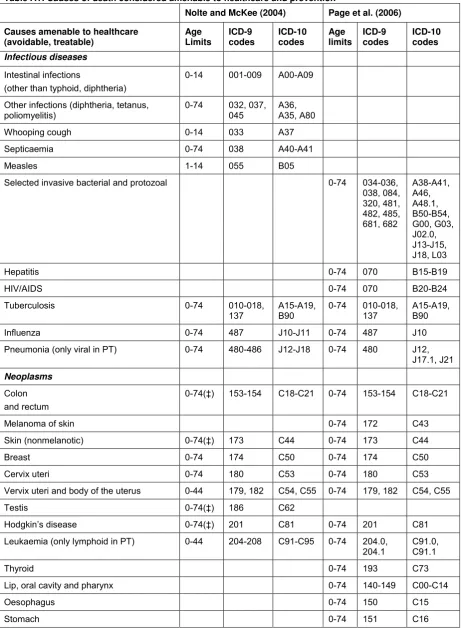
Table A1: Causes of death considered amenable to healthcare and prevention
Nolte and McKee (2004) Page et al. (2006)
Causes amenable to healthcare (avoidable, treatable)
Age Limits
ICD-9 codes
ICD-10 codes
Age limits
ICD-9 codes
ICD-10 codes
Infectious diseases
Intestinal infections
(other than typhoid, diphtheria)
0-14 001-009 A00-A09
Other infections (diphtheria, tetanus, poliomyelitis)
0-74 032, 037, 045
A36, A35, A80
Whooping cough 0-14 033 A37
Septicaemia 0-74 038 A40-A41
Measles 1-14 055 B05
Selected invasive bacterial and protozoal 0-74 034-036, 038, 084, 320, 481, 482, 485, 681, 682
A38-A41, A46, A48.1, B50-B54, G00, G03, J02.0, J13-J15, J18, L03
Hepatitis 0-74 070 B15-B19
HIV/AIDS 0-74 070 B20-B24
Tuberculosis 0-74 010-018,
137
A15-A19, B90
0-74 010-018, 137
A15-A19, B90
Influenza 0-74 487 J10-J11 0-74 487 J10
Pneumonia (only viral in PT) 0-74 480-486 J12-J18 0-74 480 J12, J17.1, J21
Neoplasms
Colon and rectum
0-74(‡) 153-154 C18-C21 0-74 153-154 C18-C21
Melanoma of skin 0-74 172 C43
Skin (nonmelanotic) 0-74(‡) 173 C44 0-74 173 C44
Breast 0-74 174 C50 0-74 174 C50
Cervix uteri 0-74 180 C53 0-74 180 C53
Vervix uteri and body of the uterus 0-44 179, 182 C54, C55 0-74 179, 182 C54, C55
Testis 0-74(‡) 186 C62
Hodgkin‟s disease 0-74(‡) 201 C81 0-74 201 C81
Leukaemia (only lymphoid in PT) 0-44 204-208 C91-C95 0-74 204.0, 204.1
C91.0, C91.1
Thyroid 0-74 193 C73
Lip, oral cavity and pharynx 0-74 140-149 C00-C14
Oesophagus 0-74 150 C15
Nolte and McKee (2004) Page et al. (2006)
Causes amenable to healthcare (avoidable, treatable)
Age Limits
ICD-9 codes
ICD-10 codes
Age limits
ICD-9 codes
ICD-10 codes
Liver 0-74 155 C22
Lung 0-74 162 C33, C34
Bladder 0-74 188 C67
Benign 0-74 210-229 D10-D26
Nutritional, endocrine and metabolic conditions
Diseases of the thyroid 0-74 240-246 E00-E07 0-74 240-246 E00-E07
Diabetes mellitus 0-49 250 E10-E14 0-74(§)
250 E10-E14
Neurological disorders
Epilepsy 0-74 345 G40-G41 0-74 345 G40-G41
Circulatory diseases
Rheumatic heart disease (Only Chronic in NM)
0-44(‡) 393-398 I05-I09 0-74 390-398 I01-I09
Hypertensive disease 0-74 401-405 I10-I13, I15
0-74 402 I11
Ischaemic heart disease 0-74($) 410-414 I20-I25 0-74(§)
410-414 I20-I25
Cerebrovascular disease 0-74 430-438 I60-I69 0-74(§)
430-438 I60-I69
Aortic aneurysm 0-74 441 I71
All respiratory diseases (excluding pneumonia /influenza)
1-14 460-479, 488-519
J00-J09, J20-J99
Digestive disorders
Peptic ulcer 0-74 531-533 K25-K27 0-74 531-534 K25-K28
Appendicitis 0-74 540-543 K35-K38 0-74 540-543 K35-K38
Abdominal hernia 0-74 550-553 K40-K46 0-74 550-553 K40-K46
Cholelithiasis (& cholecystitis) 0-74 574-575.1
K80-K81 0-74 574-575.1
K80-K83, K85, K86, K91.5
Chronic liver diseases (excluding alcohol related)
0-74 571.4-571.9
K73, K74
Genitourinary disorders
Nephritis and nephrosis 0-74 580-589 N00-N07, N17-N19, N25-N27
0-74 403, 580-589, 591
I12, I13, N00-N09, N17-N19
Obstructive uropathy 0-74 592,
593.7, 594, 598, 599.6
N13, N20, N21, N35, N99.1
Benign prostatic hyperplasia 0-74 600 N40
Maternal and infant causes
Causes amenable to healthcare (avoidable, treatable)
Age Limits
ICD-9 codes
ICD-10 codes
Age limits
ICD-9 codes
ICD-10 codes
Birth defects 0-74 237.70,
740-760
H31.1, P00, P04, Q00-Q99
Congenital cardiovascular anomalies 0-74 745-747
Q20-Q28
Perinatal deaths all causes excluding stillbirths
all ages 760-779
P00-P96, A33, A34
0-74 764-779 P03, P05-P95
Respiratory diseases
DVT with pulmonary embolism 0-74 415.1,
451.1
I26, I80.2
COPD 45-74 490-492,
496
J40-J44
Asthma 0-44 493 J45, J46
Misadventures to patients during surgical
and medical care all ages(‡)
E870-E876, E878-E879
Y60-Y69, Y83-Y84
Drug use disorders
Alcohol related disease 0-74 291, 303,
305.0, 425.5, 535.3, 571.0-571.3
F10, I42.6, K29.2, K70
Illicit drug use disorders 0-74 292, 304,
305.2-305.9
F11-F16, F18, F19
Unintentional injuries
Road traffic injuries 0-74
E810-E819
V01-V04, V06, V09-V80, V87, V89, V99
Falls 0-74
E880-E886, E888
W00-W19
Fires and burns 0-74
E890-E899
X00-X09
Accidental poisoning 0-74
E850-E869
X40-X49
Drownings 0-74 E910 W65-W74
Intentional injuries
Suicide and self-inflicted injuries 0-74 E950-E959, E980-E989
X60-X84, Y87.0, Y10-Y34
Violence 0-74
E960-E969
X85-Y09, Y87.1
(‡) condition not included as „amenable condition‟ in Denmark, Finland and Sweden (Nolte and McKee, 2004)
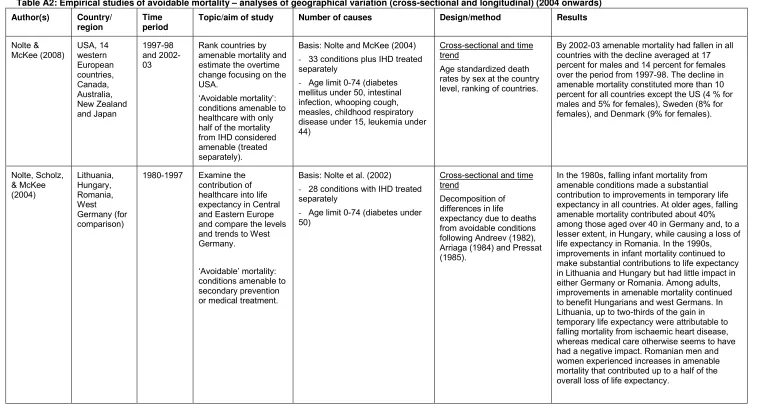
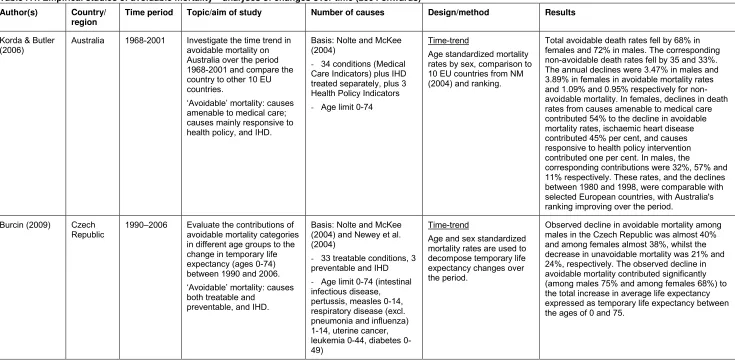
Table A2: Empirical studies of avoidable mortality – analyses of geographical variation (cross-sectional and longitudinal) (2004 onwards)
Author(s) Country/ region
Time period
Topic/aim of study Number of causes Design/method Results
Nolte & McKee (2008) USA, 14 western European countries, Canada, Australia, New Zealand and Japan 1997-98 and 2002-03
Rank countries by amenable mortality and estimate the overtime change focusing on the USA.
„Avoidable mortality‟:
conditions amenable to healthcare with only half of the mortality from IHD considered amenable (treated separately).
Basis: Nolte and McKee (2004)
- 33 conditions plus IHD treated separately
- Age limit 0-74 (diabetes mellitus under 50, intestinal infection, whooping cough, measles, childhood respiratory disease under 15, leukemia under 44)
Cross-sectional and time trend
Age standardized death rates by sex at the country level, ranking of countries.
By 2002-03 amenable mortality had fallen in all countries with the decline averaged at 17 percent for males and 14 percent for females over the period from 1997-98. The decline in amenable mortality constituted more than 10 percent for all countries except the US (4 % for males and 5% for females), Sweden (8% for females), and Denmark (9% for females).
Nolte, Scholz, & McKee (2004) Lithuania, Hungary, Romania, West Germany (for comparison)
1980-1997 Examine the contribution of healthcare into life expectancy in Central and Eastern Europe and compare the levels and trends to West Germany.
„Avoidable‟ mortality:
conditions amenable to secondary prevention or medical treatment.
Basis: Nolte et al. (2002)
- 28 conditions with IHD treated separately
- Age limit 0-74 (diabetes under 50)
Cross-sectional and time trend
Decomposition of differences in life expectancy due to deaths from avoidable conditions following Andreev (1982), Arriaga (1984) and Pressat (1985).
region period Treurniet, Boshuizen, & Harteloh (2004) 15 EU countries, the Czech Republic and Hungary
1980-1997 Analyse international variations of trends in
„avoidable mortality‟. „Avoidable‟ mortality:
causes amenable to both medical care interventions and national health policies.
Basis: Holland‟s list (1988, 1993) - 19 causes
- Age limit 0-64
Cross-sectional and time trend
Age and sex directly standardized mortality rates (using European standard population) are studied employing a multilevel (random slope) model to estimate both a general Europe-wide trend and individual differences in trends among countries in AM.
Avoidable mortality declined (1980–1997) in all the countries except Hungary. The difference between the trends in avoidable and non-avoidable mortality was small (-2.4% compared to -1.5% per year. The largest trend variations between countries are attributable to causes mainly or partly amenable to prevention. For five of the 19 causes of death the international variations decreased over time. Various countries show trends that deviate significantly from the mean trend.
Newey, Nolte, et al. (2004)
25 EU member states, Bulgaria and Romania
1990-2002 Examine the trends in treatable and
preventable mortality in 25 EU member states and 2 candidate countries between 1990 and 2002.
„Avoidable‟ mortality:
treatable mortality, preventable mortality and IHD.
Basis: Nolte and McKee (2004)
- 33 treatable conditions, 3 preventable and IHD
- Age limit 0-74 (intestinal infections, whooping cough 0-14, measles, respiratory disease (excl. pneumonia and influenza) 1-14, uterine cancer, leukemia 0-44, diabetes 0-49, maternal, perinatal deaths, misadventures to patients during surgical and medical care – All)
Cross-sectional and time trend
Age standardized avoidable mortality rates by gender are compared between 1990/91 and 2000/01/02 for 25 EU member states, Bulgaria and Romania. Time trends for 7 countries (Hungary, Poland, Slovenia, Romania, Sweden and Portugal) are examined over the period 1990-2002.
Author(s) Country/ region
Time period
Topic/aim of study Number of causes Design/method Results
Weisz, Gusmano et al. (2008) France, England and Wales and USA (Paris, Inner London and Manhattan) 1988-1990 and 1998-2000
Compare the three rich countries of the OECD in avoidable mortality and their largest cities.
„Avoidable‟ mortality: premature deaths amenable to medical interventions.
Basis: Nolte and McKee (2004) - 22 conditions (without IHD and with 50% of IHD deaths)
- Age limit 1-75 years, childhood infections are excluded
Cross-sectional and time trend
Age and gender standardized mortality rates. Regression controlling for the income levels for the period 1998-2000.
France has the lowest mortality rates in both periods (1.38 and 1.19 per 1000 population respectively). The US exhibits higher overall mortality rates, but similar AM rates compared to England and Wales (when excluding the IHD deaths). Rates of AM are lowest in Paris and highest in London. Avoidable mortality rates are higher in poor neighbourhoods of all three cities; only in Manhattan is there a correlation between the percentage of deaths that are avoidable and an income related variable.
Page, Tobias, et al. (2006)
Australia and New Zealand
1981-2001 Study the time trend of avoidable and amenable mortality in Australian and New Zealand regions and overall.
„Avoidable‟ mortality:
amenable causes (causes whose case fatality could be substantially reduced by currently available healthcare
technologies; preventable causes (causes whose case fatality could be reduced by preventing the condition from occurring in the first place).
Basis: Tobias and Jackson (2001) updated and revised
- 27 amenable conditions (diabetes, IHD and
cerebrovascular disease – 50%) and 21 preventable conditions
- Age limit 0-74 (asthma 0-44, chronic obstructive pulmonary disease 45-74)
Cross-sectional and time trend
Age standardized mortality rates by cause are analysed for both males and females. The associations between avoidable mortality and socio-economic status, ethnicity in different regions are described.
region period
James, Manuel, et al. (2006)
Canada 1975-1999 Examine mortality trends from avoidable causes in Canada.
„Avoidable‟ mortality:
conditions amenable to medical care or public health.
Basis: Holland (1997) - 13 conditions amenable to medical treatment plus IHD analysed separately, and 3 health policy indicators
- Age range 5-64 (IHD, hypertension, cerebrovascular disease, and lung cancer 35-64, breast cancer 25-64, cervical and
uterine cancer and Hodgkin‟s
disease 15-64, ulcers 25-64, maternal mortality 0-64)
Cross-sectional and time trend
National and regional (5 regions) age-standardized mortality rates using the direct method with Canada 1991 as the reference population.
From 1975-1979 to 1995-1999, the decrease in avoidable mortality (46.9%) was more
pronounced compared to mortality from other causes (24.9%). There were persistent regional avoidable mortality differences with consistently lower avoidable mortality in Ontario and British Columbia compared to the Atlantic, Quebec and Prairies regions, with no difference in mortality from other causes. Injuries, IHD and lung cancer strongly influenced the overall avoidable mortality trends. Schwierz & Wubker (2009) East and West Germany
1996-2004 Identify selected factors influencing the decrease in the number of avoidable deaths from IHD in West and East Germany.
- IHD
- Age limit 1-64
Panel
Age standardize mortality rate by the expected mortality for age groups, fixed effect with the panel data.
Increasing number of intracardiac catheter facilities (an important diagnostic tool for IHD) significantly account for decreases in avoidable mortality from IHD.
Sundmacher, L.
(forthcoming in 2011)
Germany 2000-2004 Identify areas in Germany burdened by exceptionally high rates of amenable cancer mortality and investigate the marginal contribution of healthcare on
amenable cancer using counties as the unit of analysis.
„Amenable‟ to medical
care types of cancer.
Basis: Nolte and McKee (2003), Ward et al. (2006)
- 10 conditions (only selected malignant neoplasm types)
- Age limit 0-75
Panel
Age standardized death rates as dependant variables in the Poisson regression model with fixed effects and robust standard errors.
Author(s) Country/ region
Time period
Topic/aim of study Number of causes Design/method Results
Bares, Gispert, et al. (2005) (in Spanish)
Spain (Catalonia)
1986-2001 Analyse time trends and geographical variation in avoidable mortality by health areas in Catalonia.
„Avoidable‟ causes:
those amenable to medical care and those responsive to health policy (preventable).
Basis: Department of Health of Catalonia
- 18 conditions
- Age limit 5-64 (uterine cancer 15-64, cardio rheumatic disease 5-44, respiratory disease 1-14, asthma 5-44, hypertensive and cerebrovascular diseases 35-64, complications related to
pregnancy and delivery, motor accidents – all ages, cholera and tetanus 64, whooping cough 0-14, osteomyelitis 1-64, cirrhosis 15-74, ADS 20-49)
Cross-sectional and time trend
Age standardized mortality rates, Poisson regression to estimate time trends.
The mean annual change for avoidable causes was -2.43% (95% CI, -2.60 to -2.26), higher than the -1.57% (95% CI, -1.61 to -1.52) change for general mortality. The rates were higher for preventable causes than for treatable causes, although mortality decreased in both groups. The health area of Segre was notable for its
significantly higher mortality from both treatable and preventable causes in both periods. Four health areas showed a significant increase in mortality from preventable causes but none showed an increase in mortality from treatable causes.
Duarte, Benach, et al. (2009) (in Spanish)
Spain 1990-2001 Describe the geographical distribution of avoidable and non-avoidable mortality in small areas in Spain by sex.
„Avoidable‟ causes:
those amenable to medical care (including IHD) and those responsive to health policy (preventable).
Basis: Gispert et al. (2006)
- 27 conditions
- Age limit 0-74 (uterine cancer 15-74, asthma 5-49, maternal mortality and adverse events during medical treatment or surgery – all ages, IHD 35-74, leukaemia 0-14, diabetes 0-49)
Cross-sectional and time trend
Empirical Bayesian model-based estimates of age-adjusted relative risk were displayed in small-area maps for each group of causes of death by sex.
There is a heterogeneous geographical
distribution of avoidable mortality for both sexes. Areas with greater mortality are located in the south and northwest of Spain. Especially for hypertension, cerebrovascular disease and ischaemic heart disease in men there is a clear aggregation of deaths in these areas.
region period
Melchor, Nolasco, et al. (2008) (in Spanish)
Spain (Valencia)
1990-2004 Analyse time trends and the geographical distribution of avoidable mortality in the autonomous community of Valencia and its health
departments by sex in the periods 1990-1994, 1995-1999, and 2000-2004.
„Avoidable‟ mortality:
conditions amenable to medical care and preventable.
Basis: Holland (1991)
- 17 treatable conditions and 4 preventable conditions
- Age limit 5-64 (uterine cancer 15-64, cardio rheumatic disease and asthma 5-44, respiratory diseases 1-14, hypertension and cerebrovascular disease 35-64, maternal deaths, measles – All, cholera and tetanus 0-64, whooping cough 0-14, osteomyelitis 1-64, cirrhosis 15-74, accidents – All, AIDS 20-24)
Cross-sectional and time trend
Age standardized mortality rates by sex are analysed over time and across the Valencia region.
The total number of avoidable deaths was 38,061 (7.1% of overall deaths). Men accounted for 76.2% and women for 23.8%. By groups, 82.4% were preventable and 17.6% were treatable. Preventable deaths represented 86.5% of deaths in men and 69.4% of those in women. Avoidable mortality in Valencia significantly decreased in both sexes, this decrease being more marked in the group of treatable deaths and in men. Mortality from lung cancer in women significantly increased. Between 2000 and 2004, none of the health departments showed a significant excess of treatable mortality.
Gubb (2007) UK (England and Wales)
1999-2005 Analyse time trends in
the „biggest‟ killers in
the UK (cancer and circulatory diseases) and compare the country position among other European countries.
„Avoidable mortality‟:
mortality from conditions which are either amenable to treatment and medical care and/or amenable to secondary
prevention through early detection.
Basis: Nolte and McKee (2004):
- 12 conditions (circulatory disease and cancer) analysed separately
- Age limit 0-74 („malignant neoplasm of cervix uteri and body
of the uterus‟ and „leukaemia‟,
where an age-limit of 44)
Cross-sectional and time trend
Age standardized mortality rates.
The major finding is that the rate of avoidable
mortality from the two „major killers‟ (cancer and
Table A3: Empirical studies of avoidable mortality – analyses of variation by socio-demographic factors (2004 onwards)
Author(s) Country/ region
Time period Topic/aim of study Number of causes Design/method Results
Hayen, Lincoln, et al. (2004)
Australia (New South Wales)
1980-2000 Study the changes in inequalities by socio-economic groups in
potentially avoidable mortality over time.
„Primary avoidable mortality‟:
deaths from conditions which are preventable through change in individual behaviour or through health policies.
Basis: Tobias and Jackson (2001)
- 3 (lung cancer, road traffic injury, IHD)
- Age limit 0-74
Cross-sectional and time trend
Age standardized mortality rates for local government areas, Poisson regression to assess changes in deaths rates by SES group after adjusting for age.
Rates of Primary Avoidable Mortality have decreased steeply for the three SES groups (20% lowest, 60% middle, and 20% highest), with the rates decreasing by 51% in males and 44% in females between 1980 and 2000. The relative gap between the highest and the lowest SES group and between the highest and the middle SES group increased for both males and females. The results are similar for all three conditions analysed separately.
Korda, Butler et al. (2007)
Australia 1986, 1991, 1997, 2002
Investigate the distribution of the benefits of healthcare across the SES distribution through the comparison of declines in avoidable and non-avoidable mortality.
„Avoidable‟ mortality: causes
amenable to medical care, causes mainly responsive to health policy, and IHD.
Basis: Nolte and McKee (2004)
- 34 conditions (Medical Care Indicators) plus IHD treated separately, plus 3 Health Policy Indicators
- Age limit 0-74
Cross-sectional and time trend
Pooled cross-section time trend analysis using the aggregated area data with two models: negative binomial and quasi-Poisson with SES, year and their interaction separately for avoidable and non-avoidable mortality. The first model is used to identify differences in time trend for the Relative Index Inequality (= the ratio of the rate of mortality that is predicted for the lower end of the socioeconomic continuum to the rate of mortality for the higher end). The second – for the Slope Index of Inequality (=absolute difference in standardized mortality ratios predicted for the lower and higher ends of socioeconomic continuum).