This is a repository copy of Short note on improved integration of mechanical testing in predictive wear models.
White Rose Research Online URL for this paper: http://eprints.whiterose.ac.uk/84171/
Version: Accepted Version
Article:
Liskiewicz, TW, Beake, BD, Schwarzer, N et al. (1 more author) (2013) Short note on improved integration of mechanical testing in predictive wear models. Surface and Coatings Technology, 237. 212 - 218. ISSN 0257-8972
https://doi.org/10.1016/j.surfcoat.2013.07.044
© 2013, Elsevier. Licensed under the Creative Commons Attribution-NonCommercial-NoDerivatives 4.0 International http://creativecommons.org/licenses/by-nc-nd/4.0
[email protected] https://eprints.whiterose.ac.uk/ Reuse
Unless indicated otherwise, fulltext items are protected by copyright with all rights reserved. The copyright exception in section 29 of the Copyright, Designs and Patents Act 1988 allows the making of a single copy solely for the purpose of non-commercial research or private study within the limits of fair dealing. The publisher or other rights-holder may allow further reproduction and re-use of this version - refer to the White Rose Research Online record for this item. Where records identify the publisher as the copyright holder, users can verify any specific terms of use on the publisher’s website.
Takedown
If you consider content in White Rose Research Online to be in breach of UK law, please notify us by
1
Short note on improved integration of mechanical testing in predictive wear models
T.W. Liskiewicz1, B.D. Beake2, N. Schwarzer3, M.I. Davies2
1 Institute of Engineering Thermofluids, Surfaces & Interfaces, School of Mechanical Engineering,
University of Leeds, Woodhouse Lane, Leeds, LS2 9JT, UK
2 Micro Materials Ltd., Willow House, Ellice Way, Yale Business Village, Wrexham, LL13 7YL, UK
3 Saxonian Institute of Surface Mechanics, Tankow 2, 18569 Ummanz, Germany
Abstract
In this work, a new global increment nano-fretting wear model based on the effective
indenter concept has been used and the results were compared with experimental data. A
series of DLC coatings with varied mechanical properties was deposited using industrial scale
PECVD system and characterised on a low-drift nanomechanical test platform (NanoTest
Vantage). 4500 cycle nano-scale fretting measurements have been performed in order to
examine the tribological properties of the coatings. A physical analysis of the
nanoindentation test enabled the true coating Young’s Modulus (E) and the coating yield
strength (Y) to be determined. In comparison to the hardness (H) this is the basis for a more
generic understanding of the mechanical coating behavior. This allowed direct examination
of the influence of the variation of Y/E in the coatings on the observed nano-fretting wear,
with the coating with highest Y/E showing significantly improved resistance to nano-fretting
wear. A preliminary evaluation of the stress field evolution during the test and the extraction
of wear and fretting parameters provides the opportunity to discuss the effects possibly being
2
1. Introduction
Improved integration of measurement data obtained from mechanical testing is required to
provide reliable inputs for predictive wear models. Due to complex nature of tribological
processes a large number of theoretical wear models have been proposed. It was estimated by
Meng et al. [1] that 183 equations with more than 300 material and mechanical parameters
describing the wear process can be listed. These models often have a theoretical-experimental
character. Hence, in order to estimate the wear coefficients a series of tests have to be
completed. Moreover, models prediction potential remains relatively low as they are usually
limited to a specific tribo-system and it is hardly possible to employ them to any other
practical situation. Nevertheless, the tribologists make every effort to find a universal
approach to estimate engineering components lifetime by developing more advanced wear
models.
Early wear models originated from empirical equations developed directly from tribological
experiments. In 70’s and 80’s of the 20th century, wear models started being elaborated on the
basis of mechanical contact. Many of them took into account the real contact area and
mechanical properties of the materials like Young’s modulus and hardness. The most
recognised wear model from that period was introduced by Archard [2]. This model was
proposed well in advance to other laws of contact mechanics and was derived by Archard
from an equation previously given by Holm [3], in which a dimensionless coefficient K was
introduced to provide the conformity of the formula with experimental results. The K
coefficient was interpreted by Archard as a probability to form a wear particle by the
asperities of the interacting solid bodies, however other authors propose different
3
Fretting wear is a specific surface destruction process, where the reciprocating sliding motion
with relatively small amplitude is responsible for the debris formation and loss of material by
interfacial shear work. Nano-fretting data have been reported by several research groups
carrying out experiments on various, commercially available and purpose-built equipment.
Performing the tests at this scale with well-defined spherical probes as model single asperity
contacts simplifies the contact geometry and provides a route for deeper understanding of the
fundamental phenomena. Varenberg et al. studied partial and gross slip fretting behaviour of
3.1 m diameter scanning probe microscopy probes tested against Si wafers [7].
Nano-fretting behaviour of monocrystalline silicon for potential application in MEMS devices
operating in vacuum conditions was studied by Yu et al. using AFM tips [8-9]. The energy
ratio related to the transition from partial to gross slip regime was measured and compared to
the same energy ratio observed in classic macroscale fretting. The authors looked also at 2
nm thick DLC coatings deposited on Si(100) and carried out tests against SiO2 microspheres
under vacuum and air conditions [10]. They found that DLC coating reduced significantly
adhesion and friction force in air conditions comparing to Si(100) substrate. Wilson et al.
focused on C and Cr doped amorphous C films and carried out small scale fretting
experiments using a modified nanoindenter (NanoTest) with 300 m diameter ruby tip under
10-200 mN applied load and 2-14 m displacement amplitude [11-13]. The authors identified
two distinct fretting wear regimes, with classic W-shaped wear scar under low oscillation
amplitude and full U-shaped wear scar at larger amplitudes.
Beake at al. recently used a modified nanoindenter platform for reciprocating testing under
milli-Newton range constant or ramped applied normal loads. In [14] nanoindentation,
nano-scratch and nano-fretting tests were performed and compared on highly polished Si(100)
4
on the deformation bheaviour. In [15,16] nano-fretting of 5, 20 and 80 nm thickness ta-C
films deposited on Si(100) was investigated using spherical indenters, where it was found that
fretting wear occurred at significantly lower contact pressure than is required for plastic
deformation and phase transformation in indentation and scratch experiments. Finally in [17]
nano-fretting experiments were carried out on biomedical grade Ti6Al4V, 316L stainless
steel and CoCr alloy samples using 3.7 m sphero-conical diamond indenter.
Analytical tools for nanoscale materials testing have rapidly developed over the last three
decades. Improved resolution and efficiency of existing techniques enabled development of
new experimental tools including nano-fretting testing and posing new challenges for
predictive models. In this work we have characterised the mechanical properties of three
different DLC coatings on M2 steel by nanoindentation and performed 4500 cycle
nano-fretting tests on them. We report on the first attempt of improved integration of measurement
data obtained from mechanical testing providing reliable inputs to nano-fretting wear model
and also provide an initial comparison between the experimental nano-fretting data and the
wear prediction from the model for the coating with the highest Y/E ratio.
2. Experimental
2.1. Materials
A series of three DLC coatings (denoted A, B and C) with varied mechanical properties was
deposited on M2 grade steel substrates for this study. Coatings A and B were deposited using
industrial scale PECVD Flexicoat 850 system (Hauzer Techno Coating, the Netherlands) in
the Advanced Coatings Design Laboratory in School of Mechanical Engineering at the
University of Leeds while coating C was a commercial coating, Balinit C Star, obtained from
5
carbide interlayers in order to enhance adhesion between the DLC coating and the substrate.
The Cr layer was deposited using magnetron sputtering, while the WC layer was deposited
using magnetron sputtering with the gradual introduction of Acetylene gas to the complete
PACVD stage, thus creating a functional gradient layer in one continuous deposition process.
Additionally, coating B was doped with silicon using hexamethyldisiloxane (HDMSO)
precursor. According to Balzers specification, Balinit C Star is applied in a single-pass
vacuum process at temperatures between 180 and 350°C, resulting in homogeneous coating
structure. Thickness of the coatings was assessed using Calotester (Tribotechnic, France)
employing abrasion ball cratering testing method. Surface roughness was measured using
two-dimensional contacting profilometry (Form Talysurf series, Taylor-Hobson, UK).
Surface roughness data was analysed to the least square line, with Gaussian filter, 0.25mm
[image:6.595.66.525.458.602.2]upper cut-off and bandwidth 1001.
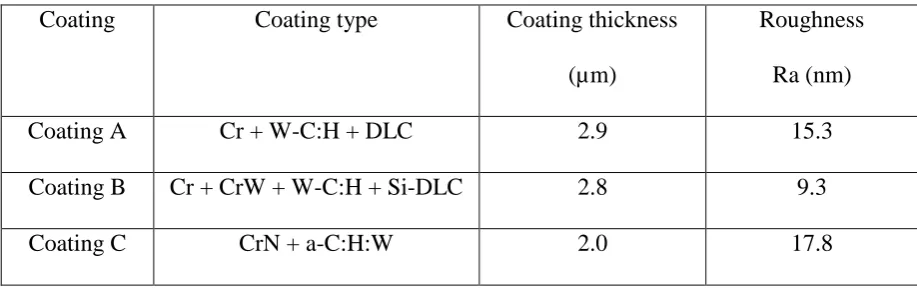
Table 1: DLC coatings.
Coating Coating type Coating thickness
(µm)
Roughness
Ra (nm)
Coating A Cr + W-C:H + DLC 2.9 15.3
Coating B Cr + CrW + W-C:H + Si-DLC 2.8 9.3
Coating C CrN + a-C:H:W 2.0 17.8
2.2. Nanoindentation and nano-fretting experiments
Nanoindentation and small scale fretting experiments were performed using the NanoTest
Vantage (from Micro Materials Ltd., Wrexham, UK) using the nanoindentation and
nano-fretting modules. Nanoindentation experiments were performed in order to characterise the
6
coatings with a sharp Berkovich indenter to peak loads of 1, 5, 10, 20, 30, 40, 50…100 mN
with 10 repeats for each load. The loading time was 20s with a hold of 5s before unloading in
20s. Data were corrected for thermal drift using hold periods of 60s prior to the load ramp
and after 90% unloading. Data from the nanoindentation experiments were also exported
from the NanoTest software and analysed using Oliver and Pharr for Coatings software (SIO,
Ummanz). This software allows determination of the coating-only Young’s modulus and
yield stress from conventional nanoindentation data. Full details of the operation of the
software have been described elsewhere, as discussed in section 2.3.
Full details of the experimental hardware used in the small scale fretting tests have been
published in previous works [11-15, 18]. For the fretting experiments reported in the current
study a 5 µm diamond probe was used, the fretting parameters chosen were 100 mN load,
13.4 µm track length and 5 Hz frequency. Experiments ran for 15 minutes at peak load so that
each sample was subjected to 4500 cycles. During the experiments load, depth and tangential
force were recorded in order to assess the damage. Friction coefficients during the fretting
tests were determined from friction loops by the method of Burris and Sawyer to eliminate
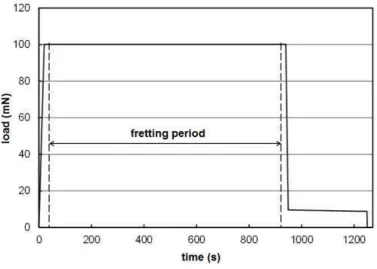
any potential transducer misalignment issues [19]. The 100 mN load was applied over 20 s at
the start of the experiment, there was then a 10 s hold before the fretting started to allow the
initial on load depth to be recorded. At the end of fretting there was again a 10 s pause to
record the final on load depth. The load was then removed over 20 s with a 300 s pause at 90 %
unloading to assess any thermal drift which may have affected the measurement. After
unloading a final 10 s with the probe held at the surface was used to assess the residual depth
of the fretting scar. During analysis the data were corrected for any thermal drift during the
experiment. An example of a typical loading profile is shown in Figure 1. Three repeat 4500
7
Fig. 1. Typical loading profile for a fretting experiment.
2.3. Wear model details
A predictive (physical) description of wear tests requires the combination of a variety of
scientific fields and concepts of material science. Due to lack of space within this short note
we will not elaborate all the theoretical material here, but refer to other papers instead [20,21].
The following issues need to be covered by the theoretical apparatus necessary for a proper
wear or fretting model:
• first principle based interatomic potential description of mechanical material behavior
[22];
• the effective indenter concept [23,24];
• the extension of the Oliver and Pharr method to analyze nanoindentation data to
layered materials and time dependent mechanical behavior [25-27];
8
The main difference to more “classical” ways to describe wear effects [e.g. 30,31] might be
seen in its successive or even hierarchic built-up of the model from first, but effective
principles to phenomenological parameters and from static or quasi static measurements to
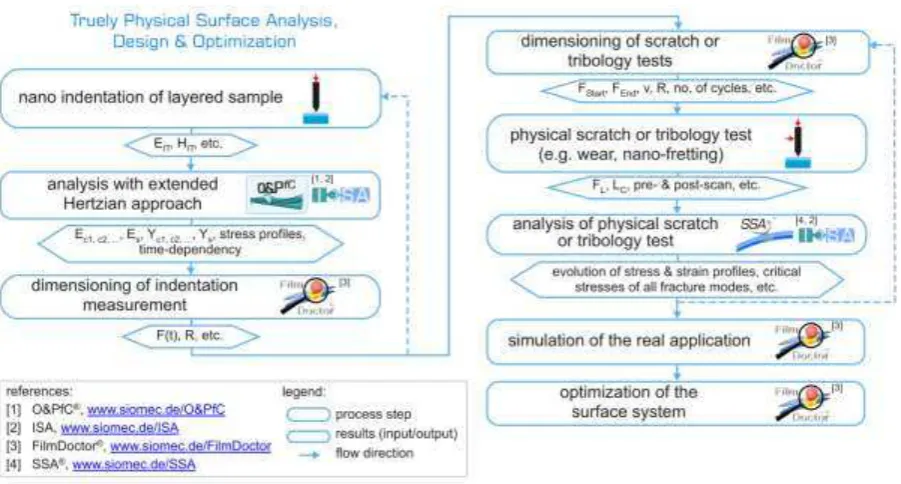
[image:9.595.75.526.235.477.2]dynamic tests (Fig. 2).
Fig. 2. A flow chart of the procedure of mechanical characterization and optimization
of arbitrary structured surfaces with respect to wear and fretting.
Some of these aspects shall be considered more closely within this paper, whereby we pay
explicit attention to the coupling of the deformation field (mainly the stress tensor) into the
decomposition behavior of the material determining its wear and fretting properties.
A more general simulation describing our nano-fretting or nano-wear experiments cannot be
performed via connecting the wear effect by a simple kd-value (simple Archard’s law) to the
9
tensor (often of even operational character), coupling with wear-moduli to every deformation
field component in a fully covariant manner. More correctly any tribo-process could be
linearly generalized like:
1
n
N S
kl kl u k l
ij ijkl ijkl ijkl ij n
n
tribo effect k k k u u k S
(1)Here we used the following denotations: kxxijkl-tensors are tensors coupling to the various
field values or tensors like stress kl, strain kl, displacement-vector ui or scalar values Sn,
like free or distortion energy strain work etc.. The symbol ij is the Kroenecker symbol. In
most cases, wear for instance, it should be sufficient to consider only the stresses:
kl ij ij ijkl
tribo effect w k (2)
Wherefrom the scalar wear-depth hw has to be evaluated via:
i j w ij
h w n n (3)
With ni denoting the surface normal unit vector.
As we can see, the Archard’s law given with a scalar wear coefficient kd by the simple
relation hw=kd * 33 is nothing but a rather dramatic simplification of equation (2). Within
this paper we will make use of an operational wear law taking into account the von Mises
stress maximum M, but also its distance to the surface contact centre rr . It is given as
kr r
ij ij dM M
w k er r (4)
with k being yet another parameter in addition to the linear kd. A more comprehensive
10
3. Results
3.1. Nanoindentation
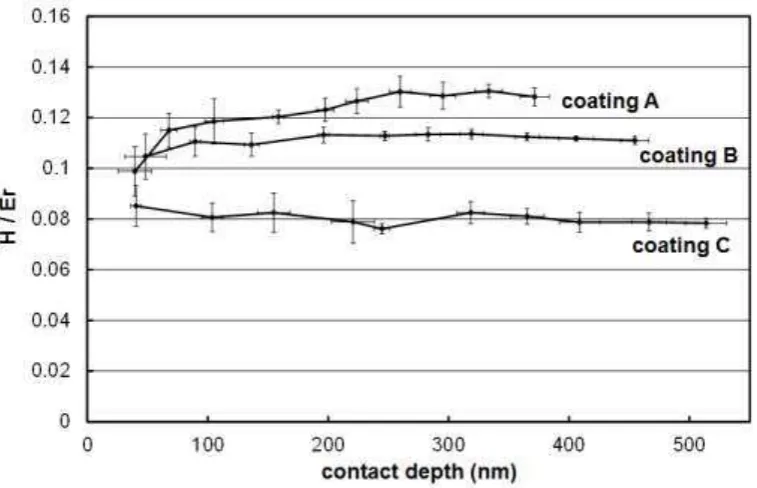
Nanoindentation revealed clear differences in mechanical behaviour between the different
DLC coatings confirming their suitability as model samples for the study of Y/E on fretting
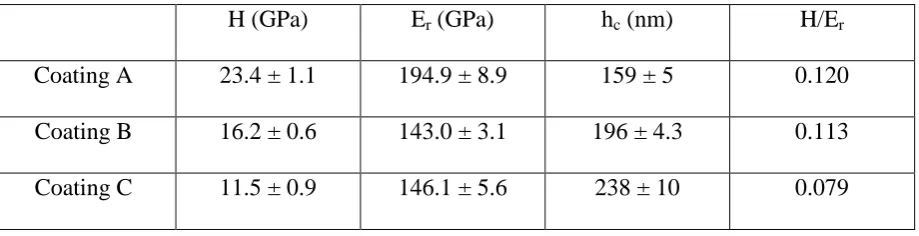
wear. As an illustration the results from tests to 20 mN peak load are shown in Table 2. There
is a clear difference in H/Er (and Y/E) with Coating A having the highest H/Er ratio and
Coating C the lowest. The variation in H/Er ratio with increasing indentation depth is shown
[image:11.595.71.531.346.464.2]in Figure 3.
Table 2. Nanoindentation testing to 20 mN
H (GPa) Er (GPa) hc (nm) H/Er
Coating A 23.4 ± 1.1 194.9 ± 8.9 159 ± 5 0.120
Coating B 16.2 ± 0.6 143.0 ± 3.1 196 ± 4.3 0.113
11
Fig. 3. Variation in H/Er with indentation contact depth
3.2. Nano-fretting
The evolution of on-load probe depth and the friction force during the test are illustrated in
Figure 4 for Coating A. In this test the friction initially increased then reaches a minimum
after 1500 cycles before gradually increasing to the end of the test, though the friction
coefficient remains at ~0.15 throughout. The rate of nano-fretting wear is not constant
through the 4500 cycle test, decreasing as the test progresses (Figures 4 and 5). This is
particularly clear for Coating B whose wear rate decreases significantly beyond ~800 fretting
cycles in all the tests. Although the initial wear rate on Coatings B and C is similar the final
12
Fig. 4. Coating A, 100 mN, 15 min fretting, R = 5 m probe, 5 Hz.
Fig. 5. Nano-fretting wear depth comparison for coatings A, B and C; 100mN, 15 min
[image:13.595.109.490.422.685.2]13
Table 3: Fretting results.
Coating Initial on-load
depth
(nm)
Post fretting
on-load depth
(nm)
On-load depth
increase
(nm)
Residual depth
(nm)
Coating A 384 ± 5 685 ± 31 301 ± 26 288 ± 10
Coating B 452 ± 3 1012 ± 62 560 ± 64 608 ± 113
Coating C 435 ± 23 1248 ± 42 813 ± 28 752 ± 154
Results from fretting experiments on the 3 coatings are shown in Table 3, with on-load depth
data corrected for the compliance of the fretting stage. The data shows the mean value with
standard deviation from three experiments in each case, indicating a clear ranking of the
coatings with Coating A experiencing significantly less wear than the other two coatings.
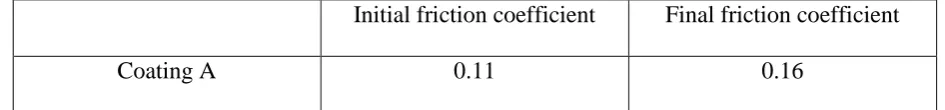
The coatings differ in their friction evolution during the fretting tests. The mean initial and
final friction forces are summarised in Table 4. After initial variability the friction force on
Coating B remains constant through the duration of the test and on Coating C it increases
continuously through the test. Coating A shows more complex dependence, with a clear
minimum in friction after 1500 s (as in Figure 4) before rising to values slightly higher than
the initial friction.
Table 4. Friction evolution in fretting
Initial friction coefficient Final friction coefficient
[image:14.595.60.533.712.767.2]14
Coating B 0.25 0.28
Coating C 0.23 0.33
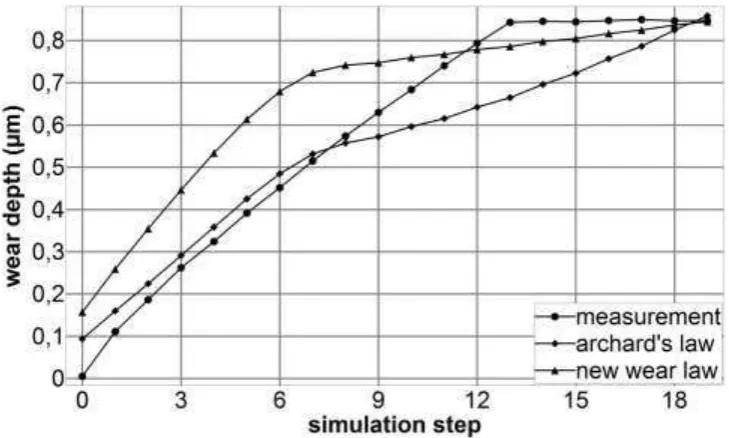
[image:15.595.118.483.237.456.2]3.3.Wear model
Fig. 6. Experimental nano-fretting data from the start of a test at 200 mN on Coating A and
simulated data from wear models
An example of the simulation of experimental nano-fretting data is shown in Figure 6. A
clearly non-constant wear rate in the initial stages was observed in the experiments and in
both the models. The evaluation (“new wear law” in Figure 6) checks whether Y is exceeded
anywhere within the compound (in case of layers it checks substrate and all layers). If this is
the case the effective indenter concept is been used in order to account for any plasticity
possible having occurred. Taking the plastic surface shape change into account the contact
15
4. Discussion
The nanoindentation data (Table 2 and Figure 3) clearly show marked differences between
the coatings. Data at different peak loads contain differing elastic contribution from the M2
substrate. To obtain accurate coating-only values of E for input to the simulations, it is
necessary to remove this substrate component which exists even when indenting to 1/10 of
the coating thickness. This has been done by exporting the NanoTest data to the Oliver and
Pharr for Coatings software. This yields values of Young’s modulus of 227 GPa, 151 GPa
and 142 GPa for Coatings A, B and C respectively. As a cross-check, data from across the
load range was used in an ISO14577-4 [33] approach to equate the coating-only elastic
modulus with the extrapolated value at zero depth. There was very good agreement between
the two approaches. The analytical treatment in the Oliver and Pharr for Coatings software
has the advantage in requiring acquisition of less experimental data.
The fretting tests reported here were in the gross-slip condition. Observed differences in
resistance to nano-fretting wear were correlated with differences in the Coatings Y/E (and
H/Er see Figure 2) ratio. This is consistent with observations at the macro-scale by Leyland
and Matthews that wear resistance often correlates better with H/E than H alone [34]. The
observed frictional behaviour on repetitive sliding is explained by changes to the ploughing
component of friction and smoothing of asperities, both of which alter the contact area and
therefore can influence the friction. In a repetitive nano-scratch test the initial friction force
typically decreases due to smoothing out surface asperities. Such initial decreases are
occasionally seen in the nano-fretting friction. As the fretting test progresses the increasing
friction due to increasing contact area due to wear and decreasing contact pressure is
observed. The increase in friction through the test is much greater (see Table 4) on Coating C
16
with increasing friction, and a transition to lower wear rate more steady friction. Studies of
the relative importance of yield stress and microstructure on the evolution of friction and
wear of metallic materials during micro-scale repetitive low-pass sliding have concluded that
yield stress plays the dominant role on the evolution of friction as the friction was almost
independent of the grain size but decreased with increasing hardness [35-37]. Non-constant
rate of sliding wear has been observed in repetitive micro-scratch testing of bulk metallic
samples such as Cu where the large plastic strains associated with sliding contact can produce
a surface hardening effect [36] or surface softening [37]. The lower initial friction on Coating
A is consistent with its lower hardness and reduced ploughing contribution.
In the example shown here (Figure 6) we observe the interesting fact, that the classical
Archard’s law almost perfectly describes the first part of the nano-fretting test, while the new
wear law (equation (4)) better fits the behaviour of the later part. As the classical Archard’s
law only considers the normal surface stress while the new wear law takes into account the
complete stress field’s deviatoric parts put together in the von Mises stress the following
hypothesis might be suggested: during the running in or asperity dominated beginning of the
nano-fretting test the wear in fact is mostly determined by surface stress information which is
rather perfectly been mirrored by the classical Archard’s law. The somewhat later wear
however, seems to depend more on shearing processes and shearing stresses underneath the
contact zone, which favours the new wear law, because it takes not only these stresses into
account, but also considers its distance to the surface. A deeper discussion of these effects on
17
5. Conclusions
The integrated experimental test configuration described (nanoindentation and nano-fretting
with friction measurement) has effectively characterised the mechanical properties and
nano-scale tribological behaviour of a series of DLC coatings deposited on M2 steel for anti-wear
applications. A physical analysis of the nanoindentation test data was performed enabling the
true coating Young’s Modulus (E) and the coating yield strength (Y) to be determined. Good
agreement was found between the ISO14577 and the above method to determine coating-only
modulus. This allowed direct examination of the influence of the variation of Y/E in the
coatings on the observed nano-fretting wear, with the coating with highest Y/E showing
significantly improved resistance to nano-fretting wear. In general high wear rate was
associated with increasing friction. The model introduced here has shown initial promise in
the analysis of nano-fretting tribological experiments, reproducing features of the
non-linearity in the wear process, and can be used to forward simulate such tests and give hints for
better component life-time predictions.
6. Acknowledgement
Micro Materials Ltd. acknowledges the assistance of the Welsh Assembly Government
Single Investment Fund in the development of the nano-fretting capability. We would also
like to thank Steve Goodes from Micro Materials for the development of the new
nano-fretting software with improved experimental flexibility used in the experimental work. This
work was partially funded through the European Metrology Research Programme (EMRP)
Project IND05 MeProVisc. The EMRP is jointly funded by the EMRP participating countries
within EURAMET and the European Union. We are also thankful to Nick Bierwisch from
SIO for analysing some of the experimental data. Marcus Fuchs, who is also from SIO,
18
References
1. Meng H.C., Ludema K.C., Wear models and predictive equations: their form and content,
Wear 181-183 (1995), p. 443-457.
2. Archard J.F., Contact and rubbing of flat surfaces, Journal of Applied Physics 24 (1953),
p. 981-988.
3. Holm R., Electric Contacts, Almqvist & Wiksells Boktryckeri, Uppsala (1946).
4. Shaw M.C., Dimensional analysis for wear systems, Wear 43 (1977), p. 263-266.
5. Hutchings I.M., Tribology: Friction and Wear of Engineering Materials, CRC Press
(1992), Boca Raton.
6. Johansson L., Model and numerical algorithm for sliding contact between two elastic
half-phase with frictional heat generation and wear, Wear 160 (1993), p. 77-93.
7. Varenberg M., Etsion I., Halperin G., Nanoscale fretting wear study by scanning probe
microscopy, Tribol. Lett., Vol. 18, No. 4, 2005, p. 493-498.
8. Yu J.X., Qian L.M., Yu B.J., Zhou Z.R., Nanofretting behaviours of monocrystalline
silicon (100) against diamond tips in atmosphere and vacuum, Wear 267, 2009, p.
322-329.
9. Yu J., Qian L., Yu B., Zhou Z., Nanofretting behaviour of monocrystallinr silicon (100)
against SiO2 microsphere in vacuum, Tribol. Lett., Vol. 34, 2009, p. 31-40.
10.Chen L., Yang M., Yu J., Qian L., Zhou Z., Nanofretting behaviours of ultrathin DLC
coating on Si(100) substrate, Wear 271, 2011, p. 1980-1986.
11.Wilson G.M., Smith J.F., Sullivan J.L., A nanotribological study of thin amorphous C and
Cr doped amorphous C coatings, Wear 265, 2008, p. 1633-1641.
12.Wilson G.M., Smith J.F., Sullivan J.L.,A DOE nano-tribological study of thin amorphous
19
13.Wilson G.M., Sullivan J.L., An investigation into the effect of film thickness on
nanowear with amorphous carbon-based coatings, Wear 266, 2009, p. 1039-1043.
14.Beake B.D., Liskiewicz T.W., Smith J.F. (2011) Deformation of Si(100) in spherical
contacts – Comparison of nano-fretting and nano-scratch tests with nano-indentation, Surf.
& Coat. Technol. 206, 1921-1926.
15.Liskiewicz T.W., Beake B.D., Smith J.F., In Situ Accelerated Nano-Wear: a New
Technique to Fill the Measurement Gap, Surface and Coatings Technology, 2010, Vol.
205, Pages: 1455-1459, ISSN: 0257-8972.
16.Beake, B.D., Ogwu A.A., Wagner, T. (2006) Influence of experimental factors and film
thickness on the measured critical load in the nanoscratch test, Mater. Sci. Eng. A 423
(2006) 70-73.
17.Beake B.D., Liskiewicz T.W., Comparison of nano-fretting and nano-scratch tests on
biomedical materials, Tribology International, 63, 2013, 123-131.
18.Beake B.D., Liskiewicz T.W. and Harris, A.J., Advanced nanomechanical test techniques
(in press).
19.Burris D.L., Sawyer W.G., Addressing practical challenges of low friction coefficient
measurements, Tribol. Lett. 35, 2009, 17-23.
20.Schwarzer N., About the identification of GENERIC tribological parameters,
sophisticated completely analytical contact modeling and the effective Indenter concept
applied to a comprehensive 3D incremental wear and fretting model for layered surfaces,
proceedings of SEECCM 2013 Kos June 12-14 2013.
21.Schwarzer N., Short Note on How to Make Tribological Tests Physical? - The Problem of
Time Dependent Material Behaviour, proceedings of the ICMCTF 2013, submitted.
22.Schwarzer N., Short note on the effect of pressure induced increase of Young's modulus,
20
23.Bolshakov A., Oliver W.C. and Pharr G.M., MRS Symp. Proc 356, 1995, p 675.
24.Pharr G.M., Bolshakov B., Understanding nanoindentation unloading curves, J. Mater.
Res., Vol. 17, No. 10, Oct 2002.
25.Schwarzer N., Pharr G.M., On the evaluation of stresses during nanoindentation with
sharp indenters, Thin Solid Films, Vol. 469-470C pp. 194-200.
26.Schwarzer N., Chudoba T., Pharr G.M., On the evaluation of stresses for coated materials
during nanoindentation with sharp indenters, Surf. Coat. Technol, Vol 200/14-15 pp
4220-4226.
27.Schwarzer N., The extended Hertzian theory and its uses in analysing indentation
experiments, Phil. Mag. 86 (33-35), 21 Nov - 11 Dec 2006, 5153 – 5767, Special Issue:
“Instrumented Indentation Testing in Materials Research and Development”.
28.Schwarzer N., Duong Q.-H., Bierwisch N., Favaro G., Fuchs M., Kempe P., Widrig B.,
Ramm J., Optimization of the Scratch Test for Specific Coating Designs, Surface and
Coatings Technology, volume 206, issue 6, year 2011, pp. 1327 – 1335.
29.Seibert F., Döbeli M., Fopp-Spori D.M., Glaentz K., Rudigier H., Schwarzer N., Widrig
B., Ramm J., Comparison of arc evaporated Mo-based coatings versus Cr1N1 and ta-C
coatings by reciprocating wear test, Wear (February 2013), 298-299, Complete, pg. 14-22.
30.Holmberg K., Matthews A., Coatings Tribology. 2nd edition, Elsevier, Amsterdam, The
Netherlands, 2009.
31.Hegadekatte V., Huber N., Kraft O., (2006) Tribology Letters 24, 51-60.
32.Schwarzer N., Endlessly Touchable – the Next Generation of Surface and Coating
Optimization, About the identification of GENERIC tribological parameters,
sophisticated completely analytical contact modeling and the effective Indenter concept
applied to a comprehensive 3D incremental wear and fretting model for layered surfaces,
21
33.ISO 14577: Metallic Materials – Instrumented Indentation Test for Hardness and
Materials Parameters, Part 4 - Test Method for metallic and non-metallic coatings.
34.Leyland A. and Matthews A., On the significance of the H/E ratio in wear control: a
nanocomposite coating approach to optimised tribological behaviour, Wear, 2000, 246, 1.
35.Wang C.T., Gao N., Gee M.G., Wood R.J.K. and Langdon T.G., Effect of grain size on
the micro-tribological behaviour of pure titanium processed by high-pressure torsion,
Wear, 2012, 280-281, 28-35.
36.Hanlon T., Chokshi A.H., Manoharan S. and Suresh S., Effects of grain refinement and
strength on friction and damage evolution under repeated sliding contact in
nanostructured metals, Int. J. Fatigue 2005, 27, 1159-1163.
37.Singh A., Dao M., Lu L. and Suresh S., Deformation, structural changes and damage
evolution in nanotwinned copper under repeated frictional contact sliding, Acta. Mater.,