promoting access to White Rose research papers
White Rose Research Online
[email protected]
Universities of Leeds, Sheffield and York
http://eprints.whiterose.ac.uk/
White Rose Research Online URL for this paper:
http://eprints.whiterose.ac.uk/77960/
Paper:
Koehler, A-K, Challinor, AJ, Hawkins, E and Asseng, S (2013) Influences of
increasing temperature on Indian wheat: quantifying limits to predictability.
Environmental Research Letters, 8 (3). 3. 034016.
Environ. Res. Lett.8(2013) 034016 (9pp) doi:10.1088/1748-9326/8/3/034016
Influences of increasing temperature on
Indian wheat: quantifying limits to
predictability
Ann-Kristin Koehler
1,2, Andrew J Challinor
1,2, Ed Hawkins
3and
Senthold Asseng
41Institute for Climate and Atmospheric Science, School of Earth and Environment, University of Leeds,
Leeds, UK
2CGIAR Research Program on Climate Change, Agriculture, and Food Security (strategic Partnership of
CGIAR and Future Earth)
3NCAS-Climate, Department of Meteorology, University of Reading, Reading, UK
4Department of Agricultural and Biological Engineering, University of Florida, Gainesville, FL, USA
E-mail:[email protected]
Received 22 May 2013
Accepted for publication 24 July 2013 Published 5 August 2013
Online atstacks.iop.org/ERL/8/034016
Abstract
As climate changes, temperatures will play an increasing role in determining crop yield. Both climate model error and lack of constrained physiological thresholds limit the predictability of yield. We used a perturbed-parameter climate model ensemble with two methods of
bias-correction as input to a regional-scale wheat simulation model over India to examine future yields. This model configuration accounted for uncertainty in climate, planting date, optimization, temperature-induced changes in development rate and reproduction. It also accounts for lethal temperatures, which have been somewhat neglected to date. Using uncertainty decomposition, we found that fractional uncertainty due to temperature-driven processes in the crop model was on average larger than climate model uncertainty (0.56 versus 0.44), and that the crop model uncertainty is dominated by crop development. Simulations with the raw compared to the bias-corrected climate data did not agree on the impact on future wheat yield, nor its geographical distribution. However the method of bias-correction was not an important source of uncertainty. We conclude that bias-correction of climate model data and improved constraints on especially crop development are critical for robust impact predictions.
Keywords:wheat lethal temperatures, climate change, crop model uncertainty, climate model uncertainty, bias-correction of climate model output
S Online supplementary data available fromstacks.iop.org/ERL/8/034016/mmedia
1. Introduction
Globally, future climate scenarios predict an increase in the frequency of extremely hot days, together with an increase in average global temperature. The trend has already been
Content from this work may be used under the terms of theCreative Commons Attribution 3.0 licence. Any further distribution of this work must maintain attribution to the author(s) and the title of the work, journal citation and DOI.
observed over the past decades with implications for global food production [1].
Environ. Res. Lett.8(2013) 034016 A-K Koehleret al
thresholds (>40◦C) is predicted over most of the year [4]. In India, wheat is usually planted in November/December and harvested around March/April with higher temperatures towards the end of the growing season.
There is uncertainty in the response of wheat to temperature. Temperature affects wheat (i) development, with an acceleration of time to maturity at elevated mean temperature, (ii) grain fertility, with reproduction being sensitive to high temperatures [5, 6], (iii) leaf senescence, which accelerates with maximum temperatures above 34◦C [7–9], and (iv) a lethal temperature effect on the whole plant [10], i.e. the immediate crop maturity or death if maximum temperature exceeds a certain threshold for a given number of days. The first two temperature-related crop processes are commonly implemented in crop simulation models but their representation varies. A review of temperature and the growth and development of wheat reported that cardinal temperatures seem to be well defined [10]. However there is little consensus on the cardinal temperatures and functions for crop development [11–13]. Different choices can result in significant differences in the timing of events and total crop duration affecting yield estimations [14]. The third process, increased senescence, is only present in a few wheat crop models [15]—despite its importance. In Australia, up to 50% reduction in grain production can be attributed to heat stress-induced accelerated leaf senescence for observed variations in average growing season temperature of±2◦C [15].
Work on the fourth process is far less advanced: we are not aware of a study that investigated the effect of lethal high temperatures on wheat yield and/or its representation in crop simulation models. Lethal temperatures were described as well defined (maximum temperature,Tmax, above 47.5◦C) [10], which was based on a single study [16]. The FAO database for crop ecological requirements to determine global crop suitability defines a lower lethal limit for wheat (−20◦C while dormant and 0◦C in early growth) but no upper limit (http://ecocrop.fao.org/ecocrop/ srv/en/crop/View?id=2114). A short review about the current knowledge and challenges of lethal temperature thresholds can be found in the supplementary data section S1 (available atstacks.iop.org/ERL/8/034016/mmedia).
In addition to the uncertainty in how crops respond to temperature, there is uncertainty in future climate. Progress has been made in including the quantification of climate model uncertainty in impact studies by using ensembles of Global Climate Models (GCMs). GCMs are not perfect representations of the true climate and bias-correction is used to make the GCM output more realistic. Recent studies have identified the choice of bias-correction of raw GCM output as a significant source of uncertainty: differences in future climate obtained using different bias-correction methods can be as large as between future emission scenarios [17, 18]. Most crops are sensitive to absolute temperature thresholds, hence correcting variability in addition to the mean is important [19]. This highlights the need for bias-correction of GCM output and the importance of the choice of bias-correction methodology for climate change impact studies.
The objective of this study is to determine which temperature-driven processes in crop models are important for the mean and variability of future wheat yield and which can be easily adapted to. We assess the extent to which climate and crop model skill and physiological data limit our ability to project impacts. We use a regional-scale crop simulation model together with a climate model ensemble and two methods to bias-correct the climate model output. India was chosen as it contributes substantially to global wheat production (12% in 2011, FAOSTAT) and is already prone to extreme temperatures, with the number of extreme temperatures predicted to increase in the future [4]. We use a crop simulation model which has all the main temperature-driven processes implemented [20,21], including increased senescence and the impact of lethal temperatures.
In order to achieve our objectives we (1) mathematically decompose crop and climate model uncertainty and determine their contribution to the total uncertainty, (2) quantify the impact of omitting the effect of lethal temperatures on future wheat yield, and (3) compare simulations with and without bias-correction of climate model output and its impact on future wheat predictions.
2. Materials and methods
2.1. Climate and crop data
Three sources of climate data were used for the baseline pe-riod 1969–1988: observed weather data (monthly interpolated to dailyTminandTmaxfrom the Climate Research Unit from the University of East Anglia, UK, 0.5◦ × 0.5◦, averaged on to 1◦×1◦), ECWMF ERA40-reanalysis data (dailyT
min andTmaxcalculated from six hourly data and solar radiation, 1.125◦ × 1.125◦, gridded to 1◦ × 1◦), and the historical data from the coupled atmosphere–ocean simulations of the Hadley Centre quantifying uncertainty in model prediction
(QUMP) project (2.5◦ latitude × 3.75◦ longitude). QUMP
uses the perturbed physics approach to sample uncertain-ties [22]. We use daily solar radiation,TminandTmaxfrom the unperturbed baseline climate, and the 17-member projection ensemble forced by the SRES A1B scenario for the future. The projections were divided into three 20-year time periods from 2030 to 2089.
Yearly wheat district level production data were available for India (P K Aggarwal; Socio-economic Policy Division of the International Crops Research Institute for the Semi-arid Tropics (ICRISAT), Patancheru, India). The yield data were linearly detrended to account for improved crop varieties and management methods and scaled to the climate data grid. To upscale the data, the area under cultivation was assumed to be evenly spread throughout each district. The historical yield data were used to calibrate the crop model (see section S2 available atstacks.iop.org/ERL/8/034016/mmedia).
2.2. Crop model
We use the spring wheat version of the General Large Area Model for annual crops (GLAM), a regional-scale process-based crop model running on a daily time-step [21, 23].
GLAM was chosen as it was designed to operate on spatial scales commensurate with those of global climate models. Its complexity is low compared to field scale crop models, giving the opportunity to compute a large number of simulations. Over 90% of wheat in India is irrigated [2] as it is traditionally sown in the dry season. For this reason, and to single out the impact of temperature on wheat yield, fully irrigated conditions are assumed. The two main processes that are influenced by temperature in GLAM are (i) the crop development which is determined by cardinal temperatures, a function for thermal time accumulation and a thermal-time-requirement for each developmental stage [21], and (ii) anthesis which is sensitive to high temperatures decreasing the number of set grains [20,23]. Two additional processes were implemented in order to represent all major heat stress impacts on wheat: (iii) the acceleration of leaf senescence with highTmax, and (iv) a lethal temperature effect on the wheat plant. The reduction of transpiration efficiency to represent reduced photosynthesis with high temperatures was not included in the uncertainty analysis. Details on how process (iii) and (iv) are represented in GLAM and how GLAM is optimized can be found in the supplementary data section S2.
2.3. Quantification of crop and climate model uncertainty
2.3.1. Uncertainty in climate. We account for climate data uncertainty from two sources: the climate model and the method used for bias-correction of the climate model output. The climate model uncertainty was quantified by including all 17 members of the QUMP ensemble. QUMP was chosen as it was designed to sample a wide range of climate sensitivities [22]. The climate model uncertainty will be referred to as ‘climate’.
Each QUMP ensemble member was bias-corrected in two ways, using the ‘bias-correction’ (BC) and the ‘change factor’ (CF) method [17]. Both methods include historical observations (ERA40-reanalysis) and simulations (QUMP) to derive corrections in daily mean temperature and variability. The BC method corrects the projected raw daily QUMP output using the differences in the mean and variability between ERA40-reanalysis and the historical QUMP for the baseline period 1969–1988 [17]. The CF method utilizes the ERA40 daily variability and changes the mean and variance as simulated by QUMP [17].
2.3.2. Crop model uncertainty. To quantify different sources of crop model uncertainty the following modelling framework was adopted (tables S1–S3 available atstacks.iop.org/ERL/8/ 034016/mmedia): (i) determination of the optimal parameter set for GLAM using three different climate datasets (observed weather, ERA40-reanalysis, historical QUMP), referred to as ‘optimization’ uncertainty, (ii) using three different sets of cardinal temperatures combined with two functions for thermal time accumulation for crop development, referred to as ‘thermal’ uncertainty. The triangular and trapezoidal functions were used; the trapezoidal function had optimal development up to the maximum cardinal temperature.
Both types of functions are commonly used to model wheat development, as the response to wheat above the optimal temperature is not well defined [24]. (iii) Shifting planting date from ±14 days relative to the Sacks planting date [25], referred to as ‘planting’ uncertainty, (iv) varying the lethal temperature threshold and number of days it has to be exceeded, referred to as ‘lethal’ uncertainty, and (v) for a subset of simulations assessing three thresholds for high temperature stress around anthesis referred to as ‘HTS’ uncertainty. Due to computational constraints the three temperature thresholds for HTS (table S2) were only simulated for a subset of possible simulation combinations: all 17 ensemble members for each bias-corrected climate model output, all lethal temperature limits, all crop development settings, one optimal parameter set, and three planting dates (early, middle, late; influence of planting date on uncertainty see figure S1 available at stacks.iop.org/ERL/8/ 034016/mmedia).
2.3.3. Uncertainty decomposition. The uncertainty in climate predictions can be partitioned into internal variability of the climate system, model uncertainty, and scenario
uncertainty [26]. We perturbed crop and climate model
parameters and used a similar approach to decompose climate and crop model uncertainty. We distinguish six sources of uncertainty as introduced above: climate, lethal, thermal, optimization, planting, and HTS. The uncertainty decomposition was separately computed for (i) yield and crop duration; (ii) raw, BC and CF bias-corrected climate model output; (iii) the three time periods 2030–49, 2050–69, 2070–89; and (iv) for each grid cell. For each source i(i=
1, . . . ,6)of crop and climate model uncertainty, the fractional uncertainty in yieldy(and crop duration) is calculated as the fraction of one source of uncertainty divided by the sum of all sources of uncertainty. The absolute uncertainty of each sourceiis the range, i.e. the maximum minus the minimum yield (crop duration) across all simulationsyij, withjbeing the
subcategories of each uncertainty sourcei, e.g.j=1, . . . ,17 for the uncertainty attributed to the different QUMP ensemble members.
Fractional uncertaintyi= Pmax(yij)−min(yij) imax(yij)−min(yij).
(1)
3. Results and discussion
The raw climate model data for the baseline period overestimate high values of Tmax during the wheat growing season compared to observed weather and ERA40-reanalysis data (figure S2 available at stacks.iop.org/ERL/8/034016/ mmedia). For future projections the raw climate model
data show much higher values for Tmax exceeding a
Environ. Res. Lett.8(2013) 034016 A-K Koehleret al
Figure 1. 2050–2069 mean yield minus the simulated baseline yield. Future simulations with the raw climate model output (QUMP raw) are compared to baseline simulations with the raw climate model output and future simulations with the bias-corrected climate model output (QUMP BC, QUMP CF) are compared to simulations with the ERA40 data.
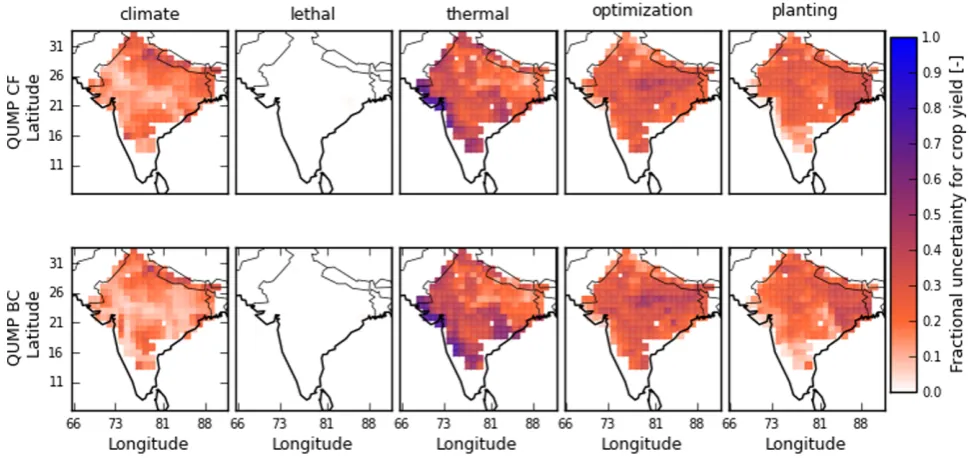
Figure 2. Uncertainty decomposition for yield for the time period 2050–2069. Rows separate simulations using the two bias-corrected climate model outputs (QUMP BC, QUMP CF). The columns are the different sources of uncertainty: ‘climate’ = QUMP17 ensemble (17×), ‘lethal’ = lethal temperature limits of 40, 45, 50◦C and 1–5 days of exceedence (16×), ‘thermal’ = crop thermal time development (3×), ‘optimization’ = using observed weather, ERA40-reanalysis or climate model data for optimization of GLAM (3×), ‘planting’ = Sacks planting dates [25]±14 days (29×).
org/ERL/8/034016/mmedia). Furthermore, the geographical distribution of regions with the highest yield impact does not agree between simulations with the raw and the bias-corrected
climate model output (figure 1). Simulations using both
methods of bias-correction show decreases in mean yield mainly for the north-east of India and increases for the south-west. The changes in yield can partly be attributed to a mean decrease in crop duration for the north-east and a mean increase for the south-west.
The results agree with calculations of a ‘heat stress reduction factor’ for Europe where bias-corrected climate model output outperformed raw climate model data [17]. Our findings do not show a large difference in yields simulated with the two methods of bias-correction, whereas other studies found considerable differences between future climates
obtained using various methods for bias-correction and concluded that the choice of bias-correction was a significant contributor to total future yield uncertainty [17, 19]. We conclude that bias-correction is needed and focus the following results on simulations using the two bias-corrected climate model outputs only.
3.1. Principal sources of uncertainty in yield simulations
The geographical distribution of fractional yield uncertainty does not change much over the three future time periods (figures 2, and S5, S6 available at stacks.iop.org/ERL/8/ 034016/mmedia), thus we focus on 2050–2069. Figure 2
shows the uncertainty decomposition for this period, which quantifies the extent to which yield variations are due to
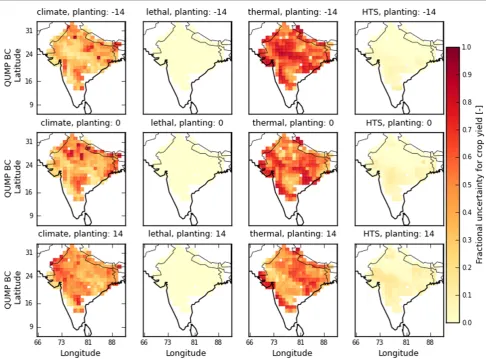
[image:5.595.55.540.273.502.2]Figure 3. Uncertainty decomposition for yield for the time period 2050–2069 using the BC bias-corrected climate model output. The rows separate three planting dates (−14, 0,+14 days relative to the Sacks planting date [25]). The columns give the different sources of uncertainty: climate = QUMP17 ensemble (17×), lethal = lethal temperature limits of 40, 45, 50◦
C and 1–5 days of exceedence (16×), thermal = crop thermal time development (3×), and HTS = thresholds for high temperature stress around anthesis (3×).
the climate model ensemble (‘climate’), different choices of lethal temperature thresholds and days of exceedence (‘lethal’), the choice of thermal time development (‘thermal’), the data used for optimizing the crop model (‘optimization’), and the planting date (‘planting’) in relation to the total uncertainty for each grid cell in India where wheat is grown. Yield simulations using the two bias-corrected climate data agree on the contribution of the different sources of uncertainty and their geographical distribution. Thermal is the largest source of uncertainty for yield simulations with highest values in the south-west of the country and lowest in the north-east. In south-west India, compared to the north-east, crop durations increase and become more variable as mean temperatures increase above the optimum temperature for crop development, but maximum temperatures do not frequently exceed the threshold for increased senescence shortening crop durations (figure S2). Following thermal, three sources of uncertainty have almost equal contributions to the total: climate, optimization, and planting. The fractional uncertainty from lethal contributes least to the total uncertainty (figure2). The contribution of heat stress during anthesis (high temperature stress—‘HTS’) to total yield uncertainty was assessed using a separate set of
simulations. HTS uncertainty is higher than lethal uncertainty
but low compared to thermal uncertainty (figures 3 and
S7 available at stacks.iop.org/ERL/8/034016/mmedia). HTS uncertainty increases with later planting.
The temporal trend of countrywide average yield uncer-tainty shows an increasing trend with time (figure S8 available at stacks.iop.org/ERL/8/034016/mmedia; additionally shows result for crop duration uncertainty). The main increase in total uncertainty can be attributed to an increase in the uncertainty due to thermal. This is likely due to increasing mean temperatures above the optimal temperature for crop development towards the end of the century. The functions for thermal time development differ substantially above the optimal temperature with either reduced development or continued optimal development up to the maximum temperature.
Environ. Res. Lett.8(2013) 034016 A-K Koehleret al
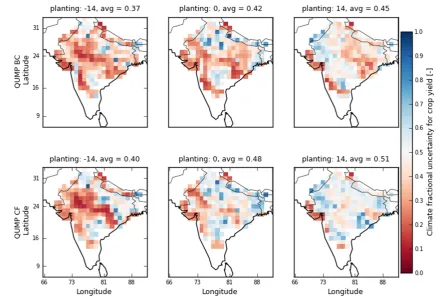
Figure 4. Uncertainty decomposition for yield using the simulations including HTS for 2050–2069. It contrasts climate model uncertainty (‘climate’) and uncertainty for temperature-related processes in the crop model (‘thermal’+‘lethal’+‘HTS’) for three planting dates and both bias-corrected climate model data. Blue means more climate model uncertainty and red more crop model uncertainty.
range experienced during those stages, thus the importance of better understanding crop thermal time development. Different functions for modelling crop development have
been proposed [11–13] and are currently used in crop
models, which can lead to substantial variations in simulated crop duration [14]. The importance of the representation of phenology in crop models was confirmed by the wheat Agricultural Model Intercomparison and Improvement Project (AgMIP) pilot study which compared 26 wheat models in four contrasting wheat growing environments. They identified the simulation of temperature effects as one of the largest limitations in modelling climate change impacts and could partly relate them to simulated phenology [27]. A recent study aiming at identifying cardinal temperatures for wheat leaf appearance using experimental data was able to suggest values for the base and lower optimum temperature but failed determining an upper optimum or maximum temperature [24]. The authors ascribed this to a low frequency of experimental data with mean temperatures above 25◦C and stress responses to extreme low and high temperatures even though they included data from a T-FACE (Temperature-Free
Air CO2 Enrichment) experiment. The uncertainty in crop
development can be expected to be high in all wheat growing areas where mean temperature frequently exceeds the optimal temperature. With increasing temperatures in the future it is essential to understand the behaviour of crop development beyond the optimum temperature.
Moreover, thermal time accumulation of crops might not be constant under varying climate conditions [28], an assumption made by crop modellers. An increase in thermal time accumulation between 7 and 10◦C yr−1 was found for a rice variety over a 20-year time period [28]. Extending the study to nine rice cultivars confirmed a correlation between temperature and phenological prediction error but the cultivars did not agree on the direction of correlation [29]. The study concluded that a rapid decrease in development rate above the optimal temperature, characteristic for the triangular function, can lead to systematic errors. This might be the reason for unrealistically high yield values simulated in our study for the simulations using the triangular function for thermal time accumulation (supplementary data section S3).
Figure 4 contrasts uncertainty from the climate model (climate; blue means more climate model uncertainty) versus uncertainty due to temperature-driven processes in the crop
model (thermal+lethal+HTS; red means more crop model
uncertainty) for early, middle, and late planting. There are regional differences where climate or crop model uncertainty dominates. On average over India fractional crop model uncertainty contributes about 0.6, 0.55, and 0.5 to total fractional uncertainty for early, middle and late planting, respectively. Figures3and S7 show that the main changes in fractional uncertainty with later planting come from a shift in thermal to climate model uncertainty. The decrease in thermal uncertainty with later planting is likely due to an increase in the importance of senescence as high temperatures are
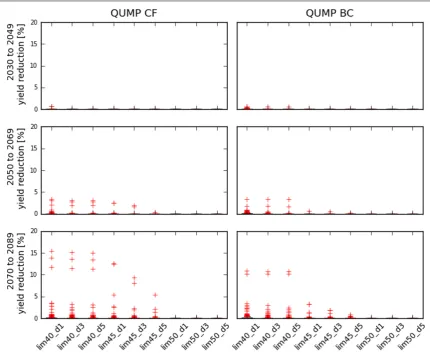
Figure 5. Boxplot of mean percentage reduction in crop yield when including lethal temperatures of 40, 45, and 50◦
C which have to be exceeded for 1, 3, and 5 consecutive days compared to not including lethal temperature thresholds. The columns separate simulations using the two bias-corrected climate model outputs (QUMP CF, QUMP BC) for the three time periods 2030–2049, 2050–2069, and 2070–2089 (rows).
a common problem towards the end of the wheat growing season. Increased senescence can shorten total crop duration and makes it somewhat independent of thermal.
We found that crop model uncertainty was on average larger than climate model uncertainty. The majority of studies looking at uncertainty in climate impact projections focus on either input uncertainty [30, 31] or impact model uncertainty [32]. Few studies quantify both, with the extent varying from uncertainty quantification of single processes to various model parameters [33–38]. Contrary to our results they suggest that climate model uncertainty dominates total projected uncertainty. For example, assessment of climate and crop model uncertainty for groundnut in India found relatively low crop model uncertainty, attributable to good observational constraints [33, 34]. Here, as in most studies, we do not include uncertainty due to different crop models. Small scale crop model intercomparisons including two to three models showed that this can be an important source of uncertainty [14,39,40]. A large scale AgMIP is currently being carried out to quantify uncertainty across multiple models, scenarios, locations, and crops [32].
We did not include the effect of CO2 fertilization and water stress in the yield simulations. Increasing CO2 levels
increase the rate of photosynthetic carbon fixation and net primary production for C3 crops like wheat. From 1980 to
2008 increasing CO2 levels were estimated to have had a
global boost on wheat production of about 3% [3]. The
response of yield to changes in CO2 is complex as it
additionally affects for example stomata opening changing canopy temperature, grain quality, and the absorption of nitrogen. The availability of water further complicates the matter. If water availability is guaranteed, it can help cooling down plants through transpiration cooling but water stress would increase canopy temperatures. A more detailed discussion on our reasoning not to include CO2fertilization and water stress and their likely influence on crop yield can be found in the supplementary data section S4 (available at
stacks.iop.org/ERL/8/034016/mmedia).
3.2. Importance of lethal temperatures and their impact on adaptation strategies
Figure 5 shows the influence of lethal temperatures on
Environ. Res. Lett.8(2013) 034016 A-K Koehleret al
data give similar results. The choice of lethal temperature limit has a strong impact on simulated yield and crop duration. If the lethal threshold is 40◦C and has to be exceeded for one day, simulated yield reductions for both bias-corrected climate model outputs show possible reductions of about 10–15% by the end of the century. Crop duration can be reduced between 10 and 30% for the same time period (figure S9 available atstacks.iop.org/ERL/8/034016/mmedia). For lethal temperature thresholds of 45◦C fewer grid cells are affected
and 50◦C does not seem to harm wheat yields in India
(figure5).
Due to the lack of experimental data, we chose a broad range of lethal temperature thresholds. On average over India, lethal temperatures had a small impact on simulated yield and yield uncertainty compared to other sources of uncertainty, but locally they can be important. The small impact is likely due to the effect of increased senescence. Increased senescence was shown to substantially shorten crop duration and crop yield in India and Australia [14,15]. In many cases increased senescence may reduce yield so that lethal limits result in little additional yield loss. If only increased senescence but not lethal limits are included in crop simulations, the total crop duration stays in a feasible range for wheat growth. A possible way to adapt to these conditions is (1) to plant earlier, or (2) to grow shorter crop duration varieties. Planting dates of wheat are often dependent on the harvest time of rice, as a rice–wheat cropping system is common in India. Lobellet al[41] found for some of the main wheat growing areas in India, that wheat was sown on average one week earlier by 2010 than at the beginning of the decade. They also found that sowing dates seem to be near or already at the optimum window for yields, implying that further significant increases in yield from changes in planting date are not very likely [41]. Shorter crop duration varieties do exist but shorter durations mean less light interception and biomass accumulation leading to lower yields in irrigated systems. The risk presented by lethal temperatures is that even if Indian farmers adapt to heat stress towards the end of the growing season by planting shorter crop duration varieties, locally lethal temperatures might have the ability to reduce crop duration up to a point where wheat growth is not feasible anymore. In this case a combination of shorter crop duration varieties with increased heat tolerance is essential for adaptation. As discussed above, a follow up study should investigate the influence of plant water status on canopy temperatures and how this would change the frequency of crossing crop temperature stress thresholds.
4. Conclusions
The choice of climate data can have large implications for climate change impact studies. Even though it is becoming more common among the impact research community to use climate model ensembles, few studies combine climate model ensembles and bias-correction, or different methods for bias-correction [17, 34, 42]. This study shows that bias-correction of climate model output can be critical. If the impact of bias-correction is not tested, incorrect conclusions may be reached.
To understand temperature-driven processes in crops and their uncertainties is becoming more important with temperatures shifting to ranges that have not been experienced before, and where experimental data are rare. Wheat production in warm countries like India and Australia is already affected by high temperatures. We quantified climate model uncertainty and uncertainty due to temperature-driven processes in the crop model. Crop model uncertainty was on average larger than climate model uncertainty (0.56 versus 0.44 contributions to total fractional uncertainty). Crop model uncertainty is dominated by crop development. Lethal temperatures did not contribute significantly to crop model uncertainty but might locally be able to reduce crop duration up to a point where wheat growth is not feasible anymore. Follow up studies should investigate the influence plant water status and CO2levels have on canopy temperature and how this changes the frequency of heat stress experienced by the crop. The results demonstrate the need for further experimental data to constrain temperature-driven processes in regional-scale crop models, especially crop development. Multi-location trial data are required and have to be incorporated in crop models to capture the full range of genetic variation and their interaction with the environment [43].
Acknowledgments
The study was funded by the CGIAR Research Program on Climate Change, Agriculture and Food Security (CCAFS), which is supported by the CGIAR Fund, DANIDA, AusAid, Irish Aid, Environment Canada, Ministry of Foreign Affairs of the Netherlands, the Swiss Agency for Development and Cooperation (SDC), Instituto de Investigac¸˜ao Cient´ıfica Tropical (IICT), UK Aid, the Government of Russia, and the European Union (EU). EH is funded by a NERC Advanced Fellowship and the EQUIP project. We would also like to thank Julian Ramirez-Villegas from the Climate Impacts Group at the University of Leeds for his insightful comments.
References
[1] IPCC 2007IPCC Fourth Assessment Report: Climate Change 2007 (AR4)(Geneva: IPCC)
[2] Singh S and Mustard A 2012 IndiaGrain and Feed Annual Grain Report Number IN2026 (Washington, DC: USDA Foreign Agricultural Services)
[3] Lobell D B, Schlenker W and Costa-Roberts J 2011 Climate trends and global crop production since 1980Science
333616–20
[4] Tebaldi C and Knutti R 2010 Climate models and their projections of future changesClimate Change and Food Security: Adapting Agriculture to a Warmer World (Advances in Global Changevol 37) ed D Lobell and M Burke (Berlin: Springer) pp 31–83
[5] Wheeler T R, Craufurd P Q, Ellis R H, Porter J R and Vara Prasad P V 2000 Temperature variability and the yield of annual cropsAgric. Ecosyst. Environ.82159–67
[6] Ferris R, Ellis R H, Wheeler T R and Hadley P 1998 Effect of high temperature stress at anthesis on grain yield and biomass of field-grown crops of wheatAnn. Bot.82631–9
[7] Fischer R A 1980 Influence of water stress on crop yield in semiarid regionsAdaptation of Plants to Water and High Temperature Stressed N C Turner and P J Kramer (New York: Wiley) pp 323–39
[8] Zhao H, Dai T B, Jing Q, Jiang D and Cao W X 2007 Leaf senescence and grain filling affected by post-anthesis high temperatures in two different wheat cultivarsPlant Growth Regul.51149–58
[9] Shah N H and Paulsen G M 2003 Interaction of drought and high temperatures on photosynthesis and grain-filling of wheatPlant Soil257219–26
[10] Porter J R and Gawith M 1999 Temperatures and the growth and development of wheat: a reviewEur. J. Agron.1023–36
[11] Yin X, Kropff M J, McLaren G and Visperas R M 1995 A nonlinear model for crop development as a function of temperatureAgric. For. Meteorol.771–16
[12] McMaster G S, White J W, Hunt L A, Jamieson P D, Dhillon S S and Ortiz-Monasterio J I 2008 Simulating the influence of vernalization, photoperiod and optimum temperature on wheat developmental ratesAnn. Bot.
102561–9
[13] Li L, McMaster G S, Yu Q and Du J 2008 Simulating winter wheat development response to temperature: modifying Malo’s exponential sine equationComput. Electron. Agric.
63274–81
[14] Lobell D B, Sibley A and Ortiz-Monasterio J I 2012 Extreme heat effects on wheat senescence in IndiaNature Clim.
Change2186–9
[15] Asseng S, Foster I A N and Turner N C 2011 The impact of temperature variability on wheat yieldsGlob. Change Biol.
17997–1012
[16] Drozdov S N, Titov A F, Balagurova N I and Kritenko S P 1984 The effect of temperature on cold and heat resistance of growing plants II. Cold resistant speciesJ. Exp. Bot.
351603–8
[17] Hawkins E, Osborne T M, Ho C K and Challinor A J 2013 Calibration and bias correction of climate projections for crop modelling: an idealised case study over EuropeAgric. For. Meteorol.17019–31
[18] Ho C K, Stephenson D B, Collins M, Ferro C A T and Brown S J 2012 Calibration strategies: a source of additional uncertainty in climate change projectionsBull. Am. Meteorol. Soc.9321–6
[19] Hawkins E, Fricker T E, Challinor A J, Ferro C A T, Ho C K and Osborne T M 2013 Increasing influence of heat stress on French maize yields from the 1960s to the 2030sGlob. Change Biol.19937–47
[20] Challinor A J, Wheeler T R, Craufurd P Q and Slingo J M 2005 Simulation of the impact of high temperature stress on annual crop yieldsAgric. For. Meteorol.135180–9
[21] Challinor A J, Wheeler T R, Craufurd P Q, Slingo J M and Grimes D I F 2004 Design and optimisation of a large-area process-based model for annual cropsAgric. For. Meteorol.
12499–120
[22] Collins Met al2010 Climate model errors, feedbacks and forcings: a comparison of perturbed physics and multi-model ensemblesClim. Dyn.361737–66
[23] Li S 2008 Investigating the impacts of climate change on wheat in ChinaPhD ThesisUniversity of Reading [24] White J W, Kimball B A, Wall G W and Ottman M J 2012
Cardinal temperatures for wheat leaf appearance as assessed from varied sowing dates and infrared warming Field Crops Res.137213–20
[25] Sacks W J, Deryng D, Foley J A and Ramankutty N 2010 Crop planting dates: an analysis of global patternsGlob. Ecol. Biogeogr.19607–20
[26] Hawkins E and Sutton R 2009 The potential to narrow uncertainty in regional climate predictionsBull. Am. Meteorol. Soc.901095–107
[27] Asseng Set al2013 Uncertainty in simulating wheat yields under climate changeNature Clim. Changeat press (doi:10.1038/NCLIMATE1916)
[28] Zhang T, Zhu J and Yang X 2008 Non-stationary thermal time accumulation reduces the predictability of climate change effects on agricultureAgric. For. Meteorol.1481412–8
[29] van Oort P A J, Zhang T, de Vries M E, Heinemann A B and Meinke H 2011 Correlation between temperature and phenology prediction error in rice (Oryza sativa L.)Agric. For. Meteorol.1511545–55
[30] Lobell D B 2013 Errors in climate datasets and their effects on statistical crop modelsAgric. For. Meteorol.17058–66
[31] Watson J and Challinor A 2013 The relative importance of rainfall, temperature and yield data for a regional-scale crop modelAgric. For. Meteorol.17047–57
[32] Rosenzweig Cet al2013 The agricultural model intercomparison and improvement project (AgMIP): protocols and pilot studiesAgric. For. Meteorol.170166–82
[33] Challinor A J, Wheeler T R, Slingo J M and Hemming D 2005 Quantification of physical and biological uncertainty in the simulation of the yield of a tropical crop using present-day and doubled CO2climatesPhil. Trans. R. Soc.B
3602085–94
[34] Challinor A J, Wheeler T, Hemming D and Upadhyaya H D 2009 Ensemble yield simulations: crop and climate uncertainties, sensitivity to temperature and genotypic adaptation to climate changeClim. Res.38117–27
[35] Gouache D, Bensadoun A, Brun F, Pag´e C, Makowski D and Wallach D 2013 Modelling climate change impact on Septoria tritici blotch (STB) in France: accounting for climate model and disease model uncertaintyAgric. For. Meteorol.170242–52
[36] Ruane A Cet al2013 Climate change impact uncertainties for maize in Panama: farm information, climate projections, and yield sensitivitiesAgric. For. Meteorol.170132–45
[37] Osborne T, Rose G and Wheeler T 2013 Variation in the global-scale impacts of climate change on crop productivity due to climate model uncertainty and adaptationAgric. For. Meteorol.170183–94
[38] Poulter Bet al2010 Robust dynamics of Amazon dieback to climate change with perturbed ecosystem model parameters Glob. Change Biol.162476–95
[39] Challinor A J and Wheeler T R 2008 Use of a crop model ensemble to quantify CO2stimulation of water-stressed and
well-watered cropsAgric. For. Meteorol.1481062–77
[40] Challinor A J and Wheeler T R 2008 Crop yield reduction in the tropics under climate change: processes and
uncertaintiesAgric. For. Meteorol.148343–56
[41] Lobell D B, Ortiz-Monasterio J I, Sibley A M and Sohu V S 2013 Satellite detection of earlier wheat sowing in India and implications for yield trendsAgric. Syst.115137–43
[42] Ramirez-Villegas J and Challinor A 2012 Assessing relevant climate data for agricultural applicationsAgric. For. Meteorol.16126–45