This is a repository copy of Biomass Explosion Residue Analysis. White Rose Research Online URL for this paper:
http://eprints.whiterose.ac.uk/105087/ Version: Accepted Version
Proceedings Paper:
Slatter, DJF, Sattar, H, Huescar Medina, C et al. (3 more authors) (2014) Biomass
Explosion Residue Analysis. In: Proceedings. Tenth International Symposium on Hazard, Prevention and Mitigation of Industrial Explosions (X ISHPMIE), 10-14 Jun 2014, Bergen, Norway. . ISBN 978-82-999683-0-0
[email protected] https://eprints.whiterose.ac.uk/ Reuse
Unless indicated otherwise, fulltext items are protected by copyright with all rights reserved. The copyright exception in section 29 of the Copyright, Designs and Patents Act 1988 allows the making of a single copy solely for the purpose of non-commercial research or private study within the limits of fair dealing. The publisher or other rights-holder may allow further reproduction and re-use of this version - refer to the White Rose Research Online record for this item. Where records identify the publisher as the copyright holder, users can verify any specific terms of use on the publisher’s website.
Takedown
If you consider content in White Rose Research Online to be in breach of UK law, please notify us by
Biomass Explosion Residue Analysis
David J.F. Slatter, Hamed Sattar, Clara Huéscar Medina, Gordon E. Andrews, Herodotos N. Phylaktou & Bernard M. Gibbs.
School of Chemical and Process Engineering, University of Leeds, Leeds, LS2 9JT, UK.
E-mail: [email protected]
Abstract
On account of its greenhouse gas advantages there is increasing use of pulverized biomass in power generation. However, there is little information on the combustion properties of pulverized biomass and on the explosion hazards they create in the mills, dust conveyor systems and biomass storage silos. This work uses the ISO 1 m3 dust explosion equipment to study the explosion properties and combustion characteristics of pulverized biomass dust clouds. An unreported feature of this apparatus is thatin rich concentrations only about half the dust injected is burned in the explosion. This work was undertaken to try to understand, through measuring the mass and composition of the debris at the end of the explosion, why all the pulverized biomass injected did not burn and the consequences for the measured parameters of flame speed, Pmax and Kst. One possible explanation of the results is that the residue material was formed from biomass dust blown ahead of the flame by the explosion induced wind and deposited on the vessel wall, where it was compressed as the pressure increased in the vessel. The flame side underwent flame impingement pyrolysis and the metal side was heated and compressed in the explosion but not burned. This was supported by photographic and pressure decay data that indicated the presence of a “cake” of dust being formed on the wall of the vessel. The results also show that the overpressures remain high for very rich equivalence ratios of up to 6. The reactivity of biomass was higher than coal for the two types of biomass investigated. No rich combustion limit was found. This challenges the general industry assumption that operating in very rich conditions in mills is safe. An explanation is proposed for the high peak pressures under rich conditions.
Keywords: dust explosions, combustion residue, mass burnt
Nomenclature and abbreviations
Ø equivalence ratio Pi pressure at the moment of ignition
A/F mass ratio of air to fuel MEC minimum explosible concentration H/C atomic ratio of hydrogen to carbon TGA thermogravimetric analysis
O/C atomic ratio of oxygen to carbon GCV gross calorific value (MJ/kg) VM volatile matter (wt. %) SEM scanning electron microscopy
FC fixed carbon (wt %) local heat flux density (w/m2)
daf dry, ash free basis k thermal conductivity (w/m k)
Pmax maximum explosion pressure (bara) temperature gradient(k/m) Kst deflagration index (bar m s-1)
Slatter, D., Andrews, G.E., Huescar-Medina, C., Phylaktou, H.N., Gibbs, B.M. and Satter, H.,
Biomass explosion residue analysis.
Tenth International Symposium on Hazards, Prevention, and Mitigation of Industrial Explosions (XISHPMIE)
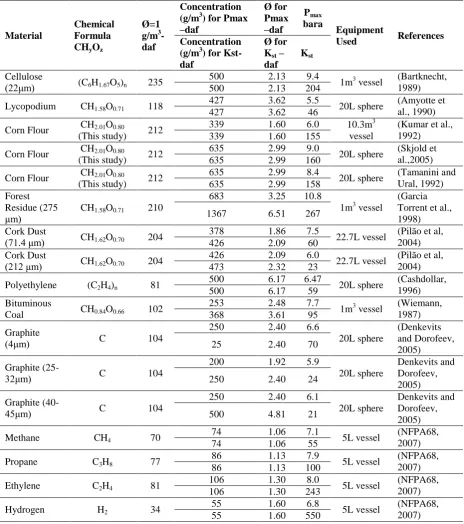
Table 1: Most reactive concentrations for different fuels.
Material
Chemical Formula CHyOz
Ø=1 g/m3 -daf
Concentration (g/m3) for Pmax
–daf Ø for Pmax –daf Pmax bara Equipment
Used References
Concentration (g/m3) for Kst-daf
Ø for Kst–
daf Kst
Cellulose
(22 m) (C6H1.67O5)n 235
500 2.13 9.4
1m3 vessel (Bartknecht,
1989)
500 2.13 204
Lycopodium CH1.58O0.71 118
427 3.62 5.5
20L sphere (Amyotte et
al., 1990)
427 3.62 46
Corn Flour CH2.01O0.80
(This study) 212
339 1.60 6.0 10.3m3
vessel
(Kumar et al., 1992)
339 1.60 155
Corn Flour CH2.01O0.80
(This study) 212
635 2.99 9.0
20L sphere (Skjold et
al.,2005)
635 2.99 160
Corn Flour CH2.01O0.80
(This study) 212
635 2.99 8.4
20L sphere (Tamanini and
Ural, 1992)
635 2.99 158
Forest Residue (275
m) CH1.58O0.71 210
683 3.25 10.8
1m3 vessel
(Garcia Torrent et al., 1998)
1367 6.51 267
Cork Dust
(71.4 m) CH1.62O0.70 204
378 1.86 7.5
22.7L vessel (Pilão et al,
2004)
426 2.09 60
Cork Dust
(212 m) CH1.62O0.70 204
426 2.09 6.0
22.7L vessel (Pilão et al,
2004)
473 2.32 23
Polyethylene (C2H4)n 81
500 6.17 6.47
20L sphere (Cashdollar,
1996)
500 6.17 59
Bituminous
Coal CH0.84O0.66 102
253 2.48 7.7
1m3 vessel (Wiemann,
1987)
368 3.61 95
Graphite
(4 m) C 104
250 2.40 6.6
20L sphere
(Denkevits and Dorofeev, 2005)
25 2.40 70
Graphite
(25-32 m) C 104
200 1.92 5.9
20L sphere
Denkevits and Dorofeev, 2005)
250 2.40 24
Graphite
(40-45 m) C 104
250 2.40 6.1
20L sphere
Denkevits and Dorofeev, 2005)
500 4.81 21
Methane CH4 70
74 1.06 7.1
5L vessel (NFPA68,
2007)
74 1.06 55
Propane C3H8 77
86 1.13 7.9
5L vessel (NFPA68,
2007)
86 1.13 100
Ethylene C2H4 81
106 1.30 8.0
5L vessel (NFPA68,
2007)
106 1.30 243
Hydrogen H2 34
55 1.60 6.8
5L vessel (NFPA68,
2007)
55 1.60 550
1. Introduction
coal as the mills operate with air transport of the dusts to the burners using rich mixtures that are assumed not to be flammable. The experimental results from this work (and that of others) indicate that these mixtures are flammable. One of the issues that are highlighted in this work is that a large proportion of the mass of dust injected into the standard 1 m3 ISO vessel was found as residue in the vessel after the test. This residue consisted of light and dark particles suggesting that it was not a homogeneous mixture; possibly made up of both burnt and unburnt material.
In dust explosions it is also known that the maximum pressure does not fall significantly as more dust is added. This suggests that the additional fuel may not be acting as a heat sink, as would be expected if it is in the dust cloud but not burned. Ann explanation of the results is that the wind ahead of the expanding flame entrains the outer dust particles and pushes them onto the wall ahead of the flame, where they are compressed as the vessel pressure rises at the end of the explosion. These particles then form a layer on the internal surface of the vessel and do not participate in the flame propagation. Thus the concentration of the mixture that the flame propagated through would be much lower than the injected mixture concentration. Depending on the thickness of the layer this could result in the outside of the compressed particle layer being scorched by the advancing flame front while the particles closer to the wall would be unaffected by the flame. Also, this wall layer of dust would act as an insulation which would reduce the rate of cooling after the explosion and this was investigated in the present work.
2. Experimental Techniques
2.1 Materials
Cornflour and Kellingley coal were used as reference materials. The biomass dusts used were pulverised oak, walnut shell dust, pine nut shell dust and pine wood dust supplied in pulverised form by Drax power station. Residues from the standard 1m3 ISO dust explosion vessel for the most reactive concentrations (highest Kst) were also analysed for their composition and size distribution.
2.2 Dust explosions
at 0.5s ignition delay (Sattar et al., 2012a,b). The inlet air valve was closed just prior to ignition. Ignition was effected by two 5kJ Sobbe chemical igniters firing into a small perforated hemispherical cup in the centre of the vessel. This ignition geometry was used in order to limit the problems of directional ignition effects and was shown to be necessary by Phylaktou et al. (2010). Explosion pressure histories were monitored using a piezoresistive pressure transducer mounted in the wall of the vessel. The rate of pressure rise was calculated by differentiation of a section of the pressure signal after elimination of electronic noise, by a smoothing.
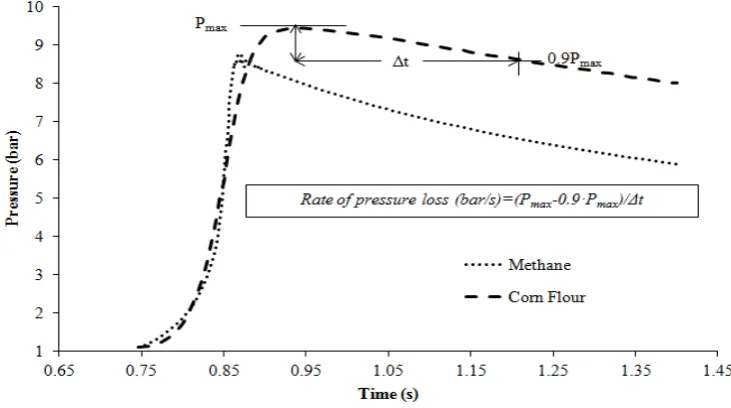
2.3 Rate of pressure loss
The rate of pressure loss after the explosion peak pressure was calculated on the basis of the time taken for 10% reduction of pressure from the peak pressure achieved during the test. 10% was chosen as it was short enough to show differences in the pressure decay rate under the different test conditions. The wall layer of dust fell off in most explosions shortly after the peak pressure and so the initial rate of pressure loss was measured when the wall layer would still be attached.
2.4 Flame temperatures
The theoretical adiabatic flame temperatures at constant pressure were calculated using the in-house adiabatic flame temperature and composition software, FLAME. This uses the C, H, N, S, O, ash, and moisture composition of the dust as well as the measured GCV.
3. Results
3.1 Burned mass as a proportion of the injected mass
A key feature of explosions in the ISO 1 m3 vessel is that a large fraction of the mass of dust injected does not burn and is left as a residue in the vessel at the end of the explosion. The burned concentration was the mass of dust injected minus the mass of dust collected from the test vessel at the end of the explosion. The mass of dust injected was the mass placed in the external pot minus the mass of dust remaining in the pot after the explosion, which was about 5-10% of the initial mass. Full details of these procedures are given by Sattar et al. (2012a, b). Most of the literature on dust explosions does not mention that a large fraction of the dust injected into the ISO 1 m3 vessel does not burn (nor do they report the mass fraction remaining in the holding pot) and hence the concentrations reported are not the dust concentrations that the flame propagates through, but a nominal “intended” concentration. Pilao et al. (2004) for cork dust explosions also detailed the large proportion of the cork dust that was left as debris at the end of the explosion.
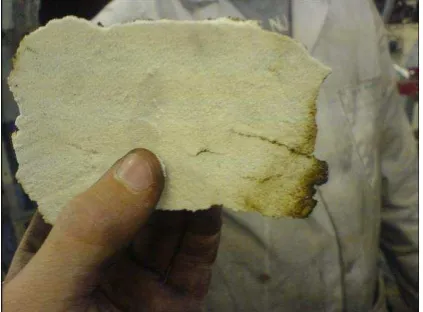
of the debris into the ‘pyrolysed’ and ‘unaffected’ fractions using density difference separation in water. For most biomass explosions the residue was a fine dust with some particles visibly darker than others, which were the pyrolysed particles.
[image:6.595.72.284.190.346.2]In the ISO 1 m3 explosion tests, two types of dust injectors were used, the standard C-ring and the spherical disperser. In the graphs that follow, the results are labeled to indicate the type of dust followed by “C-ring” or “spherical”, to identify which dust disperser was used.
Figure 1: Milk powder “cake”, wall-touching
side
Figure 2: Milk powder “cake” flame-touching
side
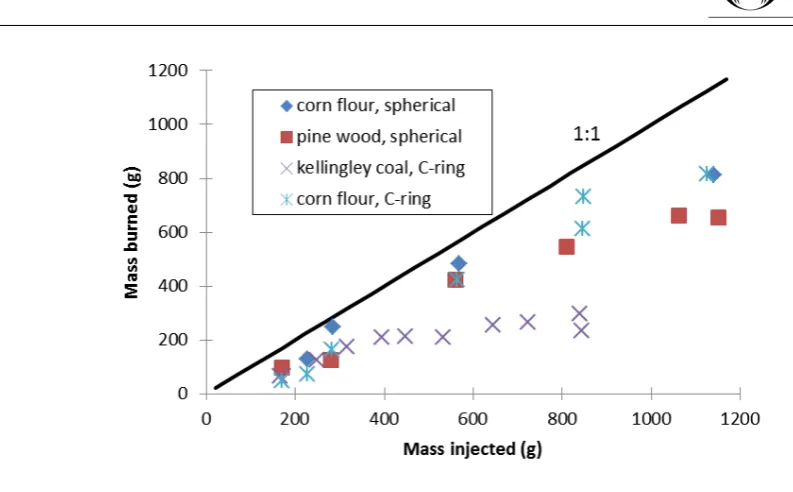
[image:6.595.305.516.191.347.2]Figure 3: Mass of powder burned as a function of mass injected
(a) (b)
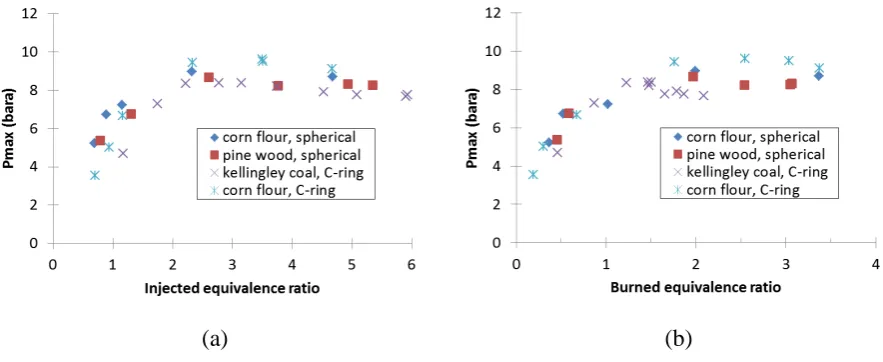
Figure 4: Fraction of mass burned as a function of (a) injected and (b) burned equivalence ratio
[image:7.595.109.536.364.539.2]This is important in pulverising mills and pneumatic conveyor systems, as dust concentrations are maintained in the rich zone by design in the anticipation that combustion, if initiated, will be weak. In the present results the directly comparable concentration to the industrial applications is the injected powder concentration or equivalence ratio. In the first instance the present results clearly show that biomass will burn more readily at a much higher fraction than coal. In the next section we will show that high overpressures and reactivity rates were also encountered for rich mixtures.
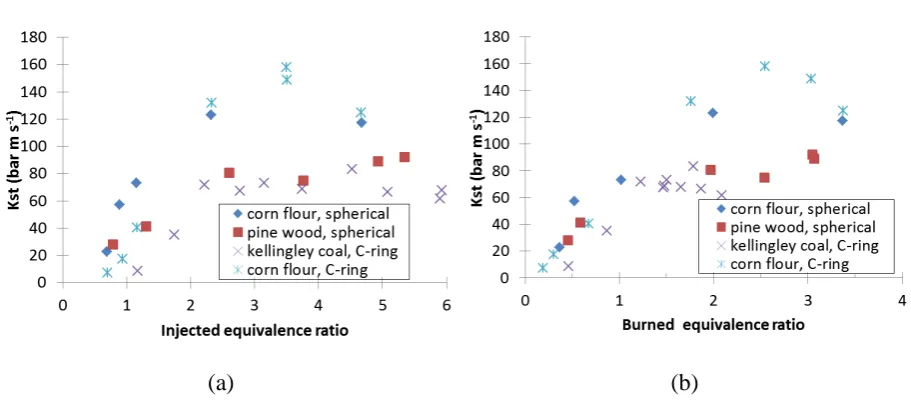
3.2 Kst and Pmax for biomass and coal dusts
The maximum pressure and the Kst reactivity parameter results are shown as a function of the injected burned equivalence ratio in Figs. 5 and 6. Cornflour dust was tested using the C ring standard injector and on the new spherical injector design for biomass. This was calibrated using propane to achieve the same turbulence level as for the C injector. A laminar explosion was carried out for propane and compared with a turbulent explosion using the same 20 bar external pot injection of air into a propane/air mixture. The ratio of the rates of pressure rise gave the turbulent enhancement factor of 4.0 for the ISO vessel. The results in Figs. 5 and 6 show that there was good agreement between the two dust injectors for Pmax at 9 bar and good agreement in the Kst of 120 bar m/s for the same burned equivalence ratio. Figures 5 and 6 show that Kellingley coal and pine wood dust had very similar peak pressures and Kst values, which were significantly lower than that for cornflour.
[image:8.595.74.516.405.586.2](a) (b)
(a) (b)
Figure 6: Kst as a function of the (a) injected and (b) burned equivalence ratio.
Fig 6b shows that for Kellingley coal the peak Kst occurs at a burned Ø = 1.8. Fig. 5b shows that the peak pressure occurred at the burned Ø of 1.2, but remained close to the peak for all the burned Ø tested. These burned equivalence ratio results show that coal does not behaves as a gas as the decay of the peak pressure and Kst for richer mixture is much slower than for a gas/air explosion (Sattar, 2012 a, b) and the peak values occur at Ø much richer than they would occur in gas explosions. Figs. 5b and 6b show that for biomass the peak pressure and Kst occur for burned mixtures in the range Ø = 2-3 with peak values for Pm and Kst reactivity higher than coal for pine wood and cornflour.
This behaviour of rich dust/air mixtures for biomass is completely different to gas/air mixtures, which have a well defined rich limit at much lower equivalence ratios than tested in this work for dusts (Sattar et al., 2012a). Some potential reasons for this are:
Adiabatic flame temperature calculations, rich mixtures continue to have high flame temperatures over a wide range of rich Ø (Sattar et al., 2012a).
In a closed vessel explosion there is a fixed mass of air and the dust is injected into this and does not displace any air. There is a fixed heat release of 3MJ per kg of air (Drysdale, 1992) irrespective of the fuel. For gases, rich mixtures have higher volume concentration and more air is displaced as the gas concentration is increased. So in a fixed volume system for rich dust/air mixtures the energy available to be released is greater than the equivalent rich gas/air mixture because of the relative mass of available air (which is the controlling reactant in rich mixtures).
Another contribution to these phenomena is that although the initial mixture pressure is 1 atm., before the powder can burn it has to turn into pyrolysis gases and when these gases are added to the fixed system volume the initial mixture pressure effectively goes up. So as the hot flame kernel develops from the ignition point progressively more volatiles are driven off the dust cloud ahead of the flame and this would have the effect that each combustion step would take place in comparatively higher pressures than the equivalent gas/air mixture. This will have a compounding effect on the final explosion pressure Pmax for dusts resulting in higher overpressures than equivalent gas air mixtures.
supports the model that the dust that did not burn were blown ahead of the flame by the explosion induced wind and deposited on the wall and did not encounter the flame until the end of the explosion.
It is more difficult to explain why the mixture reactivity, Kst, is so high for rich biomass mixtures and why the maximum reactivity is not close to Ø = 1 as it is for gases. The reason is that the combustion is controlled by the fixed amount of air in the closed volume, so that the heat release and temperature is thus constant for rich mixtures as there is 3MJ/kgair irrespective of the fuel. This is the explanation first given by Hertberg et al (1982) as the reason for coal mixtures to have high reactivity for rich mixtures. Gases displace air as the mixture is made richer so that the heat release declines as the mixture is made richer. Rich mixtures have equilibrium products with high levels of CO and H2 and at the high flame temperature that occur in constant volume dust explosions these give the mixture the highest reactivity. Biomass particles have a higher volatile release than coal and this also increases the pressure rise due to the addition of volatile gases at constant volume, this leads to even richer mixtures than for coal for the peak reactivity..
The biomass particles had quite a wide size distribution and it was expected that the explosions would preferentially burn finer particles leaving the large particles in the debris. However, Sattar et al. (2012a, b) showed that this was not the case for biomass dusts, which were found to have the same size distribution as the original material and the debris.
In a constant volume spherical explosion 90% of the fuel burns in the last 10% of flame travel. Spherical flame explosions generated a wind in the unburnt mixture ahead of the flame and this carries the dust onto the wall. This results in dust being compressed against the outer wall as the explosion pressure increases. In the case where it does not stick on the wall it momentarily forms an insulating layer which reduces the heat loss from the system. As the peak pressure reduces as the vessel cools after the explosion, the loose powder particles on the wall fall to the vessel floor. Evidence that this deposit layer forms is presented below in terms of it acting as an insulating layer that reduces the rate of cooling of the vessel and hence changing the rate of pressure loss after the peak pressure has occurred.
3.3 Pressure decay in the ISO 1m3 explosion vessel: comparison of gas and dust explosions
The rate of pressure decay from the 1m3 vessel following the explosions was recorded as shown in Fig. 7. The pressure decay was due to heat loss; not leakage, as the vessel is vacuum sealed. The decay rate was measured for the period immediately after the peak explosion pressure, until the pressure was reduced to 90% of its peak value, as shown in Fig.7. A faster decay indicated greater heat losses and Fig. 7 shows that for a gas explosion the heat loss was much faster than for a dust explosion for similar peak pressure and hence similar peak temperatures. It is considered that the rate of pressure loss is related to the thickness of dust that is deposited transiently on the wall at the end of the explosion. The dust acts as an insulation layer at the moment the flame hits the wall. The rate of pressure loss should then be a function of the thickness of the dust on the wall.
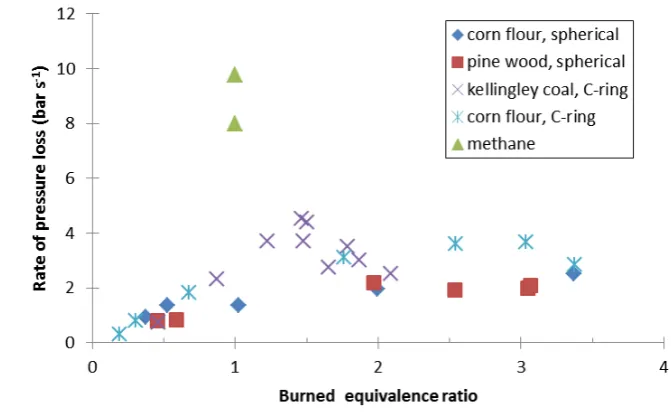
there is a maximum pressure loss rate which corresponds with the peak flame temperature; secondly, the thickness increases as more dust is used in the explosion and the mass of unburned dust increases. This increased thickness reduced the rate of pressure loss even though for rich mixtures the peak pressure and therefore temperature remain high. The pressure loss rate was higher for coal than for biomass, as expected due to the higher flame temperature for coal.
The pressure decay rate was a function of the peak temperature of the dust explosion flame and thus peak adiabatic flame temperature predictions are required to understand the pressure loss rate data. The temperature difference between the flame and the wall would drive the convective heat transfer and any dust layer would act as an insulating layer which would reduce the rate of heat loss to the metal walls. The flame temperatures were calculated, using the in house FLAME software, for a range of burned mixture equivalence ratio, Ø. The flame temperatures were computed at constant pressure and are not strictly valid for the constant volume conditions of the closed vessel explosion. However, the two temperatures are related and this work was concerned with understanding the trends in the explosions. The differential
form of Fourier's Law of thermal conduction shows that the local heat flux density, , is equal to the product of thermal conductivity, , and the negative local temperature gradient, . The heat flux density is the amount of energy that flows through a unit area per unit time.
(1)
[image:11.595.115.481.474.678.2]Therefore if the temperature difference is constant it is only the thermal conductivity of the gas/vessel boundary that dictates the rate of pressure loss. Also changes in the peak flame temperature due to the dust composition will influence the pressure decay.
Figure 8: Pressure loss rate, after the peak pressure as a function of the calculated dust wall layer thickness.
Figure 9 shows the rate of pressure decay after the peak pressure in the explosion as a function of the constant pressure flame temperature. This shows, as expected, the fastest decay for methane-air explosions with no deposits on the wall. Comparison with coal and cornflour at the same temperature gave over 50% lower pressure decay rate, indicating the presence of an insulating deposit. The peak pressure decay rate for dusts was 30% lower than for gas. This shows that the deposit thicknesses in Fig. 8, which were between 0.05 and 0.2 mm were sufficient to reduce the heat losses.
[image:12.595.73.497.69.291.2]Figure 9: Rate of pressure decay as a function of the adiabatic flame temperature at constant pressure
Figure 10: Rate of pressure loss as a function of the burned dust Ø
3 Conclusions
A key feature of explosions in the ISO 1 m3 vessel is that a large fraction of the mass of dust injected does not burn and is left as a residue in the bottom of the vessel at the end of the explosion. Most of the literature on dust explosions does not mention that a large fraction of the dust injected into the ISO 1 m3 vessel does not burn and hence the concentrations recorded are not the dust concentrations that the flame propagates through.
[image:13.595.125.461.321.528.2]and undergoes pyrolysis. It should be noted that if there is no significant heat release from these deposits then it is expected that overall the deposits left as a dust after the explosion will not to be greatly different from the raw biomass dust, as shown by Sattar (2012a, b). The deposits on the wall act as a thermal insulation and this reduces the rate of heat loss and hence the rate of pressure decay from the explosion vessel after the peak pressure. This pressure decay was shown to be slower with biomass dust explosions than for gaseous explosions with no wall insulation layer and this shows that the model has the correct key features of dust explosions in the ISO 1 m3 vessel.
The results also show that the risk of explosion with significant overpressures remains for very rich mixtures with little indication that a rich combustion limit is “near”. This challenges the general industry assumption that operating at very rich conditions (for example in mills and pneumatic conveying ducts) is safe and demonstrates that if there is indeed a rich limit for dusts, the present standard testing equipment is not capable of measuring it.
Coal explosions showed a peak reactivity close to the burned mixture Ø = 1.8, much richer than is found for gases. For biomass the burned mixture Ø was 2 – 3 for the peak reactivity and peak pressure. It was concluded that this was due to the generation of hydrogen and CO as the combustion products of rich mixtures coupled with the high flame temperatures of rich mixtures under constant volume combustion. For coal hydrogen and CO production is much lower as the char reactions are much slower. There is no evidence that char was formed as a product of combustion for biomass mixtures.
Acknowledgements
The authors gratefully acknowledge the financial contribution from John and Dorothy Slatter. We would like to thank Drax Power for the donation of power station pulverised pine dust.
References
Amyotte, P. R., Baxter, B. K. & Pegg, M. J. (1990) Influence of initial pressure on spark-ignited dust explosions. Journal of Loss Prevention in the Process Industries, 3, 261-263. Bartknecht, W. (1989) Dust explosions: Course, Prevention, Protection, Berlin Springer. Cashdollar, K. L. (1996) Coal dust explosibility. Journal of Loss Prevention in the Process
Industries, 9, 65-76.
Denkevits, A. & Dorofeev, S. (2005) Dust explosion hazard in ITER: Explosion indices of fine graphite and tungsten dusts and their mixtures. Fusion Engineering and Design, 75-79, 1135-1139.
Drysdale, D. (1992) An Introduction to Fire Dynamics, Wiley-Interscience, New York.
Garcia-Torrent, J., Conde-Lazaro, E., Wilén C., Rautalin A. (1998) Biomass dust explosibility at elevated initial pressures. Fuel, 77, 1093-1097.
Hertzberg, M., Cashdollar, K.L., Ng, D.L., Conti, R.S., Domains of flammability and thermal ignitability for pulverized coals and other dusts: Particle size dependences and microscopic residue analyses, Symposium (International) on Combustion, 19 (1982) 1169-1180.
Kruger, R.A., Fly ash beneficiation in South Africa: creating new opportunities in the market-place. Ash Resources, PO Box 3017, Randburg 2125, South Africa
Kumar, R. K., Bowles, E. M., Mintz K.J. (1992) Large-scale dust explosion experiments to determine the effects of scaling on explosion parameters. Combustion and Flame, 89, 320-332.
NFPA68 (2007) Standard on explosion protection by deflagration venting, National Fire Protection Association, Batterymarch Park, Quincy, MA 02269.
Pilao, R., Ramalho, E. & Pinho, C. (2004.) Influence of initial pressure on the explosibility of cork dust/air mixtures. Journal of Loss Prevention in the Process Industries, 17, 87-96. Slatter, D; Sattar, H; Andrews G.E; Gibbs B.M; Phylaktou H.N. (2012a.) Pulverised Biomass
Explosions: Investigation of the Ultra Rich Mixtures that give Peak Reactivity. Proc. of the IX International Seminar on Hazardous Process Materials and Industrial Explosions (IX ISHPMIE), Krakov, 2012a.
Slatter, D., Sattar H., Andrews, G.E., Gibbs, B.M., Phylaktou H.N. (2014) Biomass explosion residue analysis. Journal of Loss Prevention in the Process Industries. Submitted.
Sattar, H., Phylaktou, H.N., Andrews G.E. and Gibbs, B.M. (2012b.) Explosions and Flame Propagation in Nut-shell Biomass Powders. Proc. of the IX International Seminar on Hazardous Process Materials and Industrial Explosions (IX ISHPMIE), Krakow.
Skjold, T., Arntzen, B. J., Hansen O. R., Taraldset O. J., Storvik I. E. and Eckhoff R. K. (2005). Simulating Dust Explosions with the First Version of DESC. Process Safety and Environmental Protection, 83, 151-160.
Tamanini, F. & Ural, E. A. (1992) FMRC studies of parameters affecting the propagation of dust explosions. Powder Technology, 71, 135-151.
Wiemann, W. (1987) Influence of Temperature and Pressure on the Explosion Characteristics of Dust/Air and Dust/Air/Inert Gas Mixtures. In: Cashdollar, K. L. & Hertzberg, M. (eds.) Industrial Dust Explosions, ASTM STP 958. Philadelphia: American Society for Testing and Materials.