promoting access to White Rose research papers
Universities of Leeds, Sheffield and York
http://eprints.whiterose.ac.uk/
This is a copy of the final published version of a paper published via gold open access
in
Biomedical Optics Express
.
This open access article is distributed under the terms of the Creative Commons
Attribution Licence (
http://creativecommons.org/licenses/by/3.0
), which permits
unrestricted use, distribution, and reproduction in any medium, provided the
original work is properly cited.
White Rose Research Online URL for this paper:
http://eprints.whiterose.ac.uk/78880
Published paper
Conical scan polarization-sensitive optical
coherence tomography
Zenghai Lu,1,2 Deepa Kasaragod,1,3 and Stephen J Matcher1,*
1Department of Materials Science and Engineering, the Kroto Research Institute, University of Sheffield, North
Campus, Broad Lane, Sheffield, S3 7HQ, UK
2Department of Electronic and Electrical Engineering, University of Sheffield, Mappin Street, Sheffield, S1 3JD, UK 3Currently with the Computational Optics Group, University of Tsukuba, Tsukuba, Japan
Abstract: We report on a new articular cartilage imaging technique with potential for clinical arthroscopic use, by supplementing the variable-incidence-angle polarization-sensitive optical coherence tomography method previously developed by us with a conical beam scan protocol. The technique is validated on bovine tendon by comparing experimental data with simulated data generated using the extended Jones matrix calculus. A unique capability of this new optical technique is that it can locate the “brushing direction” of collagen fibers in articular cartilage, which is structural information that extends beyond established methods such as split-line photography or birefringent fast-axis measurement in that it is uniquely defined over the full azimuthal-angle range of (-π, + π). The mapping of this direction over the cartilage surface may offer insights into the optimal design of tissue-engineering scaffolds for cartilage repair.
©201 Optical Society of America
OCIS codes: (170.4500) Optical coherence tomography; (170.3880) Medical and biological imaging; (170.3890) Medical optics instrumentation; (260.1440) Birefringence; (260.5430) Polarization.
References and links
1. D. Huang, E. A. Swanson, C. P. Lin, J. S. Schuman, W. G. Stinson, W. Chang, M. R. Hee, T. Flotte, K. Gregory, C. A. Puliafito, and J. G. Fujimoto, “Optical coherence tomography,” Science 254(5035), 1178–1181 (1991). 2. M. R. Hee, D. Huang, E. A. Swanson, and J. G. Fujimoto, “Polarization-sensitive low-coherence reflectometer
for birefringence characterization and ranging,” J. Opt. Soc. Am. B 9(6), 903–908 (1992).
3. J. F. de Boer, T. E. Milner, M. J. C. van Gemert, and J. S. Nelson, “Two-dimensional birefringence imaging in biological tissue by polarization-sensitive optical coherence tomography,” Opt. Lett. 22(12), 934–936 (1997). 4. N. Ugryumova, S. V. Gangnus, and S. J. Matcher, “Three-dimensional optic axis determination using
variable-incidence-angle polarization-optical coherence tomography,” Opt. Lett. 31(15), 2305–2307 (2006). 5. J. F. de Boer, T. E. Milner, and J. S. Nelson, “Determination of the depth-resolved Stokes parameters of light
backscattered from turbid media by use of polarization-sensitive optical coherence tomography,” Opt. Lett. 24(5), 300–302 (1999).
6. S. J. Matcher, C. P. Winlove, and S. V. Gangnus, “The collagen structure of bovine intervertebral disc studied using polarization-sensitive optical coherence tomography,” Phys. Med. Biol. 49(7), 1295–1306 (2004). 7. B. Cense, T. C. Chen, B. H. Park, M. C. Pierce, and J. F. de Boer, “Thickness and birefringence of healthy retinal
nerve fiber layer tissue measured with polarization-sensitive optical coherence tomography,” Invest. Ophthalmol. Vis. Sci. 45(8), 2606–2612 (2004).
8. M. Yamanari, M. Miura, S. Makita, T. Yatagai, and Y. Yasuno, “Phase retardation measurement of retinal nerve fiber layer by polarization-sensitive spectral-domain optical coherence tomography and scanning laser polarimetry,” J. Biomed. Opt. 13(1), 014013 (2008).
9. E. Götzinger, M. Pircher, B. Baumann, C. Hirn, C. Vass, and C. K. Hitzenberger, “Analysis of the Origin of Atypical Scanning Laser Polarimetry Patterns by Polarization-Sensitive Optical Coherence Tomography,” Invest. Ophthalmol. Vis. Sci. 49(12), 5366–5372 (2008).
10. Y. Lim, M. Yamanari, S. Fukuda, Y. Kaji, T. Kiuchi, M. Miura, T. Oshika, and Y. Yasuno, “Birefringence measurement of cornea and anterior segment by office-based polarization-sensitive optical coherence tomography,” Biomed. Opt. Express 2(8), 2392–2402 (2011).
11. N. Ugryumova, J. Jacobs, M. Bonesi, and S. J. Matcher, “Novel optical imaging technique to determine the 3-D orientation of collagen fibers in cartilage: variable-incidence angle polarization-sensitive optical coherence tomography,” Osteoarthritis Cartilage 17(1), 33–42 (2009).
13. N. A. Patel, J. Zoeller, D. L. Stamper, J. G. Fujimoto, and M. E. Brezinski, “Monitoring osteoarthritis in the rat model using optical coherence tomography,” IEEE Trans. Med. Imaging 24(2), 155–159 (2005).
14. T. Xie, S. Guo, J. Zhang, Z. Chen, and G. M. Peavy, “Determination of characteristics of degenerative joint disease using optical coherence tomography and polarization sensitive optical coherence tomography,” Lasers Surg. Med. 38(9), 852–865 (2006).
15. A. K. Jeffery, G. W. Blunn, C. W. Archer, and G. Bentley, “Three-dimensional collagen architecture in bovine articular cartilage,” J. Bone Joint Surg. 73, 795–801 (1991).
16. S. Kamalanathan and N. D. Broom, “The biomechanical ambiguity of the articular surface,” J. Anat. 183(Pt 3), 567–578 (1993).
17. Y. Sasazaki, R. Shore, and B. B. Seedhom, “Deformation and failure of cartilage in the tensile mode,” J. Anat. 208(6), 681–694 (2006).
18. M. A. Wallenburg, M. F. G. Wood, N. Ghosh, and I. A. Vitkin, “Polarimetry-based method to extract geometry-independent metrics of tissue anisotropy,” Opt. Lett. 35(15), 2570–2572 (2010).
19. Z. H. Lu, D. K. Kasaragod, and S. J. Matcher, “Optic axis determination by fibre-based polarization-sensitive swept-source optical coherence tomography,” Phys. Med. Biol. 56(4), 1105–1122 (2011).
20. D. K. Kasaragod, Z. Lu, J. Jacobs, and S. J. Matcher, “Experimental validation of an extended Jones matrix calculus model to study the 3D structural orientation of the collagen fibers in articular cartilage using polarization-sensitive optical coherence tomography,” Biomed. Opt. Express 3(3), 378–387 (2012). 21. M. K. Al-Qaisi and T. Akkin, “Swept-source polarization-sensitive optical coherence tomography based on
polarization-maintaining fiber,” Opt. Express 18(4), 3392–3403 (2010).
22. E. Götzinger, B. Baumann, M. Pircher, and C. K. Hitzenberger, “Polarization maintaining fiber based ultra-high resolution spectral domain polarization sensitive optical coherence tomography,” Opt. Express 17(25), 22704– 22717 (2009).
23. G. Anzolin, A. Gardelein, M. Jofre, G. Molina-Terriza, and M. W. Mitchell, “Polarization change induced by a galvanometric optical scanner,” J. Opt. Soc. Am. A 27(9), 1946–1952 (2010).
24. D. K. Kasaragod, Z. Lu, and S. J. Matcher, “Comparative study of the angle-resolved backscattering properties of collagen fibers in bovine tendon and cartilage,” J. Biomed. Opt. 16(8), 080501 (2011).
25. K. Schoenenberger, B. W. Colston, D. J. Maitland, L. B. Da Silva, and M. J. Everett, “Mapping of Birefringence and Thermal Damage in Tissue by use of Polarization-Sensitive Optical Coherence Tomography,” Appl. Opt. 37(25), 6026–6036 (1998).
26. J. M. Clark, “The organisation of collagen fibrils in the superficial zones of articular cartilage,” J. Anat. 171, 117–130 (1990).
27. P. Yeh, Optical Waves in Layered Media (New York: Wiley, 1988).
28. T. Serra, J. A. Planell, and M. Navarro, “High-resolution PLA-based composite scaffolds via 3-D printing technology,” Acta Biomater. 9(3), 5521–5530 (2013).
29. W. Wilson, C. C. van Donkelaar, B. van Rietbergen, and R. Huiskes, “A fibril-reinforced poroviscoelastic swelling model for articular cartilage,” J. Biomech. 38(6), 1195–1204 (2005).
1. Introduction
Optical coherence tomography (OCT) noninvasively generates a depth-resolved cross-sectional image of biological tissue with micrometer resolution [1] and without requiring physical contact. As a functional extension of OCT, polarization-sensitive optical coherence tomography (PS-OCT) provides both depth-resolved reflectivity and birefringence images of biological tissues [2, 3]. PS-OCT has been used extensively to image birefringent biological tissues such as tendon [4], skin and muscle [5], interverteral disk [6], retinal nerve fiber [7–9], cornea and anterior segment [10] and articular cartilage [11–14].
surface at the joint surface. This model describes the lamellae as effectively terminating at the joint surface.
In addition to PLM and SEM, mechanical fracturing of the cartilage surface has also been widely used to study the collagen alignment in an en-face plane i.e. looking down on the cartilage surface. The osmotic swelling pressure generated by the interaction of water and proteoglycans means that if the surface is pricked with a needle dipped in India ink, the tissue then fractures or splits in a highly anisotropic way. The “split-line” orientations are highlighted by the ink and can then be mapped across the joint surface. The patterns are highly reproducible and have been suggested to play a role in modulating tensile mechanical properties, with a general consensus being that cartilage samples show greater tensile stiffness when strained parallel to the split-line direction than orthogonal to it [16, 17]. The SEM and split-line data have been synthesized by Jeffrey et al. [15], who propose that the split-lines are oriented perpendicular to the plane that contains the lamella surface normal at the various depths.
Studies of complicated 3-D structures using “sectioning” techniques such as SEM or PLM are difficult because the structure is projected onto a 2-D plane of arbitrary orientation. Also these techniques are destructive, making spatial mapping very laborious. Conventional PS-OCT has proved to be an excellent tool with which to qualitatively study collagen structure in cartilage. However, quantitative information is difficult to obtain because PS-OCT measures ‘apparent’ birefringence, which is determined both by the intrinsic optical anisotropy of the material and also by the orientation of the optic axis (also known as the ‘c-axis’) relative to the k-vector of the incident light beam. To separate out effects due to the 3-D orientation of the fibers from effects due to changes in the underlying birefringence itself, we introduced a novel variant of PS-OCT, which we termed variable-incidence angle (VIA) PS-OCT [4, 11, 12, 18]. The technique can determine both the polar and azimuthal angles of the collagen fibers using measurements of the ‘apparent’ birefringence at a series of incidence angles in two orthogonal planes of illumination. Previously the technique has been demonstrated using both bulk-optic time-domain (TD) [4] and fiber-based swept-source PS-OCT systems [19] at 1.3µm on equine tendon and cartilage. However, the existing VIA technique strictly requires multi-angle measurements in two orthogonal planes, which is very difficult to implement in a confined situation such as arthroscopic examination. In order to address this issue and eventually facilitate translation of the VIA-PS-OCT technique to the clinic, we introduce a more convenient imaging procedure: conical scan PS-OCT (CS-PS-OCT).
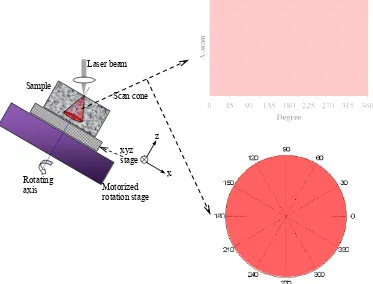
In CS-PS-OCT the beam is scanned such that the k-vector sweeps out a conical surface whose apex is chosen, for convenience, to lie at the tissue surface. In the implementation reported here we achieve this by mounting the sample on a motorized rotation stage with the sample surface roughly parallel to the stage rotating plane (i.e. normal to the stage rotation axis). The stage is mounted and tilted at a certain angle typically 45° with respect to the laser illumination beam direction. CS-PS-OCT imaging is then obtained by acquiring successive A-scans over rotation spans of 0-360° at an interval of 1°. During imaging the illumination beam is fixed and intersects the stage rotation axis at the measurement point on the sample surface. Therefore, the azimuthal angle between the beam and the tissue normal varies continuously and a polar B-scan of depth-resolved retardance is plotted.
2. System and theory 2.1 System configuration
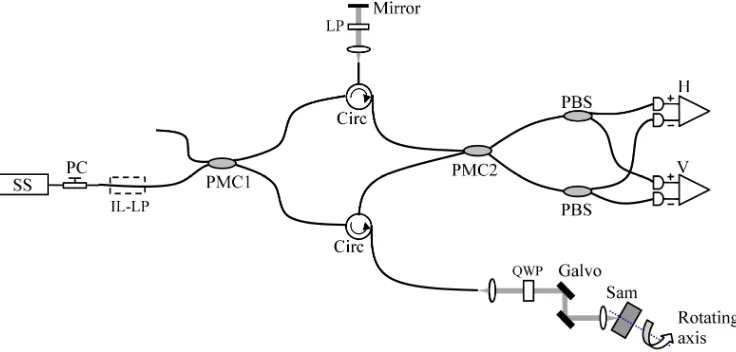
[image:5.612.122.490.192.368.2]The PMF-SS-OCT system follows the scheme reported by Al-Qaisi et al. [21] and is shown schematically in Fig. 1. The system consists of a Panda PMF-fiber Mach-Zehnder interferometer rather than a Michelson interferometer as reported previously [21, 22]. The use of a Mach–Zehnder interferometer provides two complementary outputs, simplifying balanced detection without the need for auxiliary optical components. It also benefits from reducing the mismatch of the optical dispersion between the reference and the sample arms and optimizing the power efficiency of the interferometer.
Fig. 1. Schematic diagram of the system. SS: wavelength-swept source, PC: polarization controller, IL-LP: in-line linear polarizer, PMC: polarization-maintaining coupler, QWP: quarter waveplate, PBS: polarization beamsplitter, H and V: balanced photo-detectors for horizontally and vertically polarized optical signals, respectively.
The light source is a commercially available wavelength-swept laser (HSL-2000-10-MDL, Santec, Japan). The light source has a centre wavelength of 1315nm, a wavelength range of 157nm, a full width at half maximum (FWHM) of 128nm, a wavelength scanning rate of 10 kHz, a duty cycle of about 60%, an average output power of 10mW and peak power of around 23mW. This leads to an axial resolution of ~10μm in air which was measured by using an optical mirror.
change in the incident polarization state, which is still circular on the sample. The sample arm collects the backscattered light from the sample. The collected light interferes with the light returning from the reference arm at PMC2. In-line PM fiber-optic polarization beamsplitters (PBS-31-P-2-L-3-Q, NovaWave Techno., US) are connected to the two output ports of PMC2. The horizontally and vertically polarized optical signals are detected by two balanced detectors (1817-FC, New Focus, US). The detected optical signals are sampled at 20MS/s with 14-bit resolution (M2i.4022, Spectrum GmbH, Germany).
Laser beam
Rotating axis
Sample
Scan cone
x z xyz stage
[image:6.612.120.493.161.445.2]Motorized rotation stage
Fig. 2. Schematic diagram of conical scanning (left). Polar coordinate system (right).
2.2 Conical scan
360 A-scans are used to form an image frame. The frame can be plotted as a conventional OCT B-scan, Fig. 2 (right top) or converted to a polar format Fig. 2 (right bottom), in which the radial distance is the axial imaging depth.
3. Experimental results
3.1 PS-OCT system characterization
To validate the birefringence measurements of the system, a Soleil-Babinet compensator (SBC-IR, Thorlabs, US) was used as a test target and an optical mirror as the sample reflector. The compensator is placed in the sample arm between the QWP and the galvo scanners because the device with a thickness of ~50mm in the laser illumination direction could not be fitted into the optical path after the scanners which were turned off during the measurements. In the two-axis scanner mirror arrangement, p and s polarization direction interchanges on both mirrors, hence the polarization change induced by each mirror should cancel if the mirrors match [23]. The compensator allows an arbitrary and independent setting of phase retardance over a broad wavelength range. The compensator was first calibrated at 1.3um wavelength by using the crossed polarizer configuration.
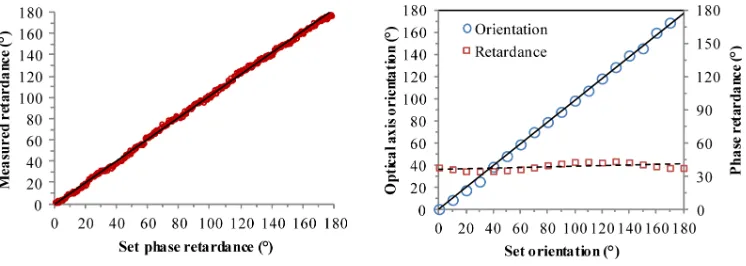
[image:7.612.121.494.362.495.2]The phase retardance of the compensator was varied from 0° to 180° in steps of 10°, and 128 depth scans were averaged for each measurement. It should be noted that the compensator itself was rotated and that the fibers in the system was left untouched. Therefore, the length mismatch of the PMFs between the reference and sample arms could be compensated numerically by data post processing from a calibration measurement only once [22]. Figure 3 (left) shows the measured phase retardance of the compensator against the retardance values set at the compensator (optic axis orientation was set at 45°). The measured phase retardance was generally in good agreement with the expected values with a linear fitted slope of 1.02 and standard deviation of the fitting residual 2°.
Fig. 3. Measured phase retardance of the compensator as a function of set retardance values (left). (right) Measured phase retardance and optic axis orientation of the compensator as a function of set orientation values.
The measured optic axis orientation of the compensator as a function of set values was shown in Fig. 3 (right). The retardance was set at a fixed value of 40° while the optic axis was varied from 0° to 180° in steps of 10°. The slope of the linear fit of measured orientation versus set orientation was 0.98 and the standard deviation of the fitting residual was ~1.5°. Figure 3 (right) also shows the measured phase retardance at these set orientation values is 38.5° with standard deviation of ~3°, indicating that the retardance measurement is insensitive to the optic axis orientation of the sample. These measurements confirm the correct functioning of the PMF-PS-OCT system.
3.2 Validation measurements on a bovine tendon sample by CS-PS-OCT
whilst frozen, such that the c-axis was oriented at a polar angle of approximately 0° (i.e. the orientation of collagen fibers are parallel to the surface of the cut). The sample was then mounted on the XYZ stage as shown in Fig. 2 (left) so that the surface of the cut was illuminated at 45° incidence in respect with the laser beam direction. The intensity and phase retardance images obtained experimentally and theoretically as a function of rotation angle are shown in Fig. 4, in which images were drawn by using conventional OCT image display processing (left column) and converting polar-coordinate based data to x-y Cartesian based ones (right column).
[image:8.612.183.431.173.474.2](rad.)
Fig. 4. Intensity (top) and phase retardance images (middle) obtained by CS-PS-OCT from a bovine tendon sample as a function of rotation angle with entire span of 360° and a 1° interval. (bottom): simulated results by using an EJMC model [20]. Image size is 1.4mm (axial) × 360° (transversal) in left column; polar radius is 1.4mm in right column.
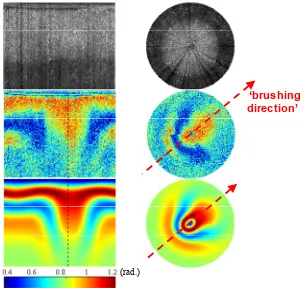
In addition to retardance images, our conical-scan system can also measure intensity (i.e. backscatter) images. The intensity images in Fig. 4 (top) show that the backscattered signal obtained from the tendon tissue close to the azimuth angles of 90° and 270° is considerably lower than that obtained at 0° and 180°. This illustrates the anisotropic backscatter behavior shown by the Type I collagen fibers in tendon tissue as reported in our previous study [24]. It is worth comparing this plot with that obtained for cartilage (Fig. 6 top), which is essentially isotropic. We previously ascribed this to the difference in scatterer size between tendon (large diameter, type-I collagen fibers) and cartilage (finer, type-II fibers).
the collagen fiber orientation angle as shown in Fig. 4, which is in general agreement with the set angle in the experiment.
In order to theoretically explain the obtained retardance images, a layered model based on the extended Jones Matrix calculus (EJMC), as previously developed by our group [20], is applied to conical-scan data from the tendon sample. The parameters upon which the model is bases is the true birefringence value 4.5 × 10⁻³ and the ordinary refractive index of the tissue
1.37, polar angle of 90° and azimuthal angle of 0-360° which are constant over the depth of the tissue, and the noise model that inputs the attenuation coefficient 2.5 × 10⁻³μm−1 and the
noise bias term σ2 = 8.3 × 10⁻². For better demonstration, attenuation is applied to the
simulated results in lateral direction i.e. different azimuthal angles, which is realized by modulating the noise bias term σ2 as sin2 function versus the azimuthal angle. The simulated
results are plotted in Fig. 4 (bottom), which is generally in good agreement with the experimental results. The fall in birefringence contrast versus depth (and azimuthal angle, for tendon) is included in our model by exponentially attenuating both OCT signals towards a fixed noise floor [25]. The azimuthal change in birefringence contrast is modeled by making the backscatter coefficient for tendon, azimuthally varying [24]. The red-dotted line represents the direction in which the type-I collagen fibers are aligned. Note how the SNR of the retardance image falls dramatically to the direction parallel to the red-dotted line, which corresponds to the long axis of the collagen fiber. This is because of the back-scatter signal falling towards the system noise floor at these angles.
3.3 Measurements on a bovine cartilage sample by CS-PS-OCT
Fresh tissue samples of bovine articular cartilage were extracted from the fetlock joint of the hindlimb of the animal obtained from the local abattoir (Fig. 5(a)). The samples were stored frozen at −20°C prior to imaging and then sectioned along the anterior side of the apex for imaging.
For articular cartilage, Clark [26] and Jeffery et al. [15] proposed a leaf-like model for the 3D collagen fiber network structure based on cryofracture scanning electron microscopy data, as shown in Fig. 5(b). The surface ‘tangential’ layer comprises typically 10% of the total thickness of the articular cartilage and consists of collagen fibers oriented parallel to the surface. This layer is followed by the ‘transitional’ zone, which as per the lamellar model of Clark et al. has collagen fibers organized into parallel sheets which arch downwards leading to the radial zone, in which the collagen fibers are oriented perpendicular to the surface. The transitional zone comprises 40-60% of the total thickness of the cartilage with the rest of the thickness consisting of the radial zone, which ultimately anchors to the subchondral bone. The model has a very organized arching of the collagen fibers in the transitional zone: it further implies that there is a ‘brushing’ direction in the cartilage i.e. the direction in which the lamellae curve is uniquely defined over the full angular range ± π.
It is a well-known [27] but important feature of birefringence that its magnitude depends not only on the degree of optical anisotropy of a fiber/long-chain-molecule but also on how this fiber is oriented relative to the k-vector of the propagating light wave. Specifically, if θc
is the angle between the k-vector and the c-axis of the fiber, whose ordinary and extraordinary refractive indices are no and ne respectively, then the apparent birefringence Δn is n – no
where
2 2
c c
2 2 2
e o
sin cos
1
n n n
θ θ
= + (1)
‘brushing direction’
Axis of split line
Collagen leaves
Calcified cartilage Bone
Surface layer
radial 400 μm transitional 500 μm
superficial 100 μm
(a)
(b)
(c)
Fig. 5. (a) Photo of the intact bovine cartilage samples used in this study. (b): Schematic presentation of proposed leaf-like mode of collagen architecture by Jeffery et al [15]. (c): A schematic of the cartilage zonal layered structure and the layer thickness used for the EJMC study. Also shown are the orientations of the polar angle of the collagen fast axis varying from 90° in the superficial zone to gradually becoming 0° in the radial zone.
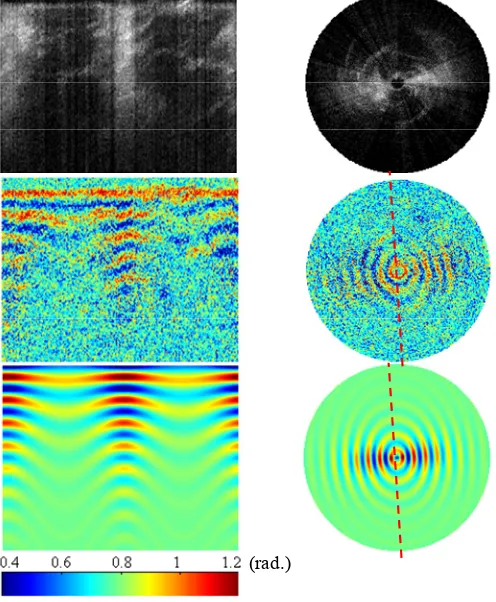
[image:10.612.196.482.75.378.2]‘brushing
direction’
[image:11.612.150.455.71.359.2](rad.)
Fig. 6. Intensity (top) and phase retardance images (middle) obtained by CS-PS-OCT from a bovine cartilage sample as a function of rotation angle with entire span of 360° and a 1° interval. (bottom): simulated results by using EJMC model [20]. Image size is 1.4mm (axial) × 360° (transversal) in left column; polar radius is 1.4mm in right column.
The simulated results as shown in Fig. 6 (bottom) generally validate the experimental results. We base our theoretical model of the articular cartilage on this leaf-like lamellar model of Jeffery et al. [15], starting with a simple model with the assumption of constant azimuth angle orientation of the collagen fibers throughout the depth of the tissue [20] as shown in Fig. 5(c). In Fig. 5(c) the polar angle in superficial layer of the tissue is 90° and 0° in the radial layer, while the depth dependent change of the polar angle is modeled as a quadratic profile a·z2 + b·z + c in the transitional layer with the used a = 1.5 × 10⁻⁵, b =
−0.1625, c = 90° and z is the depth in μm in the transitional zone. The other parameters upon which the model is based is the true birefringence value 2.0 × 10⁻³ and the ordinary refractive
index of the tissue 1.37, the azimuthal angle of 0-360° which are constant over the depth of the tissue, and the noise model that inputs the attenuation coefficient 2.5 × 10⁻³μm−1 and the
noise bias term σ2 = 6.0 × 10⁻². On the basis of this model fit we identify the low
birefringence angular direction (arrowed) as representing the aforementioned “brushing direction” of collagen fibers in the lamellae.
4. Conclusions
We present the theoretical model of bovine cartilage and compared with experimental data on bovine tendon and cartilage. Our simulation results are in good agreement with the experimental data. Hence we can conclude that our CS-PS-OCT data is consistent with Clark/Jeffery’s model of cartilage collagen organization. This provides support for the idea that collagen fibers in cartilage possess an anisotropic ‘brushed’ structure.
We have shown that this new optical technique uniquely can locate the “brushing direction” of collagen fibers in articular cartilage, which is structural information that extends beyond established methods such as split-line photography or birefringent fast-axis measurement in that it is uniquely defined over the full azimuthal-angle range of (–π, + π). The brushing direction in Fig. 5(b) and also Fig. 6 is represented by a directed arrow to illustrate the forward/backward anisotropy that is revealed by CS-PS-OCT but not by birefringent fast-axis or split-line measurements.
There are restrictions and assumptions underlying the method. Perhaps the most important is the assumption that the tissue is locally homogeneous over the conical volume swept out by the optical beam. In practice we are assuming homogeneity over ~1mm3 of tissue. Of course
the modeling procedure does not strictly require this assumption; however the chance of unambiguously and quantitatively relating the polar birefringence plot to the underlying collagen structure depends strongly on this condition being met. The appearance of a simple morphological feature such as the “comet-crescent” is an effective way of visually determining this. However, even when the condition is not met, conical-scan PS-OCT still retains an advantage over conventional PS-OCT in that the beam is more optimally inclined relative to the fibers the various zones in order to produce strong retardance signals.
It is interesting to speculate on whether there is any significant anatomical role for the observed fiber brushing direction. If so, then the mapping of this direction over the cartilage surface may offer insights into the optimal design of tissue-engineering scaffolds for cartilage repair, which are growing in sophistication through the use of additive manufacturing techniques [28]. There is also an increasing interest in determining the regional structure of collagen fibers in cartilage in order to improve the accuracy of mechanical models of the tissue [29]. New insights from conical-scan PS-OCT may then be of use in such studies. Acknowledgments
![Fig. 5. (a) Photo of the intact bovine cartilage samples used in this study. (b): Schematic presentation of proposed leaf-like mode of collagen architecture by Jeffery et al [15]](https://thumb-us.123doks.com/thumbv2/123dok_us/7946501.196547/10.612.196.482.75.378/cartilage-samples-schematic-presentation-proposed-collagen-architecture-jeffery.webp)