This is a repository copy of
Modeling driver control behavior in both routine and
near-accident driving
.
White Rose Research Online URL for this paper:
http://eprints.whiterose.ac.uk/99862/
Version: Accepted Version
Proceedings Paper:
Markkula, G orcid.org/0000-0003-0244-1582 (2014) Modeling driver control behavior in
both routine and near-accident driving. In: Proceedings of the Human Factors and
Ergonomics Society Annual Meeting. HFES 58th Annual Meeting, 27-31 Oct 2014,
Chicago, IL, USA. Sage , pp. 879-883.
https://doi.org/10.1177/1541931214581185
This is an author produced version of a paper published in Proceedings of the Human
Factors and Ergonomics Society Annual Meeting. Uploaded in accordance with the
publisher's self-archiving policy.
[email protected] https://eprints.whiterose.ac.uk/
Reuse
Unless indicated otherwise, fulltext items are protected by copyright with all rights reserved. The copyright exception in section 29 of the Copyright, Designs and Patents Act 1988 allows the making of a single copy solely for the purpose of non-commercial research or private study within the limits of fair dealing. The publisher or other rights-holder may allow further reproduction and re-use of this version - refer to the White Rose Research Online record for this item. Where records identify the publisher as the copyright holder, users can verify any specific terms of use on the publisher’s website.
Takedown
If you consider content in White Rose Research Online to be in breach of UK law, please notify us by
Modeling driver control behavior in both routine and near-accident driving
Gustav Markkula
Volvo Group Trucks Technology, Advanced Technology and Research, Göteborg, Sweden Department of Applied Mechanics, Chalmers University of Technology, Göteborg, Sweden
Building on ideas from contemporary neuroscience, a framework is proposed in which drivers’ steering and pedal behavior is modeled as a series of individual control adjustments, triggered after accumulation of sensory evidence for the need of an adjustment, or evidence that a previous or ongoing adjustment is not achieving the intended results. Example simulations are provided. Specifically, it is shown that evidence accumulation can account for previously unexplained variance in looming detection thresholds and brake onset timing. It is argued that the proposed framework resolves a discrepancy in the current driver modeling literature, by explaining not only the short-latency, well-tuned, closed-loop type of control of routine driving, but also the degradation into long-latency, ill-tuned open-loop control in more rare, unexpected, and urgent situations such as near-accidents.
INTRODUCTION
There is a wealth of existing models that describe the steering and pedal behavior exhibited by drivers to con-trol their vehicles (Plöchl & Edelmann, 2007; Markkula et al., 2012). Such models can provide great advantages in many simulation-based approaches to the study of traffic, not the least concerning road safety (van Auken et al., 2011; Markkula et al., 2012). However, as will be described here in a brief literature review, driver models have so far taken rather different forms when accounting for routine driving behavior on the one hand, and near-accident behavior on the other. To date, there have been no models that predict the differing characteristics of control behavior in these two contexts, based on a single set of underlying assumptions. The aim of this paper is to present a framework which could be capable of doing so, partially with the help of some re-cent results from the neurobiological study of sensorimotor behavior. The argument for the proposed assumptions will be based on explanations of how the resulting framework is capable of predicting typical properties of both routine and near-accident behavior, complemented with reconsideration of some existing results from the driver behavior literature.
REVIEW
Most models of routine driving (Plöchl & Edelmann, 2007) assume that drivers engage in closed-loop control, continuously updating steering and pedals in response to the traffic situation, limited only by a constantneuromuscular
delay of about 0.2 seconds. In contrast, typical models of
near-accident control (van Auken et al., 2011; Kusano & Gabler, 2012) posit singleopen-loopbraking or steering ma-neuvers of a shape that many closed-loop models have a hard time reproducing (Markkula et al., submitted), occurring af-ter a longreaction timeof about 1-2 seconds. Near-accident
maneuver amplitudes have been modeled as basically ran-dom, with reports of both overreactions (Malaterre et al., 1988) and under-utilization of vehicle capabilities (Adams, 1994), whereas in routine driving, control has been assumed to be well-tuned to vehicle and situation dynamics, some-times to the point ofoptimal control. Many routine driving models posit the use ofperceptual cues, such as the move-ment of sight points for lateral control (Salvucci & Gray, 2004), or, for longitudinal control, the optical sizeθand ex-pansion ˙θof a forward obstacle, the optically defined esti-mate of time to collisionτ=θ/θ˙ (Lee, 1976; Flach et al., 2011) or its inverse 1/τ(Kiefer et al., 2003). When such cues have been considered in near-accident control, it has been to discussdetection thresholds, the minimal stimuli at all discernible to a driver (Maddox & Kiefer, 2012). On the other hand, if thresholds have been applied in modeling of routine driving, it has mainly been to account for the
satis-ficing nature of non-critical control: To limit expended
ef-fort, drivers postpone control until conflict-describing cues get large enough (Kiefer et al., 2003; Gordon & Magnuski, 2006; Flach et al., 2011), reaching levels orders of magnitude above typical thresholds for detection.
Considering the above, one could posit two distinct classes of behavior, mediated by different neural circuitry altogether. However, there are clear difficulties to this ap-proach: Isn’t there a continuum of traffic situations between “routine” and “near-accident”? And from where does the, albeit limited, near-accident ability of handling pedals and steering wheel come, if not from routine driving experience?
NEW CONTRIBUTION
0 10 20 30 0
50
Pedals (%)
Routine car−following
0 10 20 30
−200 0 200
Pedal rate (%/s)
Time (s)
0 5
0 50
Brake pedal
(%)
Collision−avoidance braking
0 5
−2000 200 400
Brake pedal rate (%/s)
Time (s)
0 10 20 30
−20 −10 0 10
Steering wheel (°)
Routine lane keeping
0 10 20 30
−20 0 20
Steering wheel
rate (°/s)
Time (s)
0 5
−20 0 20
Steering wheel (°)
Evasive steering
0 5
−100 −50 0 50
Steering wheel
rate (°/s)
Time (s) Throttle
[image:3.612.56.551.81.208.2]Brake
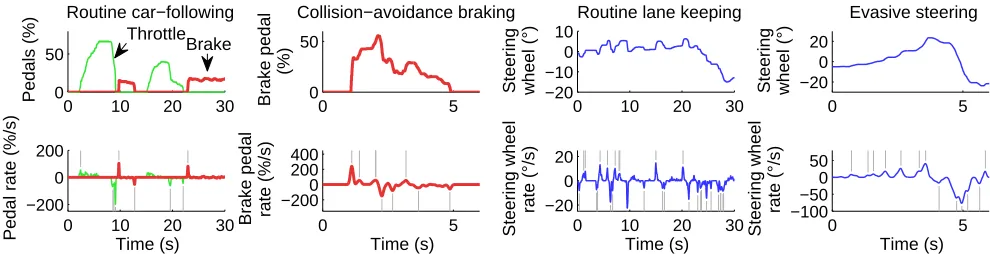
Figure 1. Example steering and pedal use in routine and near-accident situations, all from heavy truck driving in real traffic.
constructed from individual, discrete control adjustments, each of which is open-loop in the sense that the shape of the adjustment over time is predetermined already at its on-set. Fig. 1 provides examples, from a data set of natural-istic driving, of human driving control in both routine and near-accident maneuvering. The lower row of panels show rates of change of pedal and steering wheel positions. These rates stay close to zero throughout, except for intermittent upward or downward pulses of activity (highlighted with ver-tical gray lines), interpretable as the hypothesized individ-ual control adjustments. Previously, it has been observed that amplitude and maximum steering rate of severe evasive maneuvers are linearly correlated (Breuer, 1998; Markkula et al., submitted), suggesting a constant maneuver duration. Recently, Benderius and Markkula (2014) have shown that this correlation exists also for routine steering adjustments. These were found to follow bell-shaped profiles of move-ment speed, similar to what is consistently observed in labo-ratory experiments on reaching (Franklin & Wolpert, 2011). Short bell-shaped bursts of movement have been suggested to serve as spinal-level building blocks that can be com-bined and superpositioned to construct complex movement (Giszter, 2009).
It is proposed, here, that driving control adjustments are typically both small and frequent in occurrence, explaining why routine driving can nevertheless be well characterized as a continuous closed-loop activity. This would be especially true in situations like curve-taking (see the third panel from the left in Fig. 1, from about 20 s), where overall control is large in duration and amplitude, compared to the individual adjustments. However, in more urgent situations, where large changes in pedal or steering command are needed quickly, the underlying open-loop nature of control comes to the fore. Additionally, when specific sequences of movement bursts are used recurrently, these can be established as higher-level movement primitives in their own right (Giszter, 2009). Such learning could be hypothesized for longer-duration control maneuvers that are recurrently useful in traf-fic, such as gradual changes in pedal position (visible for the
throttle at 5 and 15 s in the leftmost panel of Fig. 1), inter-section turning, or lane changes, which human drivers can perform blindfolded with some, but not complete, accuracy (Cloete & Wallis, 2009).
Some previous models of driving have considered in-termittent control, occurring either at satisficing thresholds (Gordon & Magnuski, 2006) or as a result of bottlenecks in information processing (Bi et al., 2012). Here, another means of accounting for adjustment timing is adopted.
Timing distributions from noisy evidence accumulation
The second key assumption is that one needs to consider
distributionsof control timing, not only in near-accident
con-trol, but also in routine driving, and that these distributions are affected by, among other things, situation kinematics and expectancy. Specifically, it is suggested here that (a) late tim-ing of control in unexpected critical situations and (b) satis-ficing timing of control in non-critical routine situations, are governed by the same underlying mechanisms.
A strong candidate for such a mechanism is available from
accumulatormodels of action timing. These models, which
assume that action occurs after integration to threshold of sensory evidence for an action’s suitability, have been shown to account well for timing distributions in a large number of laboratory tasks, and through microelectrode recordings in behaving animals, likely neural correlates of this pro-cess have been identified (Purcell et al., 2010). Recently, Ratcliff and Strayer (2013) have successfully fitted this type of model to distributions of reaction time to one important fixed-intensity stimulus in traffic: brake lights.
headway: Test subjects, instructed to decelerate as soon as they detected a closing headway, consistently did so at lower ˙
θvalues for longer initial headways. This is precisely what would be predicted by an accumulator model where ˙θis con-sidered the stimulus intensity, since integration of a small quantity over a long time is equivalent to integration of a large quantity over a short time. To see this in more detail, consider the following simple accumulator:
dA(t)
dt =C·P(t)−M+
ε(t) (1)
WhereP(t)is a stimulus,CandMare model parameters, and ε(t)is noise, and where detection occurs whenA(t)≥A0. This specific formulation is inspired by Purcell et al. (2010). In line with their interpretation ofAas a neuron firing rate, this quantity is constrained toA(t)≥0.
The upper panels of Fig. 2 illustrate the behavior of this model, withP(t) =θ˙(t),C=1, and zero noise, parameter-fitted (M=0.000554 rad/s;A0=0.00143 rad) to reproduce the detection thresholds reported by Lamble et al. (1999) for zero gaze eccentricity. With a longer initial headway, ˙
θgrows more slowly, meaning thatA will reach threshold later in time, but at a lower final ˙θvalue, just as observed in the experiment. The lower panels of Fig. 2 hint at how the same model could also account for the observed increasing thresholds and variance with increasing gaze eccentricity, by including a non-zero noise termε(t), and makingCa nonlin-ear function of eccentricity (not pursued further here).
The experiment of Lamble et al. (1999) was not intended to approximate satisficing driver behavior. For a step in that direction, consider the results reported by Kiefer et al. (2003). These authors instructed drivers to wait to the last second deemed possible before applying “normal” or “hard” braking, in response to a set of test track scenarios with a lead vehicle mockup. This is also a rather artificial task, but arguably at least the normal braking condition could come somewhere close to routine, satisficing headway con-trol. It is interesting to note, then, that the observed pat-tern of inverse times to collision (TTC) at response, in the normal-braking scenarios with lead vehicle deceleration, can be well explained (R2=0.91) by an accumulator model with
P(t) =θ˙(t)/θ(t) =1/τ(t); see Fig. 3 (M =0.00155 s−1;
A0=0.0888). For the scenarios without deceleration, on the other hand, the same model predicts a much earlier response than what was observed. This could mean that there is some fundamental flaw to the accumulator approach, but it could also be that the drivers were using some other perceptual cue than just 1/τ, or that the “last-second normal braking” task was further from routine driving behavior in the scenarios without deceleration.
In any case, in real traffic, driver behavior is not based solely on responding to graded perceptual quantities such as 1/τ. Fig. 4 provides an illustration of how Eq. (1) can be un-derstood in this broader context. For example, braking may
0 2 4
0 5
x 10−3
M
d
θ
/dt (rad/s)
Time (s)
0 2 4
0 1 2
x 10−3
A
0
A (rad)
Time (s) 20 m
40 m
Detection
0 20 40 60 80 0
0.01 0.02
Eccentricity (°)
d
θ
/dt at
detection (rad/s)
20 m 40 m
0.2 0.4 0.6 0.8 1 0 0.01 0.02
C (−)
d
θ
/dt at
[image:4.612.317.551.81.251.2]detection (rad/s)
Figure 2. The 20 m and 40 m headway scenarios of Lamble
et al. (1999). Top left: Growth of ˙θover time. Top right: Ac-cumulator model fitted to detection thresholds observed for zero gaze eccentricity, and illustration of model with noise (light blue trajectories and detection distribution). Bottom left: Detection thresholds (mean and standard deviation) as a function of gaze eccentricity, as observed by Lamble et al. Bottom right: Prediction from model with noise, at values of Cselected to roughly match the data in the left panel.
0 0.1 0.2
Scenario
Inverse TTC at brake onset (1/s)
30/30/0.1530/30/0.2830/30/0.3945/45/0.1545/45/0.2845/45/0.3960/60/0.1560/60/0.2860/60/0.39
30/0/045/0/060/0/0
Kiefer et al. data Model
Figure 3. Accumulator model fit of “normal” last-second
braking onset data from Kiefer et al. (2003), for decelerating and stationary lead vehicle scenarios (own speed in mph/lead vehicle speed in mph/lead vehicle deceleration ing).
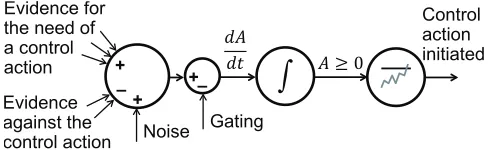
be triggered without optical expansion, based on other evi-dence for its need, such as a brake light onset, or a red traffic light ahead of the lead vehicle. Conversely, braking may not occur despite optical expansion due to counter-evidence such as the traffic light shifting to green, or the lead vehicle’s turn indicator activating.
[image:4.612.315.549.392.502.2]Evidence against the control action Evidence for the need of a control action
Noise +
+ –
Gating +
ܣ 0
Control action initiated ݀ܣ
݀ݐ
[image:5.612.52.299.79.154.2]–
Figure 4. Schematic illustration of the proposed accumulator
account of control adjustment timing.
by Purcell et al., 2010) together with all the other available evidence for and against the control adjustment. If so, the pa-rameterMshould vary with expectancy: In situations where the driver would normally not at all expect a need for a con-trol adjustment,Mwill be larger, dA/dtwill be smaller, the driver will be correspondingly desensitized to the perceptual quantityP, and the time to response will be prolonged.
Magnitude of adjustments tuned to sensory inputs
Another important assumption, which may not be surpris-ing given what has been said so far, is that the magnitude of each control adjustment is affected by the situation at hand. Specifically, it is suggested here that in routine, steady state driving, each control adjustment aims to resolve the situation that triggered it. A steering adjustment caused by a moving far point aims to immobilize the far point, a brake application caused by a looming lead vehicle aims to stop the looming. For often-encountered driving situations, drivers will have had ample time to learn suitable mappings from sensory in-put to control adjustment, acquiring a near-optimal trade-off between effort and performance, and what can be interpreted as a thorough understanding of their vehicle’s dynamics. See (Markkula, 2013) for a sketch of how the far point control law suggested by Salvucci and Gray (2004) could be un-derstood in this way. However, in more critical situations, typically previously unexperienced by the driver, the same mappings may no longer be as well-tuned to the situation or to the vehicle (Markkula et al., submitted), and this could explain reports of driver overreactions or underreactions in near-accident maneuvering. Furthermore, a possibly relevant neurobiological phenomenon in this context ismotor noise, inherent variability in motor output which typically scales with movement amplitude (Franklin & Wolpert, 2011), such that large pedal or steering movements will be more likely to turn out far from what was intended by the driver.
Forward-model prediction of sensory input
An important follow-up question to what has been said so far is: When a control-adjusting burst of activity has been generated, how long time must pass before the next one can occur? To begin with, the previously cited work on motor
primitives (Giszter, 2009) as well as Fig. 1 suggest that one does not have to await the completion of the first burst; con-trol adjustments can be additively superpositioned. But if each control adjustment aims to completely resolve the situ-ation that triggered it, such as suggested above, then super-position should not be needed. Rather, it would seem inap-propriate to generate any further control until the vehicle has fully responded, with its inherent delays, to the first adjust-ment.
One possibility here is that the accumulator is simply re-set to zero or some intermediate value after reaching thresh-old, and that during the time after the first control adjust-ment, when the original situation is still not fully resolved, the delays of the accumulation process in itself is enough to withhold further control response. A more elegant solution, with neurobiological support, would be that when the mo-tor command for the first control adjustment is generated, an
efference copyof this command is sent to parts of the brain
(especially the cerebellum), which are capable of generating
forward modelpredictions of the effect of the motor action
on future sensory input (Franklin & Wolpert, 2011). It is thus proposed here that after each control adjustment, a prediction Pp(t)is formed of howP(t)will respond, e.g. by gradually
falling to zero. Pp(t)is then included as an inhibitory input
to the accumulator, such that what is driving the accumulator is actually notP(t), butP(t)−Pp(t).
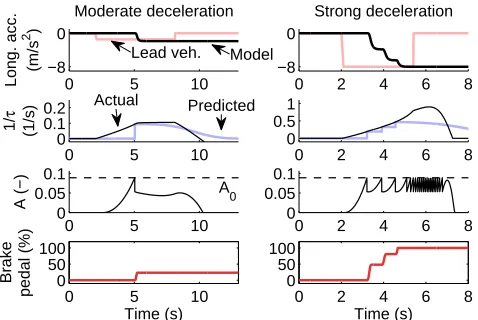
Fig. 5 illustrates the behavior of the brake reaction model fitted to the Kiefer et al. (2003) data (Fig. 3), complemented with (a) a linear mapping from 1/τat brake adjustment on-set to adjustment amplitude, well-tuned for moderate levels of lead vehicle braking, and (b) a simple forward model of how 1/τwill respond to such adjustments. Full details of these simulations are beyond the scope here; they are shown merely as a qualitative illustration of the proposed framework principles. Specifically, it can be noted how an unusually high lead vehicle deceleration causes an initial underreaction, followed by increases in pedal position later on.
DISCUSSION
Many testable predictions can be made based on the framework proposed here. For example, in both routine and near-accident situations, control timing should be affected by the dynamics of both traffic situation and evidence accumu-lation, such as preliminarily suggested here for the Kiefer et al. (2003) data set. To test this prediction in more detail, controlled experiments are needed, where situation dynamics are varied while keeping constant any other evidence to the driver for or against the need of control adjustments.
0 5 10 −8
0
Long. acc. (m/s
2 )
Moderate deceleration
0 5 10
0 0.1 0.2
1/
τ
(1/s)
0 5 10
0 0.05 0.1
A (−)
A
0
0 5 10
0 50 100
Time (s)
Brake
pedal (%)
0 2 4 6 8
−8 0
Strong deceleration
0 2 4 6 8
0 0.5 1
0 2 4 6 8
0 0.05 0.1
0 2 4 6 8
0 50 100
Time (s) Lead veh. Model
[image:6.612.56.295.81.241.2]Actual Predicted
Figure 5. A braking model based on the proposed
frame-work, in two scenarios with lead vehicle deceleration.
models can be extended to better account for control, most immediately in situations where longer-duration learned ma-neuvers should be rare, such as keeping in a lane with low curvature, or car-following at roughly constant speed.
It should be noted that several factors important for driv-ing control have been left out of the scope here, such as arousal, cognitive control, and sensorimotor learning (Engström et al., 2013). However, the proposed framework seems highly amenable to extensions in these directions, probably more so than alternative frameworks based on for example control theory.
References
Adams, L. D. (1994).Review of the literature on obstacle avoidance
maneuvers: braking versus steering(Tech. Rep. No. UMTRI-94-19). University of Michigan.
Benderius, O., & Markkula, G. (2014). Evidence for a fundamental
property of steering. InProceedings of the Human Factors and
Ergonomics Society 58th annual meeting.
Bi, L., Gan, G., Shang, J., & Liu, Y. (2012). Queuing network modeling of driver lateral control with or without a cognitive
distraction task. IEEE Transactions on Intelligent
Transporta-tion Systems,13(4), 1810–1820.
Breuer, J. (1998). Analysis of driver-vehicle-interactions in an
eva-sive manoeuvre - results of ’moose test’ studies. InProceedings
of the 15th ESV conference(pp. 620–627).
Cloete, S., & Wallis, G. (2009). Limitations of feedforward
con-trol in multiple-phase steering movements. Experimental Brain
Research,195(3), 481–487.
Engström, J., Victor, T. W., & Markkula, G. (2013). Attention selection and multitasking in everyday driving: A conceptual
model. In M. A. Regan, T. W. Victor, & J. D. Lee (Eds.),Driver
distraction and inattention: Advances in research and counter-measures.Ashgate.
Flach, J. M., Jagacinski, R. J., Smith, M. R. H., & McKenna, B. P. (2011). Combining perception, action, intention, and value: A
control theoretic approach to driving performance. In D. Fisher,
M. Rizzo, J. Caird, & J. D. Lee (Eds.),Handbook of driving
sim-ulation for engineering, medicine, and psychology(chap. 43). CRC Press / Taylor & Francis.
Franklin, D., & Wolpert, D. (2011). Computational mechanisms of
sensorimotor control.Neuron,72, 425–442.
Giszter, S. F. (2009). Motor primitives. In L. R. Squire (Ed.), Encyclopedia of neuroscience(pp. 1023–1040). Elsevier. Gordon, T., & Magnuski, N. (2006). Modeling normal driving as a
collision avoidance process. InProceedings of the 8th
interna-tional symposium on advanced vehicle control.
Kiefer, R., Cassar, M., Flannagan, C., LeBlanc, D., Palmer, M.,
Deering, R., & Shulman, M. (2003). Forward collision
warn-ing requirements project: Refinwarn-ing the CAMP crash alert timwarn-ing approach[...](Final Report No. DOT HS 809 574). U.S. De-partment of Transportation.
Kusano, K. D., & Gabler, H. C. (2012). Safety benefits of for-ward collision warning, brake assist, and autonomous braking
systems in rear-end collisions.IEEE Transactions on Intelligent
Transportation Systems,13(4), 1546–1555.
Lamble, D., Laakso, M., & Summala, H. (1999). Detection thresh-olds in car following situations and peripheral vision:
implica-tions for positioning of visually demanding in-car displays.
Er-gonomics,42(6), 807–815.
Lee, D. (1976). A theory of visual control of braking based on
information about time-to-collision.Perception,5(4), 437–459.
Maddox, M. E., & Kiefer, A. (2012). Looming threshold limits
and their use in forensic practice. InProceedings of the Human
Factors and Ergonomics Society 56th annual meeting.
Malaterre, G., Ferrandez, F., Fleury, D., & Lechner, D. (1988).
Decision making in emergency situations. Ergonomics,31(4),
643–655.
Markkula, G. (2013). Evaluating vehicle stability support systems
by measuring, analyzing, and modeling driver behavior. Licen-tiate thesis, Chalmers University of Technology, 2013.
Markkula, G., Benderius, O., & Wahde, M. (submitted). Comparing and validating models of driver steering behaviour in collision avoidance and vehicle stabilization.
Markkula, G., Benderius, O., Wolff, K., & Wahde, M. (2012). A
re-view of near-collision driver behavior models. Human Factors,
54(6), 1117–1143.
Plöchl, M., & Edelmann, J. (2007). Driver models in automobile
dynamics application. Vehicle System Dynamics,45(7-8), 699–
741.
Purcell, B. A., Heitz, R. P., Cohen, J. Y., Schall, J. D., Logan, G. D., & Palmeri, T. J. (2010). Neurally constrained modeling of
per-ceptual decision making. Psychological Review,117(4), 1113–
1143.
Ratcliff, R., & Strayer, D. (2013). Modeling simple driving tasks
with a one-boundary diffusion model. Psychon Bull Rev. doi:
10.3758/s13423-013-0541-x
Salvucci, D., & Gray, R. (2004). A two-point visual control model
of steering. Perception,33, 1233–1248.
van Auken, R. M., Zelner, J. W., Chiang, D. P., Kelly, J., Silberling,
J. Y., Dai, R., . . . Sugimoto, Y. (2011). Advanced crash