HIGH RATES OF EVOLUTION PRECEDED THE
ORIGIN OF BIRDS
Mark N. Puttick,1,2Gavin H. Thomas,3and Michael J. Benton1
1School of Earth Sciences, University of Bristol, Wills Memorial Building, Queen’s Road, Bristol, BS8 1RJ, United Kingdom
2E-mail: [email protected]
3Department of Animal and Plant Sciences, University of Sheffield, Alfred Denny Building, Western Bank, Sheffield S10
2TN, United Kingdom
Received November 13, 2013 Accepted January 14, 2014
The origin of birds (Aves) is one of the great evolutionary transitions. Fossils show that many unique morphological features of modern birds, such as feathers, reduction in body size, and the semilunate carpal, long preceded the origin of clade Aves, but some
may be unique to Aves, such as relative elongation of the forelimb. We study the evolution of body size and forelimb length across the phylogeny of coelurosaurian theropods and Mesozoic Aves. Using recently developed phylogenetic comparative methods, we find an increase in rates of body size and body size dependent forelimb evolution leading to small body size relative to forelimb length in Paraves, the wider clade comprising Aves and Deinonychosauria. The high evolutionary rates arose primarily from a reduction in body size, as there were no increased rates of forelimb evolution. In line with a recent study, we find evidence that Aves appear to have a unique relationship between body size and forelimb dimensions. Traits associated with Aves evolved before
their origin, at high rates, and support the notion that numerous lineages of paravians were experimenting with different modes of flight through the Late Jurassic and Early Cretaceous.
K E Y W O R D S : Aves, birds, dinosaurs, evolution, flight, morphology.
Did preadaptations for flight precede the origin of birds (Aves)? The origin of flight in birds is one of the great evolution-ary transitions and has received considerable attention in recent years (Padian and Chiappe 1998; Clarke and Middleton 2008; Dececchi and Larrson 2009; Benson and Choiniere 2013; Decec-chi and Larrson 2013). The evolution of birds is often consid-ered coincident with the origins of flight, but many traits asso-ciated with flight evolved before the origin of Aves (Padian and Chiappe 1998). Furthermore, the discovery of new fossils, espe-cially from China (Hu et al. 2009; Xu et al. 2011, 2003; Godefroit et al. 2013; Zheng et al. 2013), and the publication of new phy-logenies (Turner et al. 2012; Godefroit et al. 2013; O’Connor and Zhou 2013) and functional studies (Gatesy 1990; Gatesy and Dial 1996; Middleton and Gatesy 2000; Turner et al. 2007; Clarke and Middleton 2008; Nesbitt et al. 2009; Nudds and Dyke 2010; Sullivan et al. 2010; Novas et al. 2012; Allen et al. 2013; Dececchi and Larrson 2013) continue to challenge and shape our understanding of the route to, and appearance of, the
morpholog-ical conditions required for flight. What was once seen as a rapid
adaptive radiation, in whichArchaeopteryxrapidly acquired 30
or more avian apomorphies, is now seen as a stepwise process of more than 50 million years (Padian and Chiappe 1998). Dif-ferent names have been applied to birds, with Aves sometimes restricted to the crown group; but here we use Aves in the
tradi-tional sense, to refer to the clade that encompassesArchaeopteryx,
all extant birds, and all the fossil forms in between (Padian and Chiappe 1998).
Large-scale events and patterns in macroevolution may re-veal a great deal of information about the acquisition of novel characters when they are assessed using new numerical meth-ods. Here, we study the origin of birds (Aves) from bird-line ar-chosaurs (theropod dinosaurs) using recently developed phyloge-netic comparative methods (PCMs). PCMs have frequently been used in biology to investigate rates and modes of evolution using molecular phylogenies (O’Meara et al. 2006; Thomas et al. 2009; Harmon et al. 2010; Venditti et al. 2011) and are increasingly
C
being employed to complement classical numerical techniques in paleobiology (Sookias et al. 2012; Benson and Choiniere 2013; Zanno and Mackovicky 2013).
“Avian” traits are a mixture of Aves-specific characters, and those shared with the wider clade of related theropod dinosaurs (Padian and Chiappe 1998). Many morphological changes as-sociated with Aves are now known to have predated the origin of the birds, and have origins unrelated to flight (Padian and Chiappe 1998; Sullivan et al. 2010). There is disagreement, how-ever, about the relative timing of two important flight-related adaptations, body size miniaturization and forelimb lengthening. Many authors place the reduction in body size on the line to Paraves, the clade comprising Aves and Deinonychosauria (Xu et al. 2003; Turner et al. 2007; Novas et al. 2012). However, a recent study investigating rates of morphological change using PCM (Benson and Choiniere 2013) showed increased rates of hindlimb evolution in Pygostylia, a clade nested within Aves, and although it was not explicitly a study of body-size evolution, it did not detect miniaturization of the Paraves. A further substantial change associated with flight was elongation of the forelimb rel-ative to body size, which has been found to be exclusive to Aves (Dececchi and Larrson 2013). It remains unclear whether these are Aves-specific changes (Clarke and Middleton 2008; Dececchi and Larrson 2013), or changes that began prior to, and continued after, the origin of Aves (Dececchi and Larrson 2009; Novas et al. 2012).
Here, we attempt to resolve the controversies over the origins of avian flight using a series of phylogenetic comparative analyses of the trajectories and rates of evolution of body size and forelimb length. Rates of character trait evolution are of huge importance in biology, and particularly in paleobiology (Gingerich 2009). Rates of phenotypic evolution in the fossil record can be measured using both phylogenetic (Eastman et al. 2011; Venditti et al. 2011; Thomas and Freckleton 2012; Slater 2013) and nonphylogenetic approaches (Hunt 2007). Evolutionary rates can vary among the branches of phylogenetic trees in subtle ways that can be difficult to disentangle but can have different evolutionary interpretations. Of particular relevance is whether miniaturization and forelimb elongation (1) evolved rapidly preceding Aves, (2) evolved rapidly preceding Paraves, (3) was a rapid but gradual process nested within either of these clades, or (4) followed a hitherto unexpected pattern.
We find that, as noted before (Padian and Chiappe 1998; Sullivan et al. 2010), morphological changes associated with flight preceded the origin of Aves. Our results largely support those previous analyses of character evolution in bird-line ar-chosaurs that infer miniaturization leading to the Paraves (Turner et al. 2007; Novas et al. 2012), with no apparent changes in rates of forelimb evolution (Dececchi and Larrson 2013), leading to a larger forelimb for a given body size in the Paraves.
Addition-ally, we observe that the relationship between forelimb length and body size varies between nonparavian theropods, Paraves, and Aves (Dececchi and Larrson 2013), but the precise interpre-tation differs between different phylogenies and taxonomic defi-nitions. Overall, our results consistently show a move to a small body size, without a concurrent reduction in forelimb length, in Paraves.
Materials and Methods
PHYLOGENIESWe compiled phylogenies that represent composites of two recently published source phylogenies. Our primary (here-after “main”) phylogeny includes a substantial sample of all coelurosaurian theropods (those more derived than Tyran-nosauroidea) from compsognathids to maniraptorans, including Mesozoic Aves, reflecting the focus of the study. The phylogeny is complete for relatively well-represented fossil taxa, but it ex-cludes those based on fragmentary fossils or whose validity is questioned. The main source phylogenies are a comprehensive tree of theropods (Turner et al. 2012), and a Mesozoic avian phy-logeny (O’Connor and Zhou 2013). We further complemented the main composite tree by the addition of species missing from the source phylogenies, and by the resolution of polytomies.
For the main phylogeny, we excluded Jixiangornis and
Shen-zhouraptoras they are considered possible synonyms of
Jeholor-nis(Zhou and Li 2010). In our main tree,Epidexipteryxis
clas-sified as a nonavian paravian (Dececchi and Larrson 2013) and
Epidendrosaurusis also excluded from the main analyses as it
represents a juvenile (Zhang et al. 2002). Further, in the main
analyses,Microraptor zhouianusis synonymous with
Microrap-tor gui(Gong et al. 2012; Xing et al. 2013).
We tested the sensitivity of our analyses to alternative phylo-genetic topologies and branch lengths with four additional trees: (1) the recent phylogeny of Godefroit et al. (2013), in which the
new taxon Aurornisis regarded as the most basal bird, with a
sister-group relationship between the Troodontidae and Aves; in this phylogeny no species are added, and any polytomies are re-duced to descending species; (2) a revised version of the main tree with possible synonyms and juveniles added for complete-ness (“full”); (3) an alternative version of the main tree (called
“arch”) with the single change of placingArchaeopteryxoutside
Aves to be the most basal member of the troodontids; and (iv) a final tree (“alt. branch”) based upon the full tree, and including
from synoptic resources and current primary literature. In all trees, branch lengths were scaled to time using fossil occurrence dates of taxa in the tree (Brusatte et al. 2008), using a script written for R (http://www.graemetlloyd.com/methdpf.html). This method dates nodes according to their oldest descendant taxon, but this means that all nodes would contain zero branch lengths, even if the first occurrences in the fossil record are congruent with phylogeny, because each node is dated by its oldest descendant. Therefore, a unit of time is added to the descendant of the node from a preceding branch length to prevent zero-length branches (Brusatte et al. 2008). As the root length also contributes to the sharing of time between descendant branches, the root length can influence branch lengths elsewhere in the tree. For the main tree, the root branch length was set to either five or 10 million years, meaning that the root is placed at either 171 Ma or 176 Ma. These estimates are broadly in line with stratigraphy for the ori-gin of coelurosaurians that are more derived than tyrannosauroids (Carrano et al. 2012). To test for the possibility that underesti-mated branch lengths might have an effect on rate calculations (e.g., leading to false inference of high rates), we added the
dubi-ous theropodEshanosaurus deguchiianusfrom the Early Jurassic
(Barrett 2009; Zanno 2010) to the main phylogeny, thereby plac-ing the root of the tree back to around 200 Ma and havplac-ing the effect of lengthening internal branches on the phylogeny. We consider
the effects ofEshanosaurusto be extreme: the branch length
lead-ing to Paraves is almost 20×longer (6.08 Ma) for trees including,
compared to those excluding,Eshanosaurus(0.31 Ma on the full
tree).
As a further test of the influence of branch lengths on rate calculations, we undertook a sensitivity analysis using the timePa-leoPhy function in the R package paleotree (Bapst 2013). In these analyses, we used the following settings: alternative branch-scaling methods, minimum-branch length (set to 2 Ma) in which branches are set to a minimum defined value and later branches are shortened to accommodate the true timing of diversification; additive branch length (with an additive value of 1 Ma), so 1 Ma is added to each branch; and equal, which is equivalent to the Graeme Lloyd script but here takes dates from a uniform distribu-tion of the age range. For the main phylogeny, and the phylogeny based on Godefroit, we obtained a sample of five trees for each of these three branch-scaling methods; age ranges of taxa were taken from the Paleobiology database (Carrano et al. 2013).
MORPHOLOGICAL CHARACTERS
Data were collected on the length of the femur and forelimb ele-ments. Femur length is a widely used proxy for overall body size in theropods, which itself is a proxy for a large number of biolog-ically relevant traits (Carrano 2006). Forelimb size is recorded as
total humerus+forearm (radius or ulna)+manus lengths. All
data were collected from published sources and the Paleobiology
database (Carrano et al. 2013), and multiple measurements were recorded as means. Measurements for all elements were prefer-ably taken from a single specimen, but as we wanted to maximize the number of taxa included, this was not always possible. Clearly there could be problems in assessing relative metrics if data for femur and forelimb lengths are taken from animals of very differ-ent body sizes. As a mitigation, the analyses were run twice, first with our compiled data (Carrano 2006, and other sources) and then with data from a single paper (Dececchi and Larrson 2013). The body size proxy from this source was snout-vent length (SVL), an alternative to femur length; although femur length is widely used as a proxy for body size in theropod dinosaurs (Carrano 2006), another view is that it may be a poor estimator of body size in Paraves, particularly among Aves (Dececchi and Larrson 2013). Prior to analysis, all data were log-transformed. All data and phy-logenies are available at doi.org/10.6084/m9.figshare.820135.
We found morphological data on femur length from 125 species and on forelimb length from 76 species, of which 71 species had data on both femur and forelimb. Branch lengths were estimated on complete phylogenies, which were subsequently pruned to match the available data. The final trees with the effec-tive tree size for femur (125 species), forelimb (76 species), and femur and forelimb (71 species) are shown (Fig. S1).
MODELS OF TRAIT EVOLUTION
We modeled morphological evolution using four complementary phylogenetic comparative methods: (1) we estimated the phylo-genetic position and magnitude of changes in the rate of evolution of body size and forelimb length using the trait MEDUSA method of Thomas and Freckleton (2012); (2) we compared the mode and rate of evolution for body size and forelimb among Paraves, Aves, and nonparavian Theropoda; (3) we assessed the fit of models of directional evolution of body size in Paraves and Aves respectively to test if miniaturization continued within either of these clades; and (4) we tested for changes in the coevolutionary relationship between body size and forelimb length among Paraves, Aves, and nonparavian Theropoda. Below we describe the models in detail.
i. Rates of evolution
rate at each clade and individual branch in turn, to locate the shift that most improves the likelihood of the model. This single shift is fixed and is the starting point for the next step, where a second shift is located. This process continues up to a user-defined maximum number of shifts (Thomas and Freckleton 2012). The best over-all model is assessed by comparison of the Akaike Information Criterion (AIC) among the best constant-rate, one-shift, two-shift and so on models. Alternative approaches to identifying shifts in evolutionary rates have been developed that use Reversible-Jump MCMC methods (Eastman et al. 2011; Venditti et al. 2011). The RJMCMC method of Eastman et al. (2011), as used by Benson and Choiniere (2013), only allows rate shifts to occur across whole clades. This is an important constraint, because shifts that occur along a single internal branch cannot be readily identified and the method may instead average such a high rate on a single branch across all descendant lineages, so leading to the false inference of high rates across whole clades. The RJMCMC method of Venditti et al. (2011) models both single-branch and clade shifts, but the current implementation is limited to univariate analyses. The trait MEDUSA model, as implemented in the R package MOTMOT can accommodate multivariate data. To do so, it models changes in covariance among traits, where all elements of the trait covariance matrix are modified by a single scalar such that the proportionality of the matrix is constant across the tree, that is, the eigenvectors (the correlations among traits) are constant but eigenvalues are proportional. Revell and Collar (2009) modeled multivariate evo-lution by allowing each element of the trait covariance matrix to vary among lineages, which increases the generality and poten-tially the biological realism of the model. However, their model requires that the locations of shifts are defined a priori and cannot be applied to shifts that occur along single internal branches in the phylogeny.
We used the function transformPhylo.ML with the tm2 algo-rithm in the R package MOTMOT (Thomas and Freckleton 2012) to fit the trait MEDUSA model. We fitted the model to (1) body size (univariate), (2) total forelimb length (univariate), and (3)
body size+forelimb length (multivariate). We allowed up to five
possible rate shifts (although in practice the best-fitting model always contained fewer shifts) and set a minimum clade size of five, which prevents the algorithm from searching for shifts in
very small clades. To determine an appropriateAICc threshold,
a simulation was run in which BM was modeled on the phylogeny 1000 times, and the trait MEDUSA was then used to detect a sin-gle shift on these simulated data of BM. The 95th percentile of the difference between the AICc of the BM and single-shift model was then used as the AICc cut-off value (Thomas and Freckleton 2012). After simulation, this value was found to be 9.22; this means that during application of the tm2 algorithm, an
additional rate shift that improves the AICc by<9.22 compared
to a model with fewer shifts would be rejected.
An increase in evolutionary rate on a single branch constitutes either rapid change on that branch, or a parallel (directional) clade-wide shift in a trait value (Thomas and Freckleton 2012). As trait MEDUSA method cannot distinguish between these alternative evolutionary interpretations, below (ii and iii) we describe two complementary approaches to clarify these patterns.
ii. Ornstein–Uhlenbeck models
We used variants of the Ornstein–Uhlenbeck (OU) model of evolution (Hansen 1997; Butler and King 2004; Beaulieu et al. 2012) to test alternative evolutionary patterns among Paraves and Aves. We fitted alternative OU-based models using the R package OUwie (Beaulieu et al. 2012), which allows lineages to differ in
three parameters: (1)θ, often referred to as the primary adaptive
optimum; (2)α, variously referred to as the evolutionary pull
to-ward those optima, or the strength of stabilizing selection; and
(3)σ, the rate of stochastic evolution (Beaulieu et al. 2012). We
fitted seven alternative evolutionary models to the femur and fore-limb data respectively and compared model fit using AICc. We repeated the models allowing a shift in parameters among either Paraves or Aves. The models were as follows: (1) BM1, Brownian
motion model, singleσ, does not estimateαorθ; (2) BMS, two
σs, does not estimateαorθ; (3) OU1, OU model, singleθ,α, and
σ; (4) OUM, twoθs, singleαandσ; (5) OUMV, twoθs, twoσs,
singleα; (6) OUMA, twoθs, twoαs, singleσ; and (7) OUMVA,
twoθs, twoσs, twoαs. In all models, the ancestral stateθ0 was
not included, so in this model, the starting value ofθis estimated
from an OU stationary distribution.
As we noted above, OU models are often presented in the context of stabilizing selection, but some of the parameters,
particularly α, are difficult to interpret because statistical
sup-port for high α could arise from either evolution among
lin-eages toward a shared optimum or from unaccounted error in the phylogeny or the data. We avoid speculative interpretation
of α by treating it as statistical tool to account for deviation
from Brownian motion, rather than a function of evolutionary process.
iii. Directional trends
directional (model B). We compared the fit of the models using likelihood ratio tests.
iv. Relationship between body size and forelimb length
Aves and Paraves are expected to show different relation-ships between body size and forelimb compared to nonpara-vian theropods. Specifically, Dececchi and Larrson (2013) in-fer that apparent forelimb elongation in Aves arose from an allometric move to a small body size. To test for variation in the relationship of femur and forelimb between major thero-pod groups, we used the phylogenetic generalized least squares (PGLS) function in the R package caper to perform an analy-sis of covariance (ANCOVA; Orme et al. 2011). This corrects for statistical nonindependence in trait values (Felsenstein 1985; Freckleton et al. 2002) by simultaneously estimating and correct-ing for the strength of phylogenetic signal in the model residuals
using Pagel’sλ(Pagel 1997, 1999). Aλvalue of 1 indicates strong
phylogenetic signal (i.e., evolution of a trait is consistent with a constant-rate Brownian motion model), and a value of 0 indicates a lack of phylogenetic signal (deviation from Brownian motion). We fitted a series of alternative models, with interaction terms defined by major clades. Interaction terms were fitted to forelimb length and one of the discrete dummy variables to define either (i) Aves (0), other taxa (1); (ii) Paraves (0), other taxa (1); or (iii) Aves (0), other Paraves (1), other taxa (2). A statistically signif-icant interaction term would imply that the slope of the relation-ship between femur and forelimb differs among major theropod taxa.
SIMULATIONS
We used simulations to test for potential biases toward finding shifts in particular clades or branches. We note that this is not a test of the accuracy of the branch length reconstruction, but rather a test to determine whether any inferred rate shifts could be statistical artifacts. First, we simulated 1000 datasets under a constant-rate BM model on the main phylogeny pruned to 71
species, so as to match the number of species in the femur +
forelimb dataset. Data simulated under these conditions are not expected to result in identification of major rate shifts. We then fitted the trait MEDUSA model to each simulated data vector and recorded the frequency and position of identified shifts. We paid particular attention to the short branch leading to Paraves, and recorded the node position of the identified shift as the number of nodes away from the Paraves where negative numbers indicate nodes outside Paraves and positive numbers indicate nodes within Paraves. If any bias toward identifying rate shifts on the Paraves branch exists, we expect the frequency of shifts to peak at node 0. Second, we simulated data on the same tree with an increase in rates on the Paraves branch of 10, 50, 100, 500, or 1000 times the
background rate. For each magnitude of rate shift, we simulated 1000 datasets and again fitted the trait MEDUSA model, recording the frequency, location, and magnitude of shifts.
Results
RATES OF CHARACTER EVOLUTION
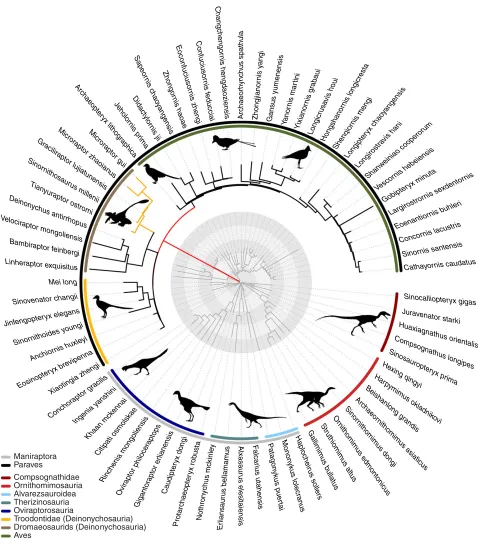
Multivariate models of body size and forelimb length The main phylogeny shows two increases in the multivariate data;
a clade increase in Microraptorinae (8.52×the background rate)
and a larger branch-based increase leading to Paraves (166.4×the
background rate; AICc= −126.36, BM model AICc= −84.02;
Fig. 1; Table 1). Indeed, the Paraves branch increase is recovered on most alternative phylogenies. One exception arises when using a phylogeny with extended branch lengths, and femur length as the body size proxy, although the increase is observed on this tree when using the SVL body size proxy (Table S5). Even on the “alt. branch” phylogeny showing no Paraves-branch increase at the AICc cutoff of 9.22, a shift is found in the Microraptorinae
(7.60×the background rate) at theAICc of 9.22, and an increase
on the Paraves branch is seen at a lowerAICc (1.8). Similarly,
using the Dececchi and Larrson (2013) dataset, a clade increase
in the dromaeosaurids (20.8×the background rate) is observed
(AICc= −48.28, BM AICc=4.45), and a branch-based increase
at the Paraves (40.92 × the background rate) is observed at a
lower AICc cut-off (6.3, Table S5).
Body size
The trait MEDUSA model identified a model with one distinct
rate shift (AICc= −16.46) on the main phylogeny, a clade
de-crease in the Ornithomimidae (0.03×the background rate). A
branch-based increase leading to Paraves (272.2 × the
back-ground rate) is seen on most phylogenies, but it is not signifi-cant at the AICc cut-off of 9.22, and is seen at a lower cut-off value (7.7 on the main phylogeny). For full information on clade composition for all traits and phylogenies, see Tables S1–S5. On the Godefroit phylogeny, a clade decrease was found in the
Troodontidae (0.024; AICc=41.88, BM AICc=50.8), and the
second branch increase leading to the Paraves (118×the
back-ground rate; AICc = 36.63). A branch-based increase on the
branch leading to Paraves was detected as the second rate shift on most trees.
Similarly, an alternative body-size proxy, SVL, shows an increase on the branch leading to Paraves across most phylo-genies (Table S4). On the main phylogeny, two increases were detected using the SVL data, a clade increase in dromaeosaurids
(5.10×the background rate), and the Paraves branch increase
(592.7×the background rate). This model had a superior AICc
si s n ei at i s el e s ur u a s a xl A i y e l x u h s i n r o i h c n A a c i h p a r g o h ti l x y r e t p o e a h c r A al u ht a p s s u h c n y hr o e a h cr A s u c it a i s a s u m i m o h ti n r o e a h c r A i g r e b n i e f r o t p a r i b m a B s i d n a r g g n o l n a h s i e B s u t a d u a c s i n r o y a h t a C i g n o d x yr et pi d u a C si s n ei z o a d g n e h si nr o g n e h c g n a h C e a k s l o m s o it a p iti C s e p i g n o l s u h t a n g o s p m o C s il i c a r g r o t p a r o h c n o C s i r t s u c a l s i n r o c n o C i ai c c u d ef si nr o s ui c uf n o C s u p o h r r i t n a s u h c y n o n i e D iij s i nr ol yt c a di D i g n e h z si nr o s ui c uf n o c o E i r e l h u b s i n r o i t n a n e o E a n n e p i v e r b x y r e t p o n i s o E s u m a m all e b s ur u a s n ail r E si s n e h at u s ui r a cl a F s ut all u b s u mi mi ll a G si s n e n e m u y s u s n a G si s n e n ail r e r ot p ar ot n a gi G a t u n i m x y r e t p i b o G s i s n e n u t a ij u l r o t p a ri li c a r G sr ell o s s ur i e h c ol p a H i v o k i n d a l k o s u m i m y p r a H i y g n i q g n i x e H at s er ci g n ol si nr o n a h s g n o H s il a t n e i r o s u h t a n g a i x a u H i n i h s n a y a i n e g n I a m ir p s in r ol o h e J s n a g e l e x y r e t p o g n e f n i
J orstarki
[image:6.612.63.541.64.604.2]t a n e v a r u J i a n n e k c m n a a h K s i n r o t n e d x e s s i n r o r t s o r i g r a L s u t i s i u q x e r o t p a r e h n i L i u o h si v as ur ci g n o L s i s n e g n a y o a h c x y r e t p i g n o L i n a h s i v a rt s o ri g n o L Mei long i u g r o t p a r o r c i M s u a i o a h z r o t p a r o r c i M s u n ar c el ol s u k y n o n o M y el ni k c m s u h c y n or ht o N s u ci n o t n o m d e s u m i m o h ti n r O s p ot p ar e c oli h p r ot p ari v O i at r e u p s u k y n o g at a P at s u b or x yr et p o e a h cr at or P si s n ei lo g n o m ai n e h c ni R si s n e g n ay o a hc s i nr o e p a S m u r o r e p o o c o a i n i e w n a h S ig n e m si n r oi q n e h S s a g i g x y r e t p o il l a c o n i S s i s n e t n a s s i n r o n i S i g n u o y s e d i o h t i n r o n i S i g n o d s u m i m o h ti n r o n i S ii n e ll i m s u r u a s o h ti n r o n i S a m i r p x y r e t p o r u a s o n i S ii g n a h c r o t a n e v o n i S s ut l a s u m i m oi ht ur t S i m o r t s o r o t p a r u y n a i T s i s n e il o g n o m r o t p a r i c o l e V s i s n e i e b e h s i n r o c s e V i g n e h z a i g n it o a i X i nit r a m si nr o n a Y i u a b ar g si nr o n ai xi Y i g n a y si nr o n aij g n o h Z e a o a h si nr o g n o h Z Maniraptora Paraves Compsognathidae Ornithomimosauria Alvarezsauroidea Therizinosauria Oviraptorosauria Troodontidae (Deinonychosauria) Dromaeosaurids (Deinonychosauria) Aves n
Figure 1. Rates of femur and forelimb evolution in Theropoda. Branch lengths are scaled, (i) red branch leading to the Paraves indicating an200-fold rate increase relative to the background rate and (ii) yellow branches to Microraptorinae indicating an approximately eightfold rate increase relative to the background rate (not scaled relative to evolutionary rate). The original time-calibrated phylogeny is shown in dark gray. Circular rings indicate 5 Ma time intervals from the KPg boundary. Silhouettes drawn by Scott Hartman, Matt Mar-tyniuk, Emily Willoughby, Jaime Headon, and Craig Dylke or modified by T. Michael Keesey were downloaded from http://phylopic.org.
the full phylogeny (“alt.branch”) that incorporated information
onEshanosaurus, a branch-based increase leading to Paraves was
not identified for femur data (Table S5). With the femur size proxy, a clade-based decrease is seen in Ornithimimidae on the
“alt.branch” phylogeny (0.029). With the SVL body size proxy, a clade-based increase is seen in dromaeosaurids (4.91), but an
increase was found at the Paraves branch (34.3×the background
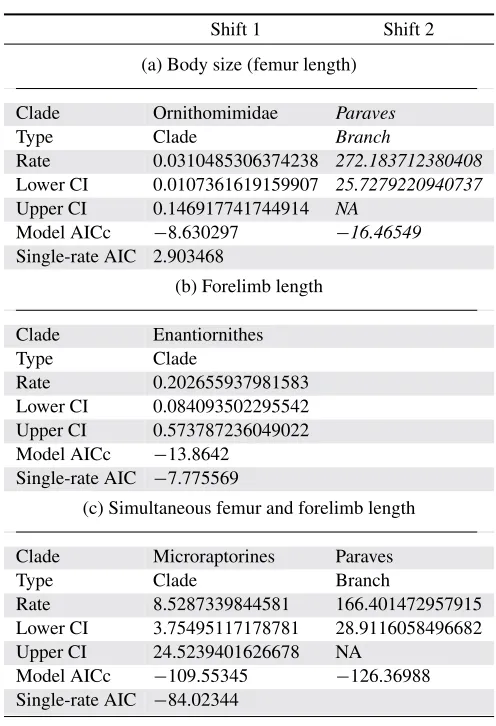
Table 1. Rates of continuous evolution in body size (a), forelimb length (b), and simultaneous analysis of body size and forelimb length (c) using trait MEDUSA.
Shift 1 Shift 2
(a) Body size (femur length)
Clade Ornithomimidae Paraves
Type Clade Branch
Rate 0.0310485306374238 272.183712380408
Lower CI 0.0107361619159907 25.7279220940737
Upper CI 0.146917741744914 NA
Model AICc −8.630297 −16.46549
Single-rate AIC 2.903468
(b) Forelimb length
Clade Enantiornithes
Type Clade
Rate 0.202655937981583
Lower CI 0.084093502295542
Upper CI 0.573787236049022
Model AICc −13.8642
Single-rate AIC −7.775569
(c) Simultaneous femur and forelimb length
Clade Microraptorines Paraves
Type Clade Branch
Rate 8.5287339844581 166.401472957915
Lower CI 3.75495117178781 28.9116058496682
Upper CI 24.5239401626678 NA
Model AICc −109.55345 −126.36988
Single-rate AIC −84.02344
The detected shifts for each analysis are shown in order of detection, along with the estimated rates, and a comparison of the multiple shift model AICc and the AICc for a single-rate model (Brownian Motion). The type refers to whether a shift is shared by all branches in a clades clade (“clade”) or a shift is found on a branch leading to that clade but is not shared by its descendants (“branch”). Results in italics show a result detected at the Paraves branch, but one that is not significant at the AICc cutoff. AIC, Akaike information criterion.
Forelimb length
Across nearly all datasets and phylogenies, no increased or de-creased rates (clade or branch-based) were found for forelimb length (Table 1). A general trend is for a clade decrease in the avian clade Enantiornithes, but this is not a consistent trend across all phylogenies and alternative branch lengths (Table S2), and is never found at the AICc cutoff of 9.22. On the main phylogeny,
a rate decrease 0.20 × the background rate in Enantiornithes
is detected (AICc = −13.8, BM model AICc= −7.7). A BM
model is favored in the phylogeny with alternative branch lengths (Table S5).
Sensitivity analysis
As a large amount of change appears to occur at the origin of the Paraves, we tested how these observations changed with different branch-scaling methods in paleotree (Bapst 2013). These tests
generally showed the change in body size+forelimb evolution is
observed more consistently at the branch leading to the Paraves (Table S6) compared to the evolution of body size alone (Table S7). No increases are found for forelimb evolution alone (Table S8).
We also tested how long the Paraves branch would have to be to reject a rate shift for simultaneous analysis of body size and forelimb length. The Paraves branch was manually altered from 0 Ma to 500 Ma in length, and the likelihood of the BM model was recorded. At 1.92 log-likelihoods from the maximum likelihood (104 Ma) the branch length is 19 Ma; we interpret that the Paraves branch would have to be greater than 19 Ma in length for the shift on this branch to be nonsignificant.
DIRECTIONAL EVOLUTION
As noted above, the trait MEDUSA algorithm cannot distinguish between rapid periods of evolution at the origin of a focal clade, and sustained periods of directional evolution among constituent lineages of the focal clade (Thomas and Freckleton 2012). Our re-sults suggest that the detected rapid branch-based increases prob-ably arise from rapid branch-specific evolution at the clade origin, as we find no evolution for directional trends in Paraves. On the main phylogeny, there is no significant difference in the likeli-hoods of the BM and Directional evolution models in Paraves
(P=0.23, df=1, chi-square statistic=1.41), and no significant
trends were found on any of the phylogenies (Table S9).
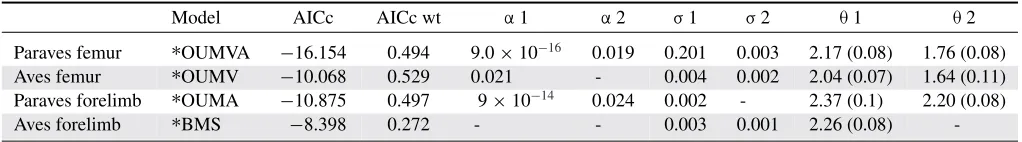
EVOLUTIONARY REGIMES IN PARAVES AND AVES Paraves, rather than Aves alone, shifted to a different evolutionary model relative to other coelurosaurian theropods (Table 2). On all trees and for both femur and forelimb size, the model with a regime shift at Paraves, rather than Aves, is favored (Table S10). We found strong support for a reduction in femur length within Par-aves (57.5 mm for ParPar-aves, 147.9 mm for other coelurosaurians) with weaker evidence for a concurrent reduction in evolutionary rates (Table 2). Importantly, the best-fitting paravian regime-shift model for femur length is substantially better than the best-fitting
avian regime shift model (AICc=6.15; Table 1). The paravian
forelimb reduced slightly in size (Paraves = 158.4 mm; other
taxa=234.4 mm; Table 2). In contrast, the equivalent model that
incorporates a reduction in rate within Aves (Table 2) is an inferior
fit (AICc=2.48).
Table 2. Adaptive regimes for femur and forelimb evolution in (i) Paraves with the rest of the tree and (ii) Aves with the rest of the tree.
Model AICc AICc wt α1 α2 σ1 σ2 θ1 θ2
Paraves femur ∗OUMVA −16.154 0.494 9.0×10⁻¹⁶ 0.019 0.201 0.003 2.17 (0.08) 1.76 (0.08)
Aves femur ∗OUMV −10.068 0.529 0.021 - 0.004 0.002 2.04 (0.07) 1.64 (0.11)
Paraves forelimb ∗OUMA −10.875 0.497 9×10⁻¹⁴ 0.024 0.002 - 2.37 (0.1) 2.20 (0.08)
Aves forelimb ∗BMS −8.398 0.272 - - 0.003 0.001 2.26 (0.08)
-Adaptive regimes are parameterized by the strength of pull (α) toward the state optima (θ), and the evolutionary rate (σ). The OUMVA models allow all parameters to differ, whereas all exceptαin the OUMV andσin the OUMA can vary. The BM model (BMS) allows onlyσto vary and does not estimateα. AIC, Akaike information criterion.
between Paraves and non-Paraves (Table S10). Models with ad-ditional evolutionary regimes (split into Aves, Paraves, and other taxa) do not improve the fit of the two-split models (Table S11).
RELATIONSHIP BETWEEN FEMUR AND FORELIMB LENGTH
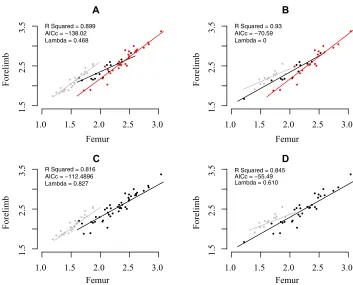
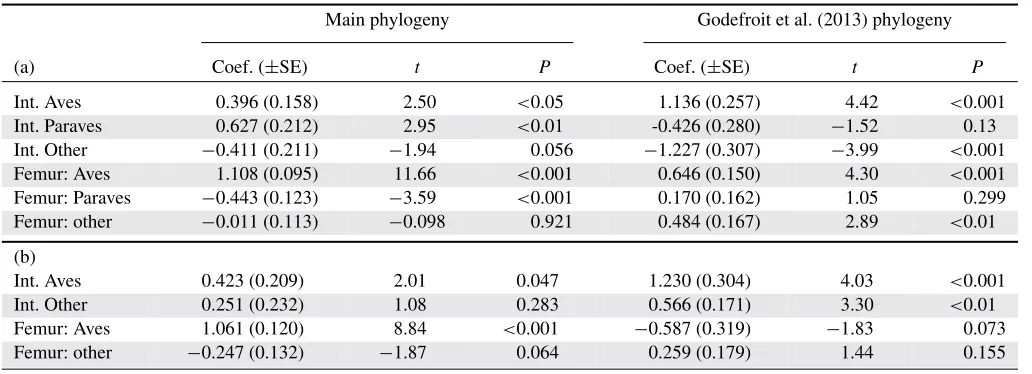
Evolutionary trajectories of femur–forelimb evolution differ among Aves, Paraves, and other coelurosaurians. The slope of the femur–forelimb relationship does not differ from unity within nonparavian coelurosaurians (Fig. 2; Table 3a). However, the slopes for Paraves and Aves depend on the tree and definition of taxa. Using the main phylogeny, at small body sizes, par-avians have larger relative forelimb lengths than nonparavian coelurosaurs, whereas at large body sizes, paravians are pre-dicted to have smaller relative forelimb lengths (Fig. 2). Within the observed data range, the majority of paravian taxa have a larger relative forelimb length than predicted from the nonpar-avian coelurosaurian regression line (Fig. 2A). However, when analyzed using the Godefroit et al. (2013) phylogeny, the rela-tionship changes; in the model with three levels, Aves have a shallower slope and do not have a reduced intercept compared to the other groups (Fig. 2D; Table 3b).
When the model is split into Aves and remaining taxa, Aves have a different relationship, with a lower intercept and steeper slope (Fig. 2C; Table 3b). Similarly, on the Godefroit et al. (2013) phylogeny, Aves have a higher intercept and a shallower slope (Fig. 2D; Table 3b). The model with three levels is a
better-fitting model (AICc= −138.02) compared to alternative models
with a split at Paraves alone (AICc= −127.06) and Aves alone
(AICc= −112.48, Table S14).
The results may be affected by the differing phylogenetic positions of certain species that move between Paraves and Aves in different phylogenies (Fig. 2; Table 3). To ensure that dif-ferences between trees were not a result of different taxon sam-pling, the main phylogeny and Godefroit phylogeny were reduced to the same set of taxa (Table S12). In the reduced main tree,
AnchiornisandXiaotingiaare classified as nonavian Paraves, but
in the Godefroit tree they are classified as Aves. Changing clas-sification of these taxa resulted in a shallower avian slope on the
Godefroit phylogeny, and a steeper slope on the main phylogeny. However, these differences are not so pronounced when using the alternative dataset (Table S13).
SIMULATIONS
As discussed above, the simulated data indicated an AICc cutoff of 9.22 was necessary for an acceptable 5% type 1 error rate. In addition to using simulations to indicate the appropriate AICc cutoff, we also used simulations to assess potential bias and power. We find no evidence of statistical bias in the position of rate shifts; in particular, there was no evidence of falsely high rates of evolution on the short branch leading to Paraves (Fig. S2). Al-though the constant-rate model is rejected for 5% of simulated datasets for the phylogeny, the percentage of branch-based in-creases at the Paraves branch was 0.2%. Indeed, there was no detectable bias toward any specific node in either the larger or smaller tree.
When high rates of evolution are simulated on the branch leading to Paraves, they are generally accurately recorded, al-though the accuracy of the rate estimation is variable (Fig. S2). A branch rate of 500 times is needed for detection in just over 50% of trees and generally the estimation of rates is a slight underestimate.
Discussion
1.0 1.5 2.0 2.5 3.0
1.5
2.5
3.5
A
Femur
Forelimb
R Squared = 0.899 AICc = −138.02 Lambda = 0.468
1.0 1.5 2.0 2.5 3.0
1.5
2.5
3.5
B
Femur
Forelimb
R Squared = 0.93 AICc = −70.59 Lambda = 0
1.0 1.5 2.0 2.5 3.0
1.5
2.5
3.5
C
Femur
Forelimb
R Squared = 0.816 AICc = −112.4896 Lambda = 0.827
1.0 1.5 2.0 2.5 3.0
1.5
2.5
3.5
D
Femur
Forelimb
[image:9.612.131.484.65.350.2]R Squared = 0.845 AICc = −55.49 Lambda = 0.610
Figure 2. The relationship between body size and forelimb length. When the phylogeny is split into three regimes (A and B), Aves (gray), Paraves (black), and other theropods (red), differences are seen between the main phylogeny in the slope for Aves and the phylogeny of Godefroit et al. (2013) in which a shallower slope for Aves is seen. These differences appear to be due to species being moved from the Aves and Paraves; Godefroit et al. (2013) placeXiaotingiaandAnchiornisin Paraves, whereas in the main phylogeny they are placed in Aves. When the phylogenies are split into two portions, Aves and non-Aves, (C and D) differences are once again seen between the trees. The main phylogeny, following conclusions from Dececchi and Larrson (2013), shows a smaller Aves intercept, indicative of an allometric change in scaling between body size and forelimb length (see Table 1). Again, differences are seen in the alternative phylogeny of Godefroit (D) where this lower Aves intercept is not found. Models that split the phylogenies into three portions (A and B) are better-fitting models (according to AICc scores) and explain more of the variance in the data (according to higher R-squared values) than models that split the phylogenies into Aves and non-Aves (C and D).
recent study (Deccechi and Larrson 2013), we find evidence for a different allometric relationship between forelimb size and body size in Aves, but this result is altered by different phylogenetic topologies, and we find little evidence for elevated rates leading to or within Aves.
WHEN DID MORPHOLOGICAL CHANGES OCCUR? We found that relative forelimb size evolves rapidly at the origin of Paraves, but that the relative elongation of the forelimb is primarily a consequence of dramatic reductions in body size, and when analyzed individually, there is no increased rate for forelimb
evolution. We also present evidence thatMicroraptorunderwent
further modifications in the relationship between forelimb length and body size, although this is found with only one of the datasets; this may highlight, nonetheless, how experimentation with flight occurred in the Paraves (Dyke et al. 2013). Miniaturization in body size has been detected on this branch before (Turner et al. 2007; Novas et al. 2012), and it is generally known that paravians
have larger forelimbs for their overall size than other theropods (Chatterjee and Templin 2004). Additionally, the lack of a trend for increasing forelimb evolution is widely recognized (Benson and Choiniere 2013; Dececchi and Larrson 2013). On the branch leading to the Paraves, a move to a smaller body size is consistent across phylogenies, but the power to detect a shift declines in cases with an extended branch leading to Paraves (Table S5) and on phylogenies constructed using alternative branch-scaling methods (Table S7). More consistent evidence is for the size-dependent shift in forelimb evolution at this point (Table S6). Elevated evolutionary rates on a branch leading to a clade, but not shared by descendants of that clade, have rarely been tested, but they may represent important macroevolutionary phenomena. For example, a recent study of mammalian body size evolution revealed high rates on branches leading to several clades (Venditti et al. 2011).
Table 3. The relationship between body size and forelimb length.
Main phylogeny Godefroit et al. (2013) phylogeny
(a) Coef. (±SE) t P Coef. (±SE) t P
Int. Aves 0.396 (0.158) 2.50 <0.05 1.136 (0.257) 4.42 <0.001
Int. Paraves 0.627 (0.212) 2.95 <0.01 -0.426 (0.280) −1.52 0.13
Int. Other −0.411 (0.211) −1.94 0.056 −1.227 (0.307) −3.99 <0.001
Femur: Aves 1.108 (0.095) 11.66 <0.001 0.646 (0.150) 4.30 <0.001
Femur: Paraves −0.443 (0.123) −3.59 <0.001 0.170 (0.162) 1.05 0.299
Femur: other −0.011 (0.113) −0.098 0.921 0.484 (0.167) 2.89 <0.01
(b)
Int. Aves 0.423 (0.209) 2.01 0.047 1.230 (0.304) 4.03 <0.001
Int. Other 0.251 (0.232) 1.08 0.283 0.566 (0.171) 3.30 <0.01
Femur: Aves 1.061 (0.120) 8.84 <0.001 −0.587 (0.319) −1.83 0.073
Femur: other −0.247 (0.132) −1.87 0.064 0.259 (0.179) 1.44 0.155
PGLS ANOVA models for the relationship between femur and forelimb length including an interaction term with three levels designating major taxa—Aves, Paraves, and remaining taxa (other, a)—and an interaction term with two levels—Aves and remaining taxa (other, b).P-values show whether parameters differ from 0 (for Aves), or from Aves (Paraves and other). Also see Figure 2.
PGLS, phylogenetic generalized least squares.
patterns. Here, we have identified a very rapid change in rate at the origin of Paraves. Previous studies using methods that can only detect clade-wide rate shifts, have inferred that the hindlimb evolved rapidly across much of Aves (Benson and Choiniere 2013). Although we note that Benson and Choiniere (2013) used PCA, other differences in their results are likely to relate to their methodology; the RJMCMC method (Eastman et al. 2011) used by Benson and Choiniere (2013) cannot detect branch-specific rate changes, whereas trait MEDUSA (Thomas and Freckleton 2012), used here, and an alternative RJMCMC method (Venditti et al. 2011) can.
Branch-based change implies either a quick change in the value of a trait or that the entire clade underwent shifts in the trait value in parallel (Thomas and Freckleton 2012); here we interpret this as a case of rapid evolution, as our subsequent anal-yses suggested no evidence for directional evolution or continued rapid change within Paraves (Table S10). Our OU models re-vealed reduced body size in Paraves coupled with low rates of evolution across the clade (Table 2). The reduction in body size is consistent with the high rate of evolution inferred by the trait MEDUSA analyses (Thomas and Freckleton 2012). Similarly, we found reductions in forelimb length among Paraves, but here not coupled with changes in rate (Table 2). Although our models support general trends toward smaller body size, this does not preclude evolution toward large size within a clade; indeed, some paravians did reach large sizes (Turner et al. 2007), and there is an increased rate of body size evolution for dromaeosaurids (Table 1).
RELATIONSHIP BETWEEN FORELIMB LENGTH AND BODY SIZE
Changes in scaling relationship between the theropods, Paraves, and Aves (Fig. 2A) suggest a different scaling relationship in the Paraves and Aves compared to the remaining theropods. There-fore, our results are in line with a different avian scaling rela-tionship between forelimb and body size (Dececchi and Larrson 2013), but also further differences in the Paraves; changes in the Paraves are also reflected in changes in the rate of evolution. If Aves have a different relationship between forelimb length and body size, an expectation may be for further changes in rates of evolution leading to Aves. However, on only one phylogeny with one specific dataset is there an increased rate for body size dependent evolution of forelimb length (Table S3), so there is scant evidence for higher rates leading to Aves. One reason for this may be that the forelimb ratios of early Aves are very similar to those of their close relatives (Middleton and Gatesy 2000), or that changes occurred over an extended time. However, methods that have analyzed discrete character evolution have found high evolutionary rates at the base of Aves and Paraves (Lloyd et al. 2012; S. Brusatte, pers. comm.).
Our best-fitting models (based on AICc scores) indicate dif-ferences in slope of the femur–forelimb relationship between three groups (Aves, Paraves, and nonparavian theropods); Aves have a shallower slope than the two other groups. However, these differences in slope are contingent on the placement of two
taxa,XiaotingiaandAnchiornis. These are normally classed as
whereas Godefroit et al. (2013) class them within Aves. Analysis
of the main tree, in whichXiaotingiaandAnchiornisare placed in
Deinonychosauria, shows that the Paraves have a shallower slope than nonparavians, suggesting that the allometric relationship be-tween forelimb and femur shifted sharply at the origin of Paraves. This appears to have been followed by a subsequent shift back to a nonparavian allometry within Aves. In contrast, based on the Godefroit et al. (2013) phylogeny, we find that the allometric slope becomes progressively shallower toward Aves (Fig. 2; Table 3). These differences between phylogenies do not appear to be depen-dent on dataset or size (Tables S12 and S13), but instead indicate that the phylogenetic placement of a few taxa can profoundly influence our understanding of the coevolutionary trajectories of traits related to flight. We note, with an alternative dataset, that the patterns are similar, although with less pronounced differences.
METHODOLOGICAL APPROACHES
Studies of morphological rates of evolution have focused mainly on single characters, but measurements of multiple traits may be important and may reflect a more accurate picture of evolution, especially in relation to body size dependent evolution. Here, we measured rates of evolution in two characters simultaneously to study changes in covariance between trait values; by testing changes in covariance it is possible to build a more detailed pic-ture of the relationships between traits in a single analysis rather than comparing rates in isolation. Alternative methods include the use of residuals from regressions (Revell 2009), Principal Com-ponents Analysis (Benson and Choiniere 2013), or ratios. One limitation of the trait MEDUSA method is that changes in rate are assumed to apply proportionally to the trait covariance matrix, whereas traits might well evolve at different rates in such a way that the trait covariance matrix could change disproportionately. The change in body size (as measured by femur or SVL length) is not matched by any change in the rate of forelimb evolution (Table 1); this suggests a change in covariance at this point. Fur-thermore, this result is more consistently found (Table S6), rather than body size evolution alone (Table S7).
Methods that use BM as a model of trait evolution, as here, assume evolution occurs as a gradual process. BM (random walk) is commonly used as a null model in comparative phylogenet-ics (Freckleton et al. 2002; O’Meara et al. 2006; Thomas et al. 2009; Venditti et al. 2011), but it is increasingly recognized that evolutionary rates (tempo) are underpinned by the evolutionary model (mode) that is used to inform them; models that use an in-correct mode of evolution can inin-correctly judge rates of evolution (Hunt 2012; Slater 2013). An issue here could be that the high branch-based rates leading to Paraves might have been caused by periods of directional selection that led to the perceived high rates (Gingerich 2001, 2009; Hunt 2012), rather than strictly elevated rates. However, tests of directional evolution among the Paraves
suggest that this explanation is unlikely. Further, BM rates are sampled from a normal distribution, so high or low rates may be difficult to detect (Landis et al. 2013). The trait MEDUSA method used here is one of a suite of models that incorporates rate changes by allowing branch lengths to vary to accommodate rate variation under BM (see also, Eastman et al. 2011; Venditti et al. 2011; Revell et al. 2012; Thomas and Freckleton 2012; Lan-dis et al. 2013). However, it has been suggested that modeling changes in the mode, rather than rate, may be more effective in understanding models of evolution (Slater 2013). A corollary to this suggestion is that localized changes in the rate of evolution can result in models of evolutionary mode being misled; for ex-ample, a small number of rate shifts toward the tips of the tree can result in falsely favoring an OU model. Although caution must be taken with the assumptions of evolutionary models (Hunt 2012; Slater 2013), a wide range of evidence suggests that evolutionary rates were indeed higher leading to Paraves.
Improvements could be made to the current analyses and methods. Although we attempted to accommodate alternative topologies and include appropriate species, we recognize that coelurosaurian phylogeny is in a state of flux. Further, as a proxy for body size, bone lengths in extinct taxa are widely used (Sookias et al. 2012), but a problem may be that lengths do not represent true body size (Campione and Evans 2012), and in particular changes in posture in Aves mean that use of the femur can be problem-atic (Dececchi and Larsson 2013). However, our findings were validated by use of an alternative measure for body size (SVL), but alternatives such as bone circumferences are also available (Campbell and Marcus 1992).
Conclusions
Chiappe 1998), the close association of different flight adapta-tions among paravians may support the notion of paravian-wide experiments in gliding flight (Dial 2003; Dyke et al. 2013).
ACKNOWLEDGMENTS
We thank Steve Brusatte and an anonymous reviewer for advice and suggestions. We also thank Chris Venditti for advice and Frances Dunn for data compilation in the Bristol Palaeontology Laboratory. All silhou-ettes in Figure 1 were downloaded from http://phylopic.org. We thank NERC for grants NE/K500823/1 to MNP, NE/G012938/1 to GHT, and NE/I027630/1 to MJB.
DATA ARCHIVING
The doi for our data is doi.org/10.6084/m9.figshare.820135.
LITERATURE CITED
Allen, V., K. T. Bates, Z. Li, and J. R. Hutchinson. 2013. Linking the evolution of body shape and locomotor biomechanics in bird-line archosaurs. Nature 497:104–107.
Bapst, D. W. 2013. Paleotree: an R package for palaeontological and phylo-genetic analyses of evolution. Methods Ecol. Evol. 3:803–807. Barrett, P. M. 2009. The affinities of the enigmatic dinosaurEshanosaurus
deguchiianusfrom the Early Jurassic of Yunnan Province, People’s Re-public of China. Palaeontology 52:681–688.
Beaulieu J. M., D.-C. Jhwueng, C. Boettiger, and B. C. O’Meara. 2012. Mod-eling stabilizing selection: expanding the Ornstein-Uhlenbeck model of adaptive evolution. Evolution 66:2369–2383.
Benson, R. B. J., and J. N. Choiniere. 2013. Rates of dinosaur limb evolution provide evidence for exceptional radiation in Mesozoic birds. Proc. R Soc. B 280:20131780.
Brusatte, S. L., M. J. Benton, M. Ruta, and G. T. Lloyd. 2008. Superiority, competition, and opportunism in the evolutionary radiation of dinosaurs. Science 321:1485–1488.
Butler, M. A., and A. A. King. 2004. Phylogenetic comparative analysis: a modeling approach for adaptive evolution. Am. Nat. 164:683–695. Campbell, K. E. Jr., and L. Marcus. 1992. The relationship of hindlimb bone
dimensions to body weight in birds. Pp. 395–412inK. E. Campbell Jr., ed. Papers in avian paleontology honoring Pierce Brodkorb. Science Series, Vol. 36. Natural History Museum of Los Angeles County, Los Angeles, CA.
Campione, N. E., and D. C. Evans. 2012. A universal scaling relationship between body mass and proximal limb bone dimensions in quadrupedal terrestrial tetrapods. BMC Biol. 10:60.
Carrano, M. T. 2006. Body size evolution in the Dinosauria. Pp. 225–268in
M. T. Carrano, T. J. Gaudin, R. W. Blob, and J. R. Wible, eds. Amniote palaeobiology: perspectives on the evolution of mammals, birds and reptiles. Univ. of Chicago Press, Chicago.
Carrano M. T., R. B. J. Benson, and S. D. Sampson. 2012. The phylogeny of Tetanurae Dinosauria: Theropoda. J. Syst. Palaeont. 102:211–300. Carrano, M. T., J. Alroy, M. D. Uhen, and A. K. Behrensmeyer. 2013.
Taxo-nomic occurrences of Theropoda recorded in the paleobiology database. Fossilworks. Available at http://fossilworks.org.
Chatterjee, S., and R. J. Templin. 2004. Feathered coelurosaurs from China: new light on the arboreal origin of avian flight.InP. J. Currie, E. B. Koppelhus, and M. A. Wright, eds. Feathered dragons: studies on the transition from dinosaurs to birds. Indiana Univ. Press, Bloomington, IN.
Clarke, A. J., and K. M. Middleton. 2008. Mosaicism, modules, and the evo-lution of birds: results from a bayesian approach to the study of morpho-logical evolution using discrete character data. Syst. Biol. 57:185–201. Dececchi, T. A., and H. C. E. Larsson. 2009. Patristic evolutionary rates
suggest a punctuated pattern in forelimb evolution before and after the origin of birds. Paleobiology 35:1–12.
———. 2013. Body and limb size disassociation at the origin of the birds: uncoupling allometric constraints across a macroevolutionary transition. Evolution 67:2741–2752.
Dial, K. P. 2003. Wing-assisted incline running and the evolution of flight. Science 299:402–404.
Dyke, G., R. de Kat, C. Palmer, J. van der Kindere, D. Naish, and B. Gana-pathisubramani. 2013. Aerodynamic performance of the feathered di-nosaurMicroraptorand the evolution of feathered flight. Nat. Commun. 4:2489.
Eastman, J. M., M. E. Alfaro, P. Joyce, A. L. Hipp, and L. J. Harmon. 2011. A novel comparative method for identifying shifts in the rate of character evolution on trees. Evolution 65:3578–3589.
Felsenstein, J. 1985. Phylogenies and the comparative method. Am. Nat. 125:1–15.
Freckleton, R. P., P. H. Harvey, and M. Pagel. 2002. Phylogenetic analysis and comparative data: a test and review of evidence. Am. Nat. 160: 712–726.
Gatesy, S. M. 1990. Caudofemoral musculature and the evolution of theropod locomotion. Paleobiology 16:170–186.
Gatesy, S. M., and K. P. Dial. 1996. Locomotor modules and the evolution of avian flight. Evolution 50:331–340.
Gingerich, P. D. 2001. Rates of evolution on the time scale of the evolutionary process. Genetica 112:127–144.
———. 2009. Rates of evolution. Annu. Rev. Ecol. Evol. Syst. 40:657– 675.
Godefroit, P., A. Cau, D.-Y. Hu, F. Escuilli´e, W. H. Wu, and G. J. Dyke. 2013. A Jurassic avialan dinosaur from China resolves the phylogenetic history of birds. Nature 498:359–362.
Gong, E.-P., L. D. Martin, D. A. Burnham, A. R. Falk, and L.-H. Hou. 2012. A new species ofMicroraptorfrom the Jehol Biota of northeastern China. Palaeoworld 21:81–91
Hansen, T. F. 1997. Stabilizing selection and the comparative analysis of adaptation. Evolution 51:1341–1351.
Harmon, L. J., J. B. Losos, J. T. Davies, R. G. Gillespie, J. L. Gittleman, W. B. Jennings, K. H. Kozak, M. A. McPeek, F. Moreno-Roark, T. J. Near, et al. 2010. Early bursts of body size and shape evolution are rare in comparative data. Evolution 64:2385–2396.
Hu, D., L. Hou, L. Zhang, and X. Xu. 2009. A pre-Archaeopteryx troodon-tid theropod from China with long feathers on the metatarsus. Nature 461:640–643.
Hunt, G. 2007. The relative importance of directional change, random walks, and stasis in the evolution of fossil lineages. Proc. Natl. Acad. Sci. USA 104:18404–18408.
———. 2012. Measuring rates of phenotypic evolution and the inseparability of tempo and mode. Paleobiology 38:351–373.
Hutchinson, J. R., and V. Allen. 2009. The evolutionary continuum of limb function from early theropods to birds. Naturwissenschaften 96:423– 448.
Landis, M. J., J. G. Schraiber, and M. Liang. 2013. Phylogenetic analysis using L´evy processes: finding jumps in the evolution of continuous traits. Syst. Biol. 62:193–204.
Lee M. S. Y., and T. H. Worthy. 2012. Likelihood reinstatesArchaeopteryxas a primitive bird. Biol. Lett. 8:299–303.
in the evolution of lungfish (Sarcopterygii; Dipnoi). Evolution 66: 330–348.
Middleton, K. M., and S. M. Gatesy. 2000. Theropod forelimb design and evolution. Zool. J. Linn. Soc. 128:149–187.
Nesbitt, S. J., A. H. Turner, M. Spaulding, J. L. Conrad, and M. A. Norell. 2009. The theropod furcula. J. Morphol. 270:856–879.
Novas, F. E., M. D. Ezcurra, F. L. Agnolin, D. Pol, and R. Ort´ız. 2012. New Patagonian Cretaceous theropod sheds light about the early radiation of Coelurosauria. Rev. Mus. Argent. Cienc. Nat. 14:57–81.
Nudds, R. L., and G. J. Dyke. 2010. Narrow primary feather rachises in
ConfuciusornisandArchaeopteryxsuggest poor flight ability. Science 328:887–889.
O’Connor, J. K., and Z. Zhou. 2013. A redescription ofChaoyangia beis-hanensis(Aves) and a comprehensive phylogeny of Mesozoic birds. J. Syst. Palaeont. 11:889–906.
O’Meara, B. C., C. An´e, M. J. Sanderson, and P. C. Wainwright. 2006. Test-ing for different rates of continuous trait evolution usTest-ing likelihood. Evolution 60:922–933.
Orme, C. D. L., R. P. Freckleton, G. H. Thomas, T. Petzoldt, and S. A. Fritz. 2011. Caper: comparative analyses of phylogenetics and evolution in R. Available at http://R-Forge.R-project.org/projects/caper/.
Padian, K., and L. M. Chiappe. 1998. The origin and early evolution of birds. Biol. Rev. 73:1–42.
Pagel, M. 1997. Inferring evolutionary processes from phylogenies. Zool. Scripta 26:331–348.
———. 1999. Inferring the historical patterns of biological evolution. Nature 401:877–884.
Pagel, M., and A. Meade. 2013. BayesTraits, version 2. Univ. of Reading, Berkshire, U.K. Available at http://www.evolution.rdg.ac.uk.
Revell, L. J. 2009. Size-correction and principal components for interspecific comparative studies. Evolution 63:3258–3268.
Revell, L. J., and D. C. Collar. 2009. Phylogenetic analysis of the evolutionary correlation using likelihood. Evolution 63:1090–1100.
Revell, L. J., D. L. Mahler, P. R. Peres-Neto, and B. D. Redelings. 2012. A new method for identifying exceptional phenotypic diversification. Evolution 66:135–146.
Slater, G. J. 2013. Phylogenetic evidence for a shift in the mode of mammalian body size evolution at the Cretaceous-Palaeogene boundary. Methods Ecol. Evol. 4:734–744.
Sookias, R. B., R. J. Butler, and R. B. J. Benson. 2012. Rise of dinosaurs reveals major body-size transitions are driven by passive processes of trait evolution. Proc. R Soc. B 279:2180–2187.
Sullivan C., D. W. E. Hone, X. Xu, and F. Zhang. 2010. The asymmetry of the carpal joint and the evolution of wing folding in maniraptoran theropod dinosaurs. Proc. R Soc. B 277:2027–2033.
Thomas, G. H., and R. P. Freckleton. 2012. MOTMOT: models of trait macroevolution on trees. Methods Ecol. Evol. 3:145–151.
Thomas, G. H., S. Meiri, and A. B. Phillimore. 2009. Body size diversification inAnolis: novel environment and island effects. Evolution 63:2017– 2030.
Turner, A. H., D. Pol, J. A. Clarke, G. M. Erickson, and M. A. Norell. 2007. A basal dromaeosaurid and size evolution preceding avian flight. Science 317:1378–1381.
Turner, A. H., P. J. Makovicky, and M. A. Norell. 2012. A review of dro-maeosaurid systematics and paravian phylogeny. Bull. Am. Mus. Nat. Hist. 371:1–206.
Venditti, C., A. Meade, and M. Pagel. 2011. Multiple routes to mammalian diversity. Nature 479:393–396.
Xing, L., W. S. Persons, IV, P. R. Bell, X. Xu, J. Zhang, T. Miyashita, F. Wang, and P. J. Currie. 2013. Piscivory in the feathered dinosaurMicroraptor. Evolution 67:2441–2445.
Xu, X., Z. Zhou, X. Wang, X. Kuang, F. Zhang, and X. Du. 2003. Four-winged dinosaurs from China. Nature 421:335–340.
Xu, X., H. You, K. Du, and F. Han. 2011. An Archaeopteryx-like theropod from China and the origin of Avialae. Nature 475: 465–470.
Zanno, L. E. 2010. A taxonomic and phylogenetic re-evaluation of Ther-izinosauria (Dinosauria: Maniraptora). J. Syst. Palaeontol. 8:503– 543.
Zanno, L. E., and P. J. Makovicky. 2013. No evidence for directional evolu-tion of body mass in herbivorous theropod dinosaurs. Proc. R Soc. B. 280:20122526.
Zhang, F.-C., Z.-H. Zhou, X. Xu, and X.-L. Wang. 2002. A juvenile coelurosaurian theropod from China indicates arboreal habits. Natur-wissenschaften 89:394–398.
Zheng, X., Z. Zhou, X. Wang, F. Zhang, X. Zhang, Y. Wang, G. Wei, S. Wang, and X. Xu. 2013. Hind wings in basal birds and the evolution of leg feathers. Science 339:1309–1312.
Zhou, Z., and F. Z. Z. Li. 2010. A new Lower Cretaceous bird from China and tooth reduction in early avian evolution. Proc. R Soc. B 277:219– 227.
Associate Editor: P. David Polly
Supporting Information
[image:13.612.56.562.57.588.2]Additional Supporting Information may be found in the online version of this article at the publisher’s website:
[image:13.612.301.561.78.522.2]Figure S1.Phylogenetic trees used for analysis.
Figure S2.Simulations validate the performance of the trait MEDUSA (tm2 algorithm) method.
Table S1.Trait MEDUSA (tm2 algorithm) for femur length (body size) across all phylogenies.
Table S2.Trait MEDUSA (tm2 algorithm) for rates of forelimb length evolution across all phylogenies.
Table S3.Trait MEDUSA (tm2 algorithm) for rates of body size (femur length) and forelimb length evolution (measured simultaneously) across all phylogenies.
Table S4.Trait MEDUSA (tm2 algorithm) for rates of body size, forelimb length, and simultaneous body size and forelimb length evolution using alternative data (Dececchi and Larrson 2013).
Table S5.Trait MEDUSA (tm2 algorithm) for rates of body size, forelimb length, and simultaneous body size and forelimb length evolution using a phylogeny with alternative branch lengths to the main phylogeny.
Table S6.Results from trait MEDUSA of simultaneous femur and forelimb evolution using different branch-scaling methods from the R packages paleotree.
Table S8. Results from the trait Medusa measure of forelimb evolution using different branch-scaling methods from the R packages paleotree.
Table S9.Tests of directional evolution performed on pruned phylogenies representing Paraves and Aves extracted from different phylogenies.
Table S10.Results from the OUwie models (BM1, BMS, OU1, OUM, OUMV, OUMA, OUMVA) across phylogenies indicating changes in the optimum between the “theropods” on the tree, and either the Aves or the Paraves.
Table S11.A model of a split in the Aves, Paraves, and other for various OUwie models (BMS, OU1, OUM, OUMV, OUMA, OUMVA) for body size (femur length) and forelimb length).
Table S12.PGLS models to clarify that differences between the main phylogeny and Godefroit et al. (2013) phylogeny are not due to sample size (a), and a lot of the differences can be explained by reclassification of just two taxa (AnchiornisandXiaotingia) when phylogenies are reduced to the same size (b).
Table S13.Use of alternative data sources for body size and forelimb length (Dececchi and Larrson 2013).