An Evaluation of Competing
Risks in Studies of Perinatal
Mortality and Birth Defects
The Harvard community has made this
article openly available.
Please share
how
this access benefits you. Your story matters
Citable link http://nrs.harvard.edu/urn-3:HUL.InstRepos:37945561
Terms of Use This article was downloaded from Harvard University’s DASH
repository, and is made available under the terms and conditions applicable to Other Posted Material, as set forth at http://
AN EVALUATION OF COMPETING RISKS IN STUDIES OF
PERINATAL MORTALITY AND BIRTH DEFECTS
DOMINIQUE HEINKE
A Dissertation Submitted to the Faculty of
The Harvard T.H. Chan School of Public Health
in Partial Fulfillment of the Requirements
for the Degree of Doctor of Science
in the Department of Epidemiology
Harvard University
Boston, Massachusetts.
Dissertation Advisor: Dr. Janet Rich-Edwards Dominique Heinke
AN EVALUATION OF COMPETING RISKS IN STUDIES OF PERINATAL MORTALITY AND BIRTH DEFECTS
ABSTRACT
Table of Contents
Abstract ... ii
List of Figures with Captions ... v
List of Supplemental Figures with Captions ... v
List of Tables with Captions... vi
List of Supplemental Tables with Captions ... vi
Acknowledgments ... ix
Introduction ... 1
Chapter 1. Timing and Etiology of Neonatal Deaths and Stillbirths: A Study of United States Births in 2014 ... 5
Chapter 2. Risk of stillbirth among fetuses with non-syndromic major birth defects: a population-based study incorporating estimates of the impact of competing events ... 27
Chapter 3. Evaluation of selection bias in studies of risk factors for birth defects among live births: evidence from the National Birth Defects Prevention Study ... 52
Conclusions ... 76
List of Figures with Captions
Figure 1.1. Rate of perinatal outcome overall and by multiple pregnancy or delivery method, 2014 United States resident births ... 11 Figure 1.2. Daily mortality rate within the first week of life by category of gestational age at delivery, United States 2014 ... 12 Figure 1.3. Gestational age-specific rate of perinatal outcome, 2014 United States resident births... 15 Figure 1.4. Cause-specific mortality rate of perinatal outcomeby age at perinatal death, 2014 United States resident birthswith a specified cause of death ... 16 Figure 2.1. Construction of the study cohort. ... 33 Figure 2.2. Observed and unobserved pregnancy outcomes among birth defect cases and their relation to calculated risk estimates ... 34 Figure 2.4. Observed and minimum and maximum termination-corrected stillbirth risk per 100 non-syndromic birth defect cases by birth defect pattern and highest severity. ... 38 Figure 2.5. Observed risk of combined mortality (termination, stillbirth, or first day neonatal death) per 100 non-syndromic birth defect cases. ... 40 Figure 3.1. Directed Acyclic Graph of Hypothetical Selection Bias in Studies of Birth Defects. ... 55 Figure 3.2. Percentage of cases with first trimester exposure to antiepileptic drugs or smoking, part of a multiple gestation pregnancy, or with isolated birth defects by birth defect and pregnancy outcome... 63 Figure 3.3. Results of adjusted logistic regression models of the relationship of selected birth defects and first trimester maternal AED use, smoking, or multiple gestation pregnancy among live births, live births and stillbirths, and all outcomes. ... 64
List of Supplemental Figures with Captions
List of Tables with Captions
Table 1.1. Rate of perinatal outcome by maternal, infant, and delivery characteristics, 2014 United States resident births ... 14 Table 2.1. Severity categorization of birth defects ... 32 Table 3.1. Risk of live birth, stillbirth, and termination for each birth defect ... 62
List of Supplemental Tables with Captions
Supplemental Table 1.1 ICD-10 codes used to create underlying cause of death categories. ... 23 Supplemental Table 1.2. Daily mortality rate per 10,000 live birth survivors within the first week of life by gestational age at delivery, 2014 US resident births ... 24 Supplemental Table 1.3. Proportion of cause of death among stillbirths and neonatal deaths by age at death, and all perinatal deaths combined, among infants with a specified cause of deatha, 2014 US resident births ... 25
Supplemental Table 1.4 Number and ratea of detailed cause of death by age at perinatal death, 2014 US resident
birthsb ... 26
Supplemental Table 3.4. Results of main and sensitivity analyses of adjusted logistic regression models of the relationship of selected birth defects and a first trimester smoking among live births, live births and stillbirths, and all outcomes. ... 72 Supplemental Table 3.5. Results of main and sensitivity analyses of adjusted mixed effect regression models of the relationship of selected birth defects and multiple gestation pregnancy among live births, live births and stillbirths, and all outcomes. ... 73 Supplemental Table 3.6 Results of main and sensitivity analyses of adjusted mixed effect regression models of the relationship of selected birth defects and first trimester exposure to antiepileptic drugs among live births, live births and stillbirths, and all outcomes. ... 74 Supplemental Table 3.7 Results of main and sensitivity analyses of adjusted mixed effect regression models of the relationship of selected birth defects and first trimester maternal smoking among live births, live births and
DEDICATED TO THE MEMORY OF KYLE R. GEISER AND TO MARGARET, RICHARD, AND CARLIE GEISER
FOR INSPIRING ME TO WORK TO PROVIDE ANSWERS
Acknowledgments
The completion of this dissertation is possible only through the tremendous support I have received, not only during my time as a doctoral student, but throughout my life.
First, I must thank my dissertation advisor Dr. Janet Rich-Edwards for not only encouraging me to peruse a doctorate in epidemiology at Harvard, but for also supporting me during my journey. Janet, your patience and guidance made it possible for me to learn to be an effective student and researcher, as well as one with the confidence to propose unconventional studies in little explored areas. Further, without your incredible support and encouragement while I learned to live with a chronic illness, this dissertation would have never happened. Thank you.
To my dissertation committee members, Dr. Sonia Hernandez-Diaz and Dr. Paige L Williams, thank you for generously sharing your expertise and pushing me to do the best work possible. Both of you have provided
incredibly insightful feedback and asked me to grapple with difficult methodological questions and defend my ideas and work. The quality of this dissertation is a testament to the high bar you set for your students and your support in helping them reach it. It has been an honor and a joy to learn from you both. And to all of my committee
members, thank you for your willingness to dive into areas outside your usual expertise; without it, this dissertation would not have been possible.
To my mentors at the Center for Birth Defects Research and Prevention at the Massachusetts Department of Public Health, Dr. Marlene Anderka and Dr. Mahsa Yazdy, the opportunities and experience you have provided me through my internship at the center have allowed me to flourish as an epidemiologist. Marlene, thank you for bringing me into this wonderful center full of passionate and dedicated public servants and trusting me to uphold the standard of excellence that you set. Your faith in me to learn two completely new fields, and your mentorship during the process, were fundamental to the development of this dissertation. I also must thank you for allowing me to take your original idea for a study on selection bias in birth defects and build it into my own project – I hope that I have done you proud. Mahsa, your mentorship has helped me to mature as a researcher and gain the skills and confidence to take on a bigger role at the center and in the field. Thank you for your continual support and confidence in me.
To my colleagues at the MA CBDRP, thank you for welcoming me into the center and helping me learn. Without your patient teaching, support, snacks, and laughter I would not have gained the wealth of knowledge about birth defects and birth defects surveillance and research needed to do this work. Additional thanks to Rebecca Liberman and Dr. Nick Sommerville for feedback on Chapter 1. To my coauthors and collaborators, with a particular thanks to Drs. Allen Mitchell, Wendy Nembhard, Ruth Fretts, Angela Lin, and to Carla Van Bennekom, thank you for your thoughts and guidance in the design, execution, interpretation, and communication of this work. You helped me take what were often raw ideas and polish them into gems of papers. To the participants of the National Birth Defects Prevention Study, thank you for generously sharing part of your lives so that others may benefit.
Support from two training grants were especially helpful during my time as a doctoral student. Thank you to Dr. Karin Michaels for the support of the T32 Training Grant (T32HD060454) in Reproductive, Perinatal and Pediatric Epidemiology from the National Institute of Child Health and Human Development, National Institutes of Health, and Dr. Marie McCormick for the support of the Maternal and Child Health Epidemiology Training Grant
To my friends and colleagues at HSPH, thank you for letting me learn and grow with you and for all of the laughs, tears, coffee, and wine we have shared along the way. I have developed wonderful friendships with some of the most incredible people during my time here which made getting through this difficult process not only possible, but much more enjoyable.
A big thanks is owed to my undergraduate advisors at Northwestern University. To Dr. Chris Kuzawa, thank you for taking me under your wing and introducing me to the joys of academic research. I am grateful for your patient tutoring and encouragement to pursue epidemiology. To Dr. Mark Sheldon, there is no way to fully express how thankful I am for your incredible support through some of the most difficult years of my life, without which I could not have made it to where I am today. I am forever grateful for everything you did to make it possible for me to stay and be successful at Northwestern and for your continuing support.
Finally, to my friends and family, thank you for your never-ending support and encouragement.
To my very first friend and sister, Natalia, thank you for always being there for me no matter what. You have taught me the meaning of true friendship and have helped me find the strength to get through incredibly difficult times. To my other sisters, Ingrid and Mandy, thank you both for always believing in me, often more than I believed in myself. You have all kept me sane, grounded, and laughing throughout my life. To my aunts, uncles, and cousins, I am grateful for your never-ending support and encouragement, gracias por todo. Thank you to my “unnatural parents” Hank and Ruthanne for going above and beyond to support me during my journey through college. Without the time away with you at your home I couldn’t have made it here today. To my grandmother, Ruth Hepler, thank you for not only your care and support, but also for showing me how a smart independent woman can make her own path in a world dominated by men. You inspire and amaze me.
I am grateful for my friends and family members who have shared their experiences of children affected by birth defects, including the loss of those children, with me. Your stories inspired me to dedicate myself to birth defects and perinatal mortality; I hold your stories with me as I work.
To my parents, there are not words to describe my gratitude for all the sacrifices you have made to give me the opportunity to pursue this dream and support me on my journey. Your emotional and financial support has been beyond generous and have allowed me to make it to this day. Thank you for believing in a six-year-old pig-tailed red-head who declared she wanted to be a doctor and helping here make her dream come true.
And to my partner Joe, thank you for joining me on this journey and for being my biggest cheerleader. You have supported me in so many ways, cooking me dinners, checking my code, reading my papers, talking me off many a cliff, and most importantly making me set my dissertation down and take a break. Thank you for caring for me, believing in me, and reminding me to believe in myself. I love you.
"There is no heartbeat." With those four words everything stopped.
Introduction
For around four million families around the world each year, the hope and anticipation of
expecting a child is shattered by death of their baby soon before or after birth, collectively
called perinatal deaths. 1,2 These deaths carry significant emotional burdens and morbidity for
families, who often feel isolated in their grief.3 Beyond the individual burden of perinatal
deaths, rates of these deaths act as sensitive markers of health system performance and
combined represent significant sources of financial burdens to families, health systems, and
society.4 Despite the massive burden of perinatal deaths, governments and organizations at the
global, national, and local levels have invested little in their investigation and prevention; for
example, although perinatal deaths occur more than 10 times more frequently than sudden
infant death syndrome (SIDS), research and public attention are notably less. 1,5,6 Thus, little is
known about the causes of most perinatal deaths and progress in preventing such deaths has
stalled.
Perinatal deaths are defined as the combination of stillbirths and neonatal deaths. Stillbirth, the
death of a viable fetus in utero, is defined in most of the United States (US) as the death of a
fetus of 20 weeks or more gestational age (or a weight at birth of 350g or more) before birth;
approximately 23,000 US pregnancies end in stillbirth each year. 6 Although the rate of stillbirth
in the US declined 8% from 2000 to 2006 (6.6 to 6.1 per 1,000 live births and fetal deaths)
progress in preventing stillbirth has slowed, with no change in the rate of stillbirth from 2006 to
2012. 7 Infant deaths, defined as deaths within the first year of life, are divided into the
days of life). Neonatal deaths are further subdivided into early neonatal deaths (<7 days of life)
and late neonatal deaths (7 – 27 days of life). 8 Approximately 23,000 live born infants die
before their first birthday in the US each year, of which over 15,000 die within a month of
birth.5 After a dramatic decline during the previous century, infant deaths plateaued in the
early 2000s but have since begun to decrease, with data from 2014 showing a rate of 5.84
infant deaths per 1,000 live births. 9,10
The risk of perinatal death is markedly increased by malformations that develop early in
pregnancy that often impair fetal viability. 11,12 Birth defects are any abnormality of the
structure or function of the body that originate during gestation; major defects are those with
significant functional or cosmetic consequences. In the United States, major structural defects
affect approximately three pregnancies for every 100 live births, thus approximately 90,000
cases are identified every year.13 Major birth defects are identified among 20% of infant deaths
and 15% to 20% of stillbirths, making them the leading cause of perinatal deaths. 5,14 For
survivors and their families, birth defects often result in substantial medical and emotional
burdens as well as important physical and/or intellectual disabilities. 15-17 Although some causes
of major birth defects have been identified, the cause of 80% of cases remains unknown. 18
Efforts to identify modifiable risk factors for birth defects, stillbirth, and neonatal death are
complicated by the interconnected nature of perinatal outcomes, which act as competing risks
that may bias results under certain circumstances. Competing events are those where the
the probability of the occurrence of the competing event. 19 For example, in the context of
perinatal mortality, stillbirth is a competing event for live birth and thus neonatal death, as
fetuses who die in utero cannot also be live born and subsequently die after birth. In addition to
naturally occurring events, medical interventions can act as competing risks in two primary
ways: first, termination of pregnancy is a competing event for both stillbirth and live
birth/neonatal death; second, medical initiated delivery of a fetus may compete with stillbirth
by inducing a live birth. Although medical delivery may be appropriate management which
reduces mortality in other cases it may simply “bring birth to the time of death” if the
intervention simply changes the outcome category (e.g., moving a stillbirth to a live birth with a
subsequent neonatal death) but not mortality. 20,21 Inconsistent categorization of deaths near
the time of delivery as stillbirths or neonatal deaths adds further complication to this issue. 22,23
Competing risks may bias studies of birth defects and perinatal mortality through several
different mechanisms: first, by excluding cases with the outcome of interest from those which
are observed; second, by removing the highest risk fetuses from the pool at risk (“depletion of
succeptibles”); third, by inducing selection bias; and fourth, by shifting to use of etiologically
heterogeneous categories in order to compensate for known competing risks. 24-28 As an
example of the first and second mechanisms, termination of pregnancy for birth defects
competes with stillbirth and live birth for fetuses with birth defects. 29 If birth defect cases are
identified only among stillbirths and live births, the number of birth defect cases will be
underestimated (mechanism 1), and since termination is generally chosen for the most severe
stillbirths will underestimate the “true” risk of mortality since the highest risk cases were
removed from the population of fetuses at risk (mechanism 2). 27,30-34 Further, if the choice to
terminate a fetus with a severe defect is affected by an exposure of interest and this
relationship is analyzed only among live born infants, then selection bias may result
(mechanism 3). 35 Finally, analyses combining multiple competing events into a single category,
such as perinatal mortality, may combine outcomes with different primary causes, leading to
unpredictable biases if an exposure is associated with one event (e.g., stillbirth) but not the
other (e.g., neonatal death; mechanism 4). 25
While these mechanisms have been previously noted by researchers, few studies have
evaluated the impact of competing risks in perinatal mortality and birth defects epidemiology.
Therefore, we sought to examine the occurrence and impact of competing risks in perinatal and
birth defects epidemiology in the following three chapters:
Chapter 1. Timing and Etiology of Neonatal Death and Stillbirth: A study of 2014 United States Births
Chapter 2.Risk of stillbirth among fetuses with non-syndromic major birth defects: A population-based study accounting for the influence of competing events
Chapter 3. Evaluation of selection bias in risk factor studies of birth defects: Evidence from the National Birth Defects Prevention Study
Understanding the potential for these biases, the magnitude and direction of any resulting bias,
the conditions under which these biases are likely to occur, and methods to minimize bias are
critical to advancing our understanding of risk factors and thus measures that can be taken to
Chapter 1. Timing and etiology of neonatal deaths and stillbirths: a study of united states births in 2014
Abstract
Perinatal death and it’s components, stillbirths and neonatal deaths, are important health
outcomes. However, there is debate among researchers whether stillbirths and neonatal
deaths are similar enough to be combined or should be examined separately. To better
understand similarities and differences between these outcomes, we sought to compare
mortality rates, risk factors, and cause of death for stillbirths and neonatal deaths by age at
death within the United States (US). We evaluated US resident births in 2014 using fetal death
and linked birth-infant death certificate data. Perinatal deaths were categorized as stillbirth,
first-day (0 - 23 hours), first-week (days 1-6) and first-month (days 7– 27). We examined
maternal, infant, and delivery characteristics, gestational timing, and cause of death by age at
perinatal death categories. Day-by-day mortality was calculated for neonatal deaths overall and
by gestational age at birth. The 38,522 perinatal deaths in 2014 included 60% stillbirths
(n=22,994), 23% first-day (n=8,746), 8% first-week (n=2,912) and 8% first-month deaths
(n=2,955). 60% of neonatal deaths occurred on the first day. Ninety-three percent of stillbirths
and 84% of first-day deaths were attributed to pregnancy complications, disorders of fetal
growth, and birth defects versus 42% of first-week, 32% of first-month deaths and 45% of all
perinatal deaths combined. We found that most neonatal deaths occurred on the first day,
regardless of gestation, and that their major causes of death were more similar to stillbirths
than later neonatal deaths or perinatal deaths overall. Consequently, we suggest that first-day
mortality be reported and analyzed separately from later neonatal deaths and that use of the
Introduction
Each year nearly 5 million infants are stillborn or die within a month of birth, yet few global or
national research and policy initiatives target prevention of these deaths.1,37 Recent calls to
action have advocated for improved monitoring and research into the causes and risk factors
for stillbirth and neonatal deaths. 1,2,37 Beyond acting as epidemiological outcomes, stillbirth
and neonatal mortality rates are sensitive markers of health care system performance.2
However, inconsistency in the reporting and occurrence of stillbirth versus very early infant
deaths, which act as competing risks, impairs the ability to identify risk factors on both the
individual and systematic level across the development spectrum. 2,38-42
The time around delivery is one of peak mortality; thus, small shifts in categorization of deaths
to one category or the other can lead to large differences in the rates of stillbirth and neonatal
death, making meaningful comparisons across locations or over time periods challenging.
38,40,41,43,44 To address these issues, a focus on the composite metric of perinatal death (all
stillbirths and neonatal deaths in the first week or first month of life combined) has been
suggested. 40,41,45 By capturing all deaths before and after delivery, this measure avoids the
inconsistency and possible bias of evaluating either stillbirth or neonatal death alone. However,
to the extent that neonatal deaths and stillbirths differ in risk factors and etiology, the
combined category of perinatal death may provide little utility as an epidemiologic or system
Cause of death is known to change with age within in the neonatal period, and the rapid shifts
in mortality risk during the first week of life suggest that there may be rapid changes in the
main causes of death during this period.2,44,47 Previous studies have found that the primary
causes of neonatal death in the first week differ from those after the first week. 2,47,48 The risk
of mortality within a day of birth is substantially higher than any other postnatal day, but only
several small studies in low and middle-income countries have evaluated cause of death for
first day deaths separately from later neonatal deaths.2,44,49 These studies found different
primary causes of death on the first day than later deaths; to our knowledge, this has not been
evaluated in high-income countries. 48,50,51 If the etiology of first-day deaths substantially differs
from later neonatal deaths regardless of country income level, the use of the composite
perinatal death outcome may need to be reconsidered as it would not meaningfully reflect the
etiology of any perinatal deaths.
To investigate the prevalence, etiology, and characteristics of first day death and to help clarify
the appropriateness of current definitions of perinatal mortality we sought to examine the
relationship of age at death to neonatal mortality rates by maternal, pregnancy, and infant
characteristics as well as cause-specific mortality and compare them to stillbirths overall and by
gestational age in a recent cohort ofbirths in the United States (US).
Methods
Data source
We used the Centers for Disease Control and Prevention (CDC) National Center for Health
retrospective cohort of all births to US resident mothers in the 50 states and District of
Columbia in 2014. Underlying cause of death was obtained from all infant death certificates and
from fetal death certificates in states using the 2003 revision of the fetal death certificate and
coded using the International Classification of Diseases, Tenth Revision (ICD-10). States using
the revised fetal death certificate cover approximately 90% of stillbirths in the US.52 Cause of
death categories based on ICD-Perinatal Mortality (PM) categories are described and
summarized in the supplemental materials and Supplemental Table 1.1.53
Data Analysis
We included all live births and stillbirths with a plausible gestational age at delivery of at least
20 weeks or, if gestational age was unknown, with a birth weight over 350 g.54 To avoid a
downward bias in gestational age-specific mortality estimates, we followed a published
algorithm to identify implausible gestational age estimates and to select a plausible gestational
age estimate when available.55,56 Detailed methods and results of the cleaning and the
imputation of missing or invalid gestational age are described in the supplemental materials.
Exclusions based on gestational age were applied after first cleaning and imputing missing
values. A flow chart describing the final study size is found in supplemental Figure 1.1.
We categorized neonatal deaths by age at death as follows: first-day (0 - 23 hours), first-week
(postnatal days 1 - 6), and first-month (postnatal days 7 - 27). The timing of stillbirth relative to
delivery was unavailable for a substantial portion of stillbirths (20%) and therefore unable to be
and infant deaths up to 28 days. One-year survivors were estimated by excluding all 2014 births
who died in 2014 from the total live births.
We calculated cumulative incidence of stillbirth and death for each age at death category of the
neonatal period; we follow the convention of referring to these measures as “rates” and note
that the time period captured by each category. The denominator for calculating rate of
stillbirths was the total number of live births and stillbirths, while for neonatal mortality the
denominators were the number of live births surviving to the beginning of the age-at-death
category, as described in the supplemental materials. The one-year survival rate was estimated
using total births as the denominator. Although gestational age-specific stillbirth rates are most
accurately captured using the number of fetuses alive at the beginning of a gestational age
category as the denominator (“fetuses at risk”), such an approach is of debatable validity when
extended to neonatal mortality. 57-59 Therefore, to facilitate comparisons between the rates of
stillbirth and neonatal deaths, we calculated traditional rates based on the number of births
during the relevant gestational period for all outcomes.
We summarized selected characteristics which have been previously associated with fetal or
infant death and shown to be of high validity as recorded on birth and fetal death
certificates.60,61 We included the following characteristics: Maternal race and ethnicity,
maternal age, birth order (including stillbirths), marital status, multiple gestation pregnancy,
and method of delivery; payer and Apgar scores at 5 minutes were available only for live births.
age and sex.62 Statistical contrasts within a very large sample can lead to misleading inferences
regarding statistically significant, but clinically trivial differences; therefore we elected to focus
on descriptive patterns rather than hypothesis testing.63,64 All analyses were performed using
SAS Studio software Version 3.2 (SAS Institute, Cary NC).
Results
In the US 4,012,945 live births and stillbirths of at least 20 weeks gestational age occurred
during 2014. There were 38,512 perinatal deaths, of which 62% (n=23,901) were stillbirths and
38% (n=14,611) were neonatal deaths (Supplemental Figure 1.1). The majority of neonatal
deaths occurred on within a day of birth (60% n=8,746) while the remaining deaths occurred
with equal frequency during the rest of the first week (20% n=2,912) and the rest of the first
month (20% n=2,955). The rate of perinatal death was 9.8 per 1000 total births, which was
composed of a neonatal death rate of 4.0 per 1000 live births and a stillbirth rate of 6.1 per
1000 total births. The rate of first-day, first-week, and first-month deaths were 2.2, 0.8, and 0.8
per 1000 live births, respectively (Figure 1.1a).
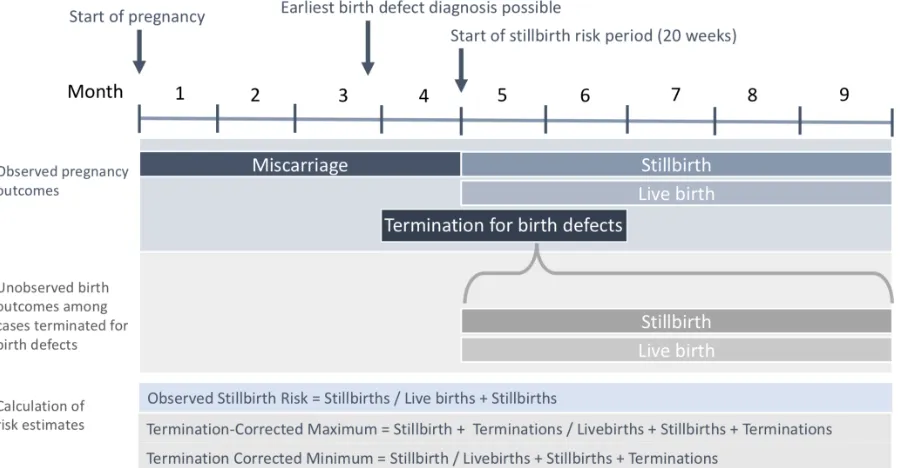
Figure 1.1. Rate of perinatal outcome overall and by multiple pregnancy or delivery method, 2014 United States resident births
[image:22.612.91.516.530.643.2]A B C
Figure 1. Rate of perinatal outcome overall (A) and by multiple pregnancy (B) or delivery method (C), 2014 United States resident births
6.1 2.2 0.8 0.8 0 1 2 3 4 5 6 7 Stillbirth First-Day Death First-Week Death First-Month Death Rate p er th ou san d su rv iv or s Overall 5.7 1.9 0.6 0.7 14.6 12.2 3.7 3.0 0 2 4 6 8 10 12 14 16 Stillbirth First-Day
Death First-Week Death First-Month Death
Rate p er th ou san d su rv iv or s
Multiple Gestation Pregnacy
Singelton Multiple 7.1 2.4 0.4 0.5 2.9
1.7 1.4 1.4
0 2 4 6 8 Stillbirth First-Day
Death First-Week Death First-Month Death
The mortality rate by postnatal day during the first postnatal week was highest on the day of
birth (22.3 per 10,000 live births) and dropped over 9-fold (2.4 per 10,000 first day survivors) on
the second day (Supplemental Table 1.2). The daily mortality rate decreased less rapidly over
the remaining first postnatal week. Stratifying by week of gestational age at delivery showed
similarly steep declines in the mortality rate between the first and second day across all
gestational ages; this occurred despite declines in the peak daily mortality rate with increasing
gestational age (Figure 1.2; Supplemental Table 1.2).
Figure 1.2. Daily mortality rate within the first week of life by category of gestational age at delivery, United States 2014
Mortality rates by age at death and rate of one-year survival by demographic, pregnancy,
delivery, and infant characteristics are found in Table 1.1. Within these characteristics and
within subgroups, the rate of stillbirth was highest followed by first-day death, then first-week
and first-month death. Within each age at death category, the highest mortality rates were
seen for mothers who were less than 20 years or older than 35 years, Non-Hispanic Black, who
[image:23.612.153.458.284.484.2]had two or more prior births, were unmarried, and whose payment source was Indian Health
Figure 2. Daily mortality rate within the first week of life by category of gestational age at delivery, United States 2014
0.1 1 10 100 1000 10000
0 1 2 3 4 5 6 7
Rate
p
er
th
ou
san
d su
rv
iv
or
s to
th
e b
eg
in
in
g o
f e
ach
d
ay
(lo
g scal
e)
Postnatal Day
Service, military health coverage, or self-pay, as opposed to Medicaid or private insurance
(insurance data available for live births only).
The mortality rate at any age in the perinatal period was highest for infants in a multiple
gestation pregnancy, born at lower gestational ages, and small for gestational age (Table 1.1).
Unlike other characteristics in which sub-categories followed the overall mortality pattern
(Figure 1.1a), multiple gestation births had an equivalent rate of stillbirth and first-day death
(Figure 1.1b). Cesarean delivery demonstrated a less sharp decline in mortality rates with age at
death than other examined characteristics (Figure 1.1c). First week and first-month mortality
rates were approximately three times higher for cesarean births than vaginal births. In contrast,
the rates of stillbirth and first-day death were approximately twice as high for vaginal births
compared to cesarean births. Five-minute Apgar scores strongly correlated with first-day death:
infants with low scores (0-3) had a 10-fold higher rate of first-day death than infants with scores
of 7 or higher (Table 1.1). Little difference was seen in the rates of first-week and first-month
Table 1.1. Rate of perinatal outcome by maternal, infant, and delivery characteristics, 2014 United States resident births
Stillbirth First-Day Death First-Week Death First-Month Death Survived to One Yearb
Rate per 1000 Total Births
Rate per 1000 Live Births
Rate per 1000 First Day Survivors
Rate per 1000 Seven
Day Survivors Rate per 1000 Total Births
N = 23909 N = 8746 N = 2912 N = 2955 N = 3871776
Overall Rate 6.1 2.2 0.8 0.8 988.3
Mother's Age
Under 20 years 7.2 2.8 0.9 1.1 984.6
20-24 years 6.1 2.3 0.7 0.9 987.4
25-29 years 5.5 2.1 0.7 0.7 989.2
30-34 years 5.6 2.0 0.7 0.6 989.8
35-39 years 6.9 2.3 0.8 0.8 988.1
Race Ethnicity
White 5.3 1.8 0.7 0.6 990.4
Black 11.9 4.3 1.1 1.4 979.0
American Indian or AK Native 7.9 2.1 0.6 1.0 985.4
Asian or PI 5.1 1.5 0.5 0.5 991.1
Hispanic 5.2 2.0 0.7 0.7 989.7
More Than One Racec -- 2.1 0.9 1.6 978.5
Live Birth Order
1 Prior Birth 3.4 2.5 0.8 0.8 990.9
2 Prior Births 3.0 1.8 0.6 0.7 995.2
3+ Prior Births 3.6 2.2 0.8 0.8 990.2
Insurance Typec
Medicaid -- 2.4 0.8 1.0 993.1
Private Insurance -- 1.9 0.7 0.6 995.7
Otherd -- 5.9 1.9 1.6 1987.0
Multiple Pregnancy
Singelton 5.7 1.9 0.6 0.7 989.3
Multiple 14.6 12.2 3.7 3.0 962.2
Small for Gestational Age
Not Small for Gestational Age 4.0 1.9 0.6 0.7 991.2
Small for Gestational Age 23.1 4.6 1.7 1.6 964.7
Gestational Age
20-23 weeks 510.6 325.7 28.4 18.8 107.5
24-27 weeks 162.6 51.0 40.3 39.6 672.0
28-31 weeks 77.5 13.3 7.4 7.1 883.7
32-36 weeks 14.4 2.8 1.4 1.5 975.8
37-39 weeks 1.4 0.3 0.3 0.4 996.2
40-42 weeks 0.8 0.2 0.2 0.2 997.6
42 weeks + 5.9 2.0 2.9 1.0 987.3
Cessarian Delivery
Vaginal 7.1 2.4 0.4 0.5 988.1
C-Section 2.9 1.7 1.4 1.4 990.0
7+ -- 51.0 27.3 17.7 885.8
3 - 6 -- 209.4 32.1 20.5 721.1
0 - 3 -- 509.4 35.1 17.5 426.9
b One year survival rates among all births at gestational age of 20 weeks or greater or 350g if gestational age was unknown a Rate per 1000 survivors in group
c Not available for stillbirths
[image:25.612.96.514.165.648.2]d Includes Self pay, Indian Health Service, military health care, other government Perinatal Death
Table 1. Ratea of perinatal outcome by maternal, infant, and delivery characteristics, 2014 United States resident births
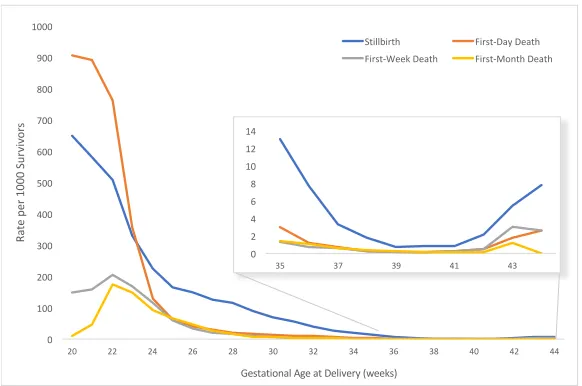
The rate of each perinatal outcome varied by gestational age at birth (Figure 1.3). Stillbirth and
first-day death showed a sharp decline with increasing gestation. First week and first-month
death showed an initial increase between weeks 20 and 22 as more infants survived the first
day and the first week, followed by a decline with increasing gestation age (Figure 1.3;
Supplemental Table 1.2). The greatest rate of decline in mortality for all categories occurred
between 22 and 24 weeks. From 24 weeks gestation onward, the stillbirth rate was higher than
the neonatal mortality rate for all age groups.
Figure 1.3. Gestational age-specific rate of perinatal outcome, 2014 United States resident births
A specified underlying cause of death was available for 98% of neonatal deaths and 70% of
stillbirths from states reporting cause of fetal death (Supplemental Table 1.3). The five most
common causes of all perinatal deaths were, in descending order, maternal complications, birth
defects, disorders of fetal growth, respiratory and cardiovascular complications, and other
[image:26.612.166.457.283.476.2]perinatal conditions (Supplemental Table 1.3). Underlying cause of death varied substantially by
Figure 3. Gestational age-specifica rateof perinatal outcome, 2014 United States
resident births
a Based on gestational age at delivery, among all infants delivered at that gestational age
0 100 200 300 400 500 600 700 800 900 1000
20 22 24 26 28 30 32 34 36 38 40 42 44
Ra
te p
er 1000 S
ur
vi
vo
rs
Gestational Age at Delivery (weeks)
Stillbirth First-Day Death First-Week Death First-Month Death
0 2 4 6 8 10 12 14
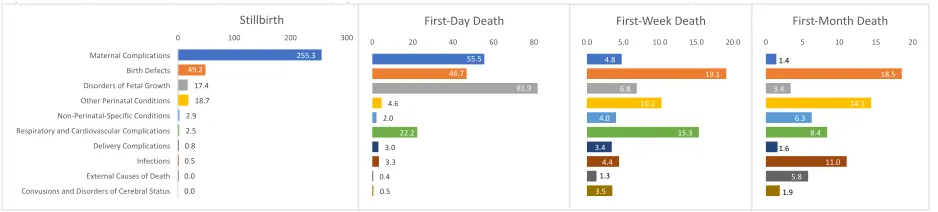
age at death (Figure 1.4). As age at death increased, deaths were distributed among a greater
number of cause of death categories: among infants with specified cause of death, 93% of
stillbirths and 84% of first day deaths had a cause of death within three categories (maternal
complications, disorders of fetal growth, and birth defects) versus 42% of first-week and 32% of
first month deaths and 45% of overall perinatal deaths (Supplemental Table 1.3. Results for
sub-categories of cause of death can be found in Supplemental Table 1.4.
Figure 1.4. Cause-specific mortality rate of perinatal outcomea by age at perinatal death, 2014 United
States resident birthsb with a specified cause of deathc
Discussion
We observed substantial changes in the mortality rate and in cause-specific mortality with age
at perinatal death, with the greatest rate of change occurring in the first two days of life. We
found that the rate of neonatal mortality was highest the first day of life at all gestational ages,
and dropped rapidly from the first to second day, consistent with prior reports across the
globe.44,49,50,65 Mothers of infants who were stillborn or died on the day of birth were similar to
mothers of other infants dying in the perinatal period in terms of maternal race, age, and
socioeconomic indicators, and these results are consistent with previous reports of risk factors
[image:27.612.80.549.254.360.2]for perinatal death in the US.6
Figure 4. Cause-specific mortality rate of perinatal outcomea by age at perinatal death, 2014 United States resident birthsb with a specified cause of deathc
a Rate per 100,000 survivors
b Data from areas of the US in which <50% of reported fetal deaths had an unspecified cause of death
c Excludes unspecified cause of death (P95, P96, R00-R94, R96-R99)
255.3 49.2 17.4 18.7 2.9 2.5 0.8 0.5 0.0 0.0
0 100 200 300
Maternal Complications Birth Defects Disorders of Fetal Growth Other Perinatal Conditions Non-Perinatal-Specific Conditions Respiratory and Cardiovascular Complications Delivery Complications Infections External Causes of Death Convusions and Disorders of Cerebral Status
Stillbirth 55.5 46.7 81.9 4.6 2.0 22.2 3.0 3.3 0.4 0.5
0 20 40 60 80
First-Day Death 4.8 19.1 6.8 10.2 4.0 15.3 3.4 4.4 1.3 3.5
0.0 5.0 10.0 15.0 20.0
First-Week Death 1.4 18.5 3.4 14.3 6.3 8.4 1.6 11.0 5.8 1.9
0 5 10 15 20
We found that the timing of perinatal death varied with delivery method. This finding is likely
the result of clinical contexts that require balancing of the benefits of cesarean delivery for the
infant against the potential harms to the mother. When infants die before the onset of delivery
or have a low probability of survival, such as infants born at a gestational age prior to viability,
the balance favors vaginal delivery.66 However, cesarean delivery may offer an immediate
survival advantage for some preterm infants who may develop a fatal condition later in the
neonatal period; thus our findings may reflect this as well.67 Similarly, the equivalent rates of
stillbirth and first-day death among multiple gestation births likely reflect a greater physician
willingness to intervene to deliver multiples than singletons, thus shifting some multiples from
stillbirths to first day deaths.68 The patterns that we found in the rates of stillbirth and first-day
death among infants by delivery method and pregnancy plurality are similar a previous report
from a single US state.41
We observed that peak gestational age-specific mortality rates occurred before 25 weeks
gestational age for all perinatal mortality groups. The inflection point near the line of viability
(22-23 weeks) likely reflects both improved biological viability of neonates as well as the
willingness to intervene to deliver fetuses at high risk of stillbirth and to perform life-saving
interventions starting at this time.66 The elevated rate of stillbirth compared to neonatal deaths
after 24 weeks may reflect a delay between stillbirth and delivery thus gestational age at
delivery may misclassify age at death by a week or more, but other factors may be involved.
This delay may also overestimate the rate of small for gestational age among stillbirths when
using gestational age at delivery, as we have done here.
largely distinct from later neonatal deaths. Furthering previous reports, we found that there are
substantial changes in the major causes of death within the early neonatal period. Most
stillbirths with a specified cause of death and first-day neonatal deaths were directly due to
conditions arising in pregnancy, such as maternal complications and prematurity. In contrast,
with the exception of birth defects, the major causes of first-week and -month mortality were
varied and more likely to be due to conditions that arise after delivery, such as postnatal
infections and respiratory complications. Our results are generally consistent with previous
findings based on global data showing that neonatal mortality within the first week is
predominantly associated with prematurity and delivery complications while neonatal mortality
after the first week is predominately associated with infection and that birth defects are an
important cause of death in both periods. 2,47,65,69
Although we found that the rates and proportions of cause specific mortality for stillbirths and
first day deaths are not exactly aligned, most stillbirths and first day deaths were attributed to
the same three cause of death categories. Differences in the relative ranking of these major
causes may reflect true differences in etiology or differences in how cause of death is reported
for stillbirths and first day deaths: a stillbirth following chorioamnionitis at 23 weeks gestational
age may be attributed to this condition, but a first day death at the same gestational age may
be attributed to prematurity, even though the premature delivery was initiated by
chorioamnionitis. This differential reporting occurs despite recommendations within ICD-10
instructions not to attribute cause of death to prematurity unless it is the only fetal or infant
condition known.53 Although differential attribution of cause of death may also exist for later
day deaths suggests that the effect is greatest for this group.
Our findings bear striking similarities to those from developing countries, which found the
leading causes of stillbirth to be maternal and placental conditions (e.g., hemorrhage,
hypertension) and delivery complications; first day death to be delivery complications,
prematurity, and birth defects; and later (first week and first month) deaths to be due to
infections and birth defects.48,50,51 However, the specific infections driving mortality reported in
these studies (e.g., tetanus and sepsis) and the predominance of delivery complications as a
cause of stillbirth and first-day death in low- and middle-income countries are important
differences that reflect the developmental contexts of the studies.
An important implication of our results is that because etiology differs for first-day and later
neonatal deaths, the interventions needed to prevent deaths at each time point differs. Yet,
first day deaths are currently hidden among all neonatal deaths and within composite perinatal
death outcomes leading the resulting analyses of risk factors and causes to be distorted by the
combination of outcomes with rapidly changing etiologies. In contrast, the causes of first day
deaths overlap substantially with stillbirth, and medical decisions can shift a death from one
time period to the other. Yet, these deaths are often treated as different outcomes or
combined with all neonatal deaths. This artificial split between stillbirths and first day deaths
also hampers the ability to identify the interventions needed to prevent these deaths are likely
shared, particularly among preterm births.
Therefore, we suggest that first-day mortality be reported separately from later neonatal
mortality. In light of the substantial differences in etiology between stillbirth and later neonatal
all first week or first-month deaths as an outcome category is best avoided. When competing
risks are a concern, such as when medical decisions on when and how to deliver a high-risk
infant may determine whether it is stillborn or dies soon after birth, combining stillbirth and
first day deaths may improve comparability by time and place for health system assessments
while maintaining a more etiologically homogenous category than overall perinatal death for
epidemiological research. However, further research with more detailed cause of death data is
needed to confirm the etiological overlap of stillbirth and first-day death before use of a
combined category can be suggested for etiological studies.
Strengths and Limitations
Our study has several important strengths. The use of vital statistics data provides a full
accounting of all live births and neonatal deaths during the study period and is thus the study
population in its entirety rather than a sample of the population. This eliminates selection bias
and reflects real-world conditions, thus providing broad generalizability of the results. In
addition, we took steps to improve validity and minimize bias, such as having the same
inclusion criteria for stillbirths and live births, removing illogical values of gestational age, and
replacing missing or illogical gestational age values with imputed values. Cause of death for
stillbirths and neonatal deaths is reported by physicians.
Surprisingly, remarkable consistency has been found across countries in the proportion of
neonatal deaths occurring on the first day regardless of country income level, neonatal
mortality rate, and region.44,47 Our findings on the causes of death by age at death show
substantial similarities to findings from developing countries. Therefore, we expect our main
these groups share etiology distinct from later neonatal deaths, to generalize broadly.
There are also several important limitations to our study. Stillbirths are known to be
underreported in vital statistics, in part because there is some classification overlap with early
neonatal death as well as poor reporting at the margin of the definition of stillbirth.23,40,41,70 The
high degree of overlap in the major causes of death for stillbirth and first-day death suggests
that there are common etiologies, regardless of any inconsistency in reporting. The major
causes of stillbirth identified in our study are generally consistent with previous studies based
on direct examination of stillbirths and medical records, suggesting that underreporting of
stillbirths within vital records does not lead to substantial bias.12,14
An additional limitation of vital statistics data is incomplete reporting of risk factors and events
during pregnancy.60,61 We have attempted to leverage the strengths of vital statistics data by
only using fields shown to have high validity. Although some possible covariates, such as
maternal complications, are highly relevant to our question validation studies have found them
to be substantially underreported on certificates. 60,61,71 Fortunately, we are able to capture
some of the effects of these conditions through the analysis of cause of death data. 72 However,
it should be noted that establishing cause of death, particularly for stillbirth is complicated and
imprecise. Additionally, due to the large number of stillbirths with an unspecified cause of
death and the preponderance of prematurity, a non-specific cause of death, among first day
deaths further analysis using a data source with more detailed causal data is needed to
determine whether stillbirth and first day death have sufficient etiological commonality to be
Conclusions
We found substantial changes in the mortality rate and cause-specific mortality with age at
perinatal death. Among 2014 US births, we observed the highest mortality rates among
stillbirths and first-day neonatal deaths, with mortality rates dropping dramatically after the
first day of life. Stillbirth and first day deaths were found to share causes that were largely
distinct from those found among later neonatal deaths, therefore use of a composite perinatal
death outcome is discouraged. Combining stillbirth and first day deaths may improve
comparability by time and place for system assessments while maintaining a more etiologically
homogenous category than perinatal death for epidemiological research. However, further
research is needed to directly address this question. We suggest that the number, rate, and
causes of neonatal death on the day of birth be reported separately from other neonatal deaths
when possible. Systematic reporting of first day deaths would bring focus to a period of high
Chapter 1 Supplemental Tables and Figures
Supplemental Figure 1.1. Construction of the study cohort. GA = gestational age; BW = birth weight.
Supplemental Table 1.1 ICD-10 codes used to create underlying cause of death categories.
Infant Death File Fetal Death File Live Birth File
52,872
97 Non-Residents
52,775
3,510No Valid GA and BW <350g
23,314 GA <20 and no BW 2,050 No GA and
no BW 23,901 Stillbirths 23,085 35 Non-Residents 23,050
878 No GA and BW <350g
7,443 Non-neonatal Infant Deaths 14,611 Neonatal Deaths 3,998,175 10,099 Non-Residents 3,988,076
122 No Valid GA and
BW <350g 20,381* Infant deaths
3,966,990 One-year Survivors Study Population 22,054 3,989,044 Live Births 4,012,945 Total Births
118 No GA and no BW
583 No Valid GA
and no BW
Supplemental Figure 1. Construction of the study cohort, 2014 US resident births
*Infant deaths in 2014 that occurred among 2014 births; Infant deaths are included in the infant death file based on death occuring in 2014 but birth could have occurred in 2013 BW = birthweight
GA = gestational age
Cause of Death ICD 10 Codes ICD PM Categories Description
Maternal Complications P00 - P03 M1-M4
Premature rupture of membranes, incompetent cervix, multiple pregnancy, maternal hypertensive disorders, maternal conditions unrelated to pregnancy, other maternal complications of pregnancy. Chorioamnionitis, placental complications, intrauterine or breast milk exposure to noxious substances, cord complications, other membrane abnormalities
Disorders of Fetal Growth P05 - P08 A5, I6, N2
Slow fetal growth and malnutrition, short gestation and low birth weight, long gestation and high birth weight
Complications of Labor and Delivery P10 - P15, P20 - P21 A3, I3, N4,I2, N3 Antepartum or intrauterine hypoxia, birth trauma
Convusions and Disorders of Cerebral Status P90 - P91 N5 Convusions, neonatal coma, hypoxic ischemic encephalopathy, other disturbances of cerebral status
Respiratory and Cardiovascular Disorders P22, P24 - P29 N7
Respiratory distress of newborn, neonatal aspiration syndromes, interstitial emphysema and related conditions, pulmonary hemorrhage, chronic respiratory disease, atelectasis, all other respiratory conditions originating in the perinatal period. Cardiac failure, congestive heart failure, and all other disorders of the cardiovascular system (excluding heart defects).
Infection P23, P35 - P39, A50, G00 - G03, G04 - G09 A2, I4, N6
Bacterial sepsis of newborn, omphalitis of newborn, congenital pneumonia, all other infections specific to the perinatal period, neonatal teatnus
Birth Defects Q00 - Q99 A1, I1, N1 Structural birth defects, chromosomal birth defects
Other Perinatal Conditions P50 - P61, P70 - P78, P80 - P83, P92 - P94 A4, I5, N8
Necrotizing entercolitis, non-immune hydrops fetalis, fetal blood loss, intracranial hemmorage and other conditions specific to the perinatal period
Fetal or Neonatal Death of Unspecified Cause P95, P96, R00-R94, R96-R99 A6, I7, N10, N11 Unspecified or ill defined cause of fetal or neonatal death
Non-Perinatal-Specific Conditions A00-A41, A81-A98 B00, B02-B04, B06-B19, B25, B27-34 * D00-D48, C00-C80, C88, C90-C97, D50-D76, E00-E88
F01-F99, G00, G03-G04, G06-G11, G12.1-G12.9, G20-G72, G80-G93.9, G95-G98 H00-H57, I00-I28, I30-I31, I33-I38, I40, I42, I44- I51, I60-I99
J22, J30-J39, J43-J44, J47-J68, J70-J98, K00-K38, K40-K46, K50-K92 L00-M99, N00-N15, N17-N23, N25-N95, R00-R53, R55-R94, R96-R99
R95, W00-W34, W35-W64, W75, W76-W99, Y00-Y09, Y10-Y36, Y40-Y84, * Sudden infant death syndrome, accidental death, homicide, neglect abandonment and X10-X39, X50-X59, X60-X85-X90-X92, X96-X99, *U01.0-*U01.3,*U01.5-*U01.9 maltreatment syndromes, complications of medical and surgical care, all other external causes a International Classification of Diseases, Tenth Revision
* Miscelaneous in ICD-PM
External Causes of Death
Infectious and parasitic diseases, neoplasms, anemias, hemorrhagic conditions, nutritional deficiencies, endocrine nutritional and metabolic diseases, diseases of the nervous system, diseases of the circulatory system, diseases of the respiratory system, diseases of the digestive system, diseases of the genitourinary system
Supplemental Table 1.3. Proportion of cause of death among stillbirths and neonatal deaths by age at death, and all perinatal deaths combined, among infants with a specified cause of
Supplemental Table 1.4 Number and ratea of detailed cause of death by age at perinatal death,
2014 US resident birthsb
Cause of Death ICD-10 Codes N Rate N Rate N Rate N Rate
Maternal Conditions
Maternal Hypertensive Disorders P00.0 778 19.7 54 1.4 8 0.2 2 0.1
Other Maternal Medical or Surgical Conditions P00.1 - P00.9 625 15.9 55 1.4 19 0.5 4 0.1
Incopentent Cervix P01.0 456 11.6 393 10 7 0.2 1 0
Premature Rupture of Membranes P01.1 1687 42.8 632 16.1 32 0.8 5 0.1
Multiple Pregnancy P01.5 411 10.4 94 2.4 10 0.3 6 0.2
Maternal Death P01.6 14 0.4 4 0.1 2 0.1 1 0
Malpresentation Before Labor P01.7 4 0.1 8 0.2 1 0 0 0
Other Maternal Complication of Pregnancy P01.2 - P01.4, P01.8 - P01.9 309 7.8 124 3.2 13 0.3 1 0
Placenta Previa P02.0 23 0.6 10 0.3 0 0 0 0
Placental Separation and Hemorrhage P02.1 1620 41.1 277 7.1 33 0.8 17 0.4
Morphologic and Functional Abnormalities of Placenta P02.2 1255 31.9 12 0.3 4 0.1 1 0
Placental Transfusion Syndromes P02.3 119 3 35 0.9 13 0.3 4 0.1
Prolapsed Cord P02.4 152 3.9 16 0.4 5 0.1 1 0
Compression of Umbilical Cord P02.5 1133 28.8 8 0.2 1 0 1 0
Other Umbilical Cord Conditions P02.6 594 15.1 7 0.2 1 0 1 0
Chorioamnionitis P02.7 686 17.4 359 9.2 25 0.6 9 0.2
Other Membrane Abnormalities P02.8 - P02.9 15 0.4 0 0 0 0 0 0
Malpresentation P03.0 - P03.1 16 0.4 10 0.3 3 0.1 0 0
Complications of C-Section P03.4 0 0 0 0 1 0 0 0
Other Delivery Complications P03.2 - P03.9 160 4.1 74 1.9 8 0.2 2 0.1
Noxious Substances P04 137 3.5 23 0.6 4 0.1 2 0.1
Disorders of Fetal Growth
Small for Gestational Age P05 121 3.1 46 1.2 30 0.8 23 0.6
Prematurity P07 562 14.3 3162 80.7 236 6.1 109 2.8
Large for Gestatonal Age / Post Term P08 4 0.1 0 0 1 0 0 0
Delivery Complications
Birth Trauma P10 - P15 2 0.1 1 0 6 0.2 4 0.1
Intrauterine Hypoxia P20 30 0.8 45 1.1 70 1.8 30 0.8
Birth Asphyxia P21 0 0 72 1.8 57 1.5 28 0.7
Convulsions and Disorders of Cerebral Status
Convulsions and Other Disorders of Cerebral Status P90 - P91 0 0 21 0.5 136 3.5 74 1.9
Respiratory and Cardiovascular Conditions
Respiratory Distress of Newborn P22 3 0.1 141 3.6 191 4.9 114 2.9
Primary atelectasis P28.0 - P28.1 2 0.1 146 3.7 47 1.2 16 0.4
Other Respiratory Conditions P28.9 13 0.3 94 2.4 179 4.6 81 2.1
Cardiovascular Complications P29.0 79 2 490 12.5 182 4.7 115 3
Infections
Viral Infections A50 9 0.2 7 0.2 17 0.4 52 1.3
Other Perinatal Infections P35, P37 - P39 6 0.2 27 0.7 6 0.2 27 0.7
Meningitis G00 - G03 0 0 0 0 1 0 13 0.3
Congenital Pneumonia P23 2 0.1 4 0.1 10 0.3 37 1
Bacterial Sepsis P36 1 0 90 2.3 138 3.5 299 7.7
Encephelitis G04 - G09 0 0 0 0 0 0 2 0.1
Other Perinatal Conditions
Fetal Blood Loss P50 17 0.4 6 0.2 7 0.2 0 0
Intracranial Hemorrhage P52 9 0.2 17 0.4 229 5.9 101 2.6
Other Hemorrhage P51, P53 - P54 3 0.1 14 0.4 31 0.8 19 0.5
Hemolytic Conditions P55-P56 14 0.4 2 0.1 5 0.1 0 0
Necrotizing Entercolitis P77 0 0 3 0.1 18 0.5 320 8.2
Hydrops Fetalis (not due to hemolytic disorders) P83.2 230 5.8 100 2.6 43 1.1 25 0.6
Other Perinatal Conditions (Remainder) P80 - P83.1, P83.3 - P94, P96 465 11.8 37 0.9 66 1.7 95 2.4
Birth Defects
Neurological Defects Q00 - Q07 355 9 336 8.6 127 3.3 86 2.2
Heart Defects Q20 - Q28 211 5.4 142 3.6 178 4.6 264 6.8
Respiratory Defects Q30 - Q34 16 0.4 183 4.7 52 1.3 38 1
Digestive Defects Q35 - Q45 16 0.4 5 0.1 11 0.3 8 0.2
Renal and Urinary Defects Q60 - Q64 126 3.2 342 8.7 86 2.2 20 0.5
Musculoskeletal Defects Q65 - Q85 212 5.4 215 5.5 68 1.7 98 2.5
Chromosomal Defects Q90 - Q99 707 17.9 309 7.9 162 4.2 163 4.2
Other Birth Defects Q10 - Q18, Q50 - Q56, Q86 - Q89 295 7.5 297 7.6 62 1.6 46 1.2
Unspecified
Unspecified COD P95, P96, R00-R94, R96-R99 7204 182.9 97 2.5 53 1.4 116 3
Non-Perinatal Specific
Non-Perinatal Specific A, B, C, D, E, G, H, K, L-N U04c 113 2.9 80 2 156 4 244 6.3
External
SIDS R95, W75 0 0 1 0 38 1 198 5.1
Accidents V01-X59 1 0 4 0.1 7 0.2 11 0.3
Complications of Medical or Surgical Care Y40 - Y84 0 0 1 0 3 0.1 2 0.1
Homicide *U01, X85 - Y09 0 0 8 0.2 3 0.1 14 0.4
Supplemental Table 4. Number and ratea of detailed cause of death by age at perinatal death, 2014 US resident birthsb
b Cause of death for stillbirths are limited to stillbirths from 2014 US Fetal Deaths in areas of the US using the 2003 revision of the fetal death certificate a Rate per 100,000 survivors in group
c Codes A50, G00 - G03, and G04 - G09 are included in Infections
First Month Death First Week Death
First Day Death Stillbirth
Chapter 2. Risk of stillbirth among fetuses with non-syndromic major birth defects: a population-based study incorporating estimates of the impact of competing events
DOMINIQ UE HEIN KE,ERINI NESTORIDI,SONIA HERNAND EZ-DIAZ,PAIGE LWILLIAMS,JAN ET WRICH
-EDWARDS, ANGELA ELIN,CARLA MVAN BENNEKOM,AL LEN AMITCHEL,WEND Y N NEMBHARD,RUTH
Abstract
The risk of stillbirths in the US population is 0.6%. We sought to estimate the risk of stillbirth
among cases of non-syndromic major birth defects and to quantify the impact of elective
termination and first day neonatal death on estimates. We included major birth defect cases in
the National Birth Defects Prevention Study identified through active population-based
surveillance programs in nine US states between 1997 and 2011. Birth defects were confirmed
and classified by clinical geneticists after medical records review. Estimates excluded defects
unreliably ascertained in stillbirths (e.g., heart defects). We calculated the observed risk of
stillbirth, termination-corrected minimum (terminations assumed live born) and maximum
(terminations assumed stillborn) risk, and risk of combined mortality (termination, stillbirth,
and first-day neonatal death) among cases of specific birth defects surviving ≥ 20 weeks GA
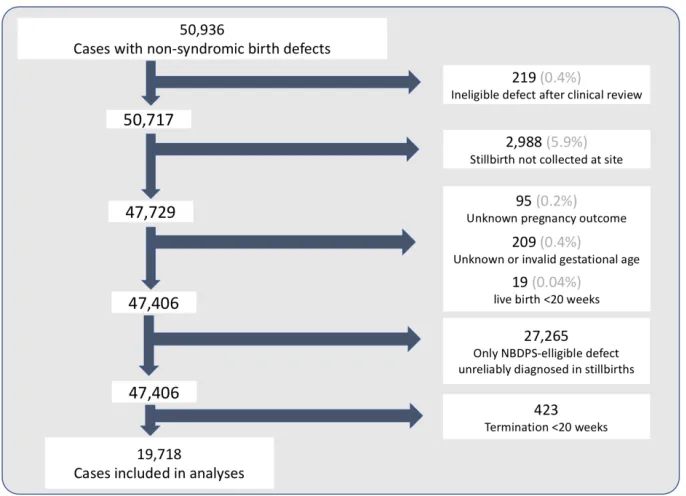
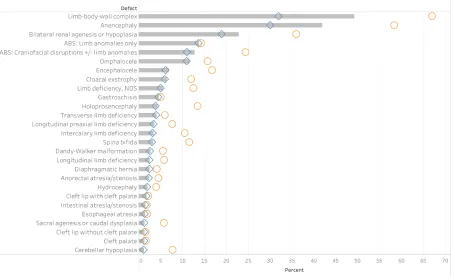
overall and stratified by defect pattern. Among 19,718 cases, 843 were stillborn, 698 electively
terminated, and 18,186 live born. Observed stillbirth risk ranged from 1.2% for cerebellar
hypoplasia to 49.2% for limb-body-wall complex. The difference in minimum and maximum
termination-corrected risk estimates ranged from 0.2 percentage points for cleft lip without
cleft palate (range: 1.3 – 1.5%) to 35.1 percentage points for limb-body-wall complex (range:
31.9 – 67.0%). Isolated cases had lower risks of stillbirth and combined mortality than multiple
defect cases. Stillbirth comprised half or more of the combined mortality for isolated cases of
most birth defects. Fetuses with major non-syndromic birth defects have an increased risk of
stillbirth which varies by specific defect and is further increased for multiple defect cases.
Estimates may aid counseling after prenatal diagnosis; estimates which incorporate competing
Introduction
Major structural birth defects are common, occurring in one pregnancy for every 33 live births,
and are well recognized as a major cause of infant mortality.5,73 Although major birth defects
are identified among fifteen to 20% of stillborn infants, the risk of stillbirth among fetuses with
major birth defects has not received the same policy and research attention as the risk of infant
mortality.1,12 Consequently, little is known about the risk of stillbirth among infants with
specific birth defects, yet they are needed to provide evidence-based counseling to families
with prenatally-diagnosed birth defects and identify opportunities for prevention of
stillbirth.72,74
Such data are lackingin part due to the substantial challenges of identifying a large
representative sample of infants and fetuses with well-characterized defects, many of which
are relatively rare, occurring at a rate of fewer than 5 cases per 10,000 live births. 13,73,75 Thus,
nearly all published prevalence estimates for stillbirth among infants with specific birth defects
are based on small samples of infants identified from a single center or hospital network,
yielding unstable estimates with limited generalizability.76-78 Further, limited sample sizes often
preclude estimating the risk of stillbirth for important subgroups, such known genetic or
chromosomal origins, specific phenotypes within a defect class, or multiple birth defects.79
Estimates of stillbirth risk are further complicated by competing events, which alter the pool of
fetuses at risk. Termination of pregnancy for birth defects is more common for fetuses with
high risk of stillbirth from the population of fetuses at risk. 27,30,80,81 Additionally, variation in the
categorization of perinatal deaths as stillbirths or neonatal deaths (e.g., through selective
medical delivery of high risk fetuses to avert stillbirth resulting in death soon after delivery) may
also act as competing events and thus bias stillbirth risk estimates. 20,21
All studies, including the few larger population-based studies published, have excluded
terminated cases from analyses and no study has accounted for inconsistency in classification
of stillbirth versus early neonatal deaths, both of which may have biased stillbirth risk
estimates. 22,79,80
We conducted a population-based cohort study to estimate the risk of stillbirth among infants
with selected specific, non-syndromic birth defects using cases from the National Birth Defects
Prevention Study. We expand upon previous population-based analyses by estimating the
maximum and minimum termination-corrected risk of stillbirth, including estimates for infants
with multiple birth defects, and calculating the combined prenatal and immediate neonatal
mortality from 20 weeks of gestation through the first day of life.
Methods
Study Population
The National Birth Defects Prevention Study (NBDPS) is a large, population-based collaborative
multi-state case-control study of 33 specific major birth defects in the United States (US) from
1997 to 2011.13 Briefly, birth defect cases were identified using active surveillance systems in all
or part of 10 states (Arkansas, California, Georgia, Iowa, Massachusetts, North Carolina, New
identified potentially eligible birth defect cases in their respective catchments. Sites reviewed
medical records of all identified stillborn infants for evidence of birth defects. Abstracted
medical records of all identified birth defect cases were reviewed by physicians with specialist
training in birth defects (clinical geneticists) at each site to confirm every reported birth defect
diagnosis. Pre-defined information from the abstracted medical records was included in the
NBDPS clinical database. Institutional Review Board approval was obtained by all study sites.
Eligibility
Birth defect cases with a known or strongly suspected single gene or chromosomal disorders
(“syndromic cases”) were ineligible for the NBDPS; genetic studies were not required for
eligibility. Cases with a pregnancy outcome of live birth, termination, or stillbirth (fetal death at
≥20 weeks gestational age at delivery or a birth weight of ≥500g), were eligible for inclusion in
the study; spontaneous losses <20 weeks gestational age were ineligible. We included all cases
in the clinical database meeting our study criteria regardless of gestational age.
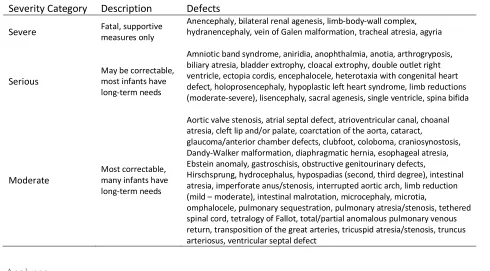
Defect Classification
All cases in the NBDPS clinical database were further reviewed by study clinical
geneticists who evaluated whether each NBDPS-eligible birth defect case met standard
study criteria for inclusion in birth defect-specific etiologic analyses and classified each
by birth defect pattern (isolated, multiple, sequence, complex) according to a standard
algorithm which has been described in detail.82 For our analyses, we considered fetuses
with a classification other than isolated to have multiple birth defects, and we further
categorized the latter according to the most severe defect present. Severity categories