MECHANICAL PROPERTIES OF C-S-H GLOBULES AND INTERFACES
1
BY MOLECULAR DYNAMICS SIMULATION
2
Ding Fan1 and Shangtong Yang1* 3
1
Department of Civil and Environmental Engineering, University of Strathclyde, Glasgow,
4
G1 1XJ, United Kingdom.
5 6
ABSTRACT
7
At meso-scale, Calcium Silicate Hydrate (C-S-H) can be considered as randomly 8
packed globules (about 4.2nm), which forms the basic unit cell, with water molecules 9
and voids. In this paper, the nanostructures for the globules are developed based on 10
some plausible atomic structures of C-S-H. The mechanical properties for the C-S-H 11
globules are determined through molecular dynamics simulation. Interfaces between 12
the C-S-H globules are also simulated with different amount of water molecules. Key 13
material parameters, e.g., Young’s modulus, strength and fracture energy, are 14
obtained. It has been found that longer mean chain length of silicate tends to increase 15
the strength of C-S-H and change the fracture behavior from brittle to ductile failure, 16
in the chain length direction. In the other direction, however, silicate chains do not 17
play an important role while interlayer structure matters. Moreover, pores in the 18
C-S-H nanostructures can considerably reduce the strength of the globule structures in 19
the normal direction to silicate chain but the weakening effect becomes substantially 20
less in silicate chain direction. Further, it has been found that for all types of the 21
interfaces between C-S-H globules, the interface with no extra water molecules has 22
the greatest tensile/shear strength. The mechanical properties obtained in this paper 23
for C-S-H nanostructures and interfaces are necessary inputs to the meso-scale 24
modelling of C-S-H via either granular mechanics, i.e., DEM, or continuum 25
mechanics, i.e., FEM. 26
KEYWORDS
27
C-S-H; mechanical properties; molecular dynamics modeling; interfaces; colloidal 28
model; meso-scale. 29
1. INTRODUCTION
31
32
Since the invention of modern cement, there has been considerable mass of research 33
carried out in improving cement characteristics in terms of toughness [1], strength [2, 34
3] and durability [4, 5]. Recently, there is a growing research interest in modeling the 35
atomic structure and investigating the nano/micro-scopic properties of cement [6-10]. 36
In light of difficulties in conducting experimental tests at the nano/micro-scale level, 37
atomic modeling provides a unique view in understanding the fundamental behavior, 38
especially mechanical properties, of the cementitious materials. 39
Calcium Silicate Hydrates (C-S-H) gel is the main binding phase of the cement 40
hydration products, significantly contributing to the cohesion and strength of cement. 41
C-S-H gel is known as imperfect crystalline and a close analogue of Tobermorite and 42
Jennite minerals. In the past three decades, a number of crystalline models for C-S-H 43
structure were identified or developed, based on the well-known Tobermorite and/or 44
Jennite structures [11-17]. 14 Å Tobermorite and Jennite are the most common 45
crystalline phases presented, whereas the modelling of real imperfect crystalline 46
structure of the C-S-H gel is tremendously challenging. Generally, the C-S-H 47
structure can be characterized in terms of calcium/silicon (Ca/Si) ratio which 48
normally ranges from 0.6 to 2.3 [18]. 14 Å Torbermorite has a chemical formula 49
Ca5Si6O16(OH)2·7H2O and a density of 2.18g/cm3. Typical Jennite has a Ca/Si ratio of 50
1.5, a density of 2.27 g/cm3 and a formula Ca9Si6O18(OH)6·8H2O [19]. Accordingly, 51
Richardson [14] has developed Tobermorite/Jennite (T/J) model and 52
Tobermorite/Calcium Hydroxide (T/CH) model for C-S-H. The T/J model is a 53
combined Tobermorite and Jennite domains while the T/CH model contains 54
Tobermorite silicate chains sandwiching calcium hydroxide, providing higher Ca/Si 55
ratios. Another widely-cited C-S-H model is the so-called realistic molecular structure 56
of C-S-H, developed by Pellenq and his co-workers [20]. This model has defected 57
ratio of 1.65 which is close to the recent experimental findings, i.e., 59
(CaO)1.7(SiO2)(H2O)1.80, by neutron scattering measurements [21]. They postulated 60
that the Ca/Si ratio remains the most important parameter in any model construction 61
of C-S-H. Moreover, Richardson [22] developed a series of models for C-S-H with 62
Ca/Si lower than 1.4 representing different mean chain lengths using crystal-chemical 63
and geometrical reasoning. 64
Based on the C-S-H models, atomic simulation, mainly through molecular dynamics 65
(MD) modeling, have been conducted in recent years to determine the mechanical 66
properties of C-S-H. Al-Ostaz, et al. [23] simulated the mechanical properties of the 67
14 Å Tobermorite, Jennite and calcium hydroxide. They have found that the force 68
field chosen and size of simulation box affected the results. For example, different 69
force fields resulted in different mechanical properties. Moreover, the C-S-H unit 70
needed to be duplicated 3×3×3 to match the experimental mechanical properties for 71
initial MD modeling as the mechanical properties of the original unit and 2×2×2 72
supercell were not very close to the experimental data. Moreover, Hou, et al. [24] 73
modeled the C-S-H structure based on the 11Å Tobermorite [25] with ClayFF force 74
field [26] and investigated the effects of the water layer, silicate chain, and Calcium 75
atoms in the interlayer on the mechanical properties of C-S-H. Other than elastic 76
properties, MD simulation can also be employed to study the fracture properties of 77
cement at the nanoscale. A similar structure as proposed in Pellenq, et al. [20] was 78
used and duplicated several times to form a cube with the size of 13.8 nm; direct 79
tension was then applied to investigate the Mode I fracture of C-S-H under CSHFF 80
force field [27]. It has been found that Ca-O and Si-O bonds were provided to 81
contribute the most cohesive force on xy plane, and weaker H- bonds bind the 82
structure on z plane. In addition, size effects have been shown as result of different 83
size of the central voids made by deleting different number of atoms, on weakening 84
evaluated by MD simulations, and the brittleness was discussed in comparison with 86
other brittle materials at the atomic scale [28]. 87
When the structure of C-S-H evolves from nanoscale to mesoscale, it is much more 88
unclear. There are perhaps only two widely acknowledged models, namely, Colloidal 89
model [29, 30] and Feldman-Sereda model [31], to describe the mesostructure of 90
C-S-H. In Jenning’s Colloidal model, a globule (about 4.2nm) forms the basic unit 91
cell which is a discrete nano particle; the globules are not linked together but packed 92
randomly with water molecules and voids. In Feldman-Sereda model, however, long 93
layers of C-S-H are well aligned and extend from one nanocrystalline region to 94
another. The 4.2nm unit cell (globule) of C-S-H in the Colloidal model has four or 95
five layers of silicate chains, sandwiching Calcium ions, water molecules and possibly 96
pores. The unit cell then discretely joins each other in different directions to form the 97
mesostructure of C-S-H. To simulate the mesoscale mechanical properties of C-S-H, 98
granular mechanics would be of much interest; however, the mechanical properties of 99
the globule itself and the interfaces on the joining surfaces of these nanostructure cells 100
would need to be obtained in advance. This paper attempts to determine the basic 101
mechanical properties of the globule of C-S-H and the interfaces of the globules in 102
terms of different water contents. The atomic structure of C-S-H in Richardson [14] 103
and the ReaxFF force field are employed in the molecular dynamics simulation. The 104
results in this study will provide important and necessary input for mesoscale 105
modeling of C-S-H by either discrete element modeling or finite element modeling. 106
2. MODEL CONSTRUCTION
107
The atomic structures of C-S-H used in this paper are chosen from Richardson [22], 108
i.e., T2_ac and T11_14sc. T2_ac is a double-chain Tobermorite-based monoclinic 109
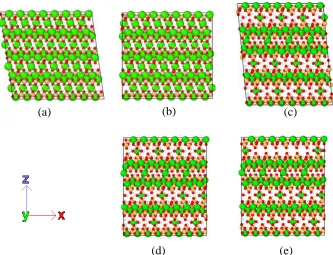
structure, derived from Merlino, et al. [32] in which all the interlayer Ca atoms are in 110
octahedral coordination with oxygen atoms in silicate chains, as shown in Figure 1(a). 111
silicate chains is 11 Å and the layer spacing is 14 Å, as presented in Figure 1(c). 113
Based on these two structures, two orthorhombic structures are generated (Figure 1(b) 114
and (d)). Moreover, in Jennings’s Colloidal model intragobular pores (IGP) may exist 115
in the unit cell of globule and the effects of IGP have not been addressed or simulated 116
yet. In this paper, a structure containing IGP is produced as shown in Figure 1(e). And 117
the characteristics of all five models is listed in Table 1. All structures are tested 118
under uniaxial tension along y and z axis. For T2_ac molecular structure with 119
chemical formula Ca4H2(Si2O7)2Ca4H20, the lattice parameters of a = 11.35 Å, b = 7.3 120
Å, c = 21.5 Å and β = 98.4° with space group C12/c1 are duplicated as 4 × 6 × 2 along 121
x-, y-, z- directions, respectively, to generate Model I; the structure is then changed to 122
orthorhombic structure, where the volume, density, atom position and bonds 123
information are kept the same, as named Model II. For T11_14sc molecular structure 124
with chemical formula Ca9(Si11O28(OH)6)(H2O)7.25, the lattice parameters of a = 11.35 125
Å, b = 7.3 Å, c = 52.7 Å and β = 95.5° with space group C1 are duplicated as 4 × 6 × 126
1 supercell along x-, y-, z- directions, respectively, to generate Model III; the structure 127
is then changed to orthorhombic, namely, Model IV. Model V is the IGP structure. 128
LAMMPS [33] is used to perform the MD simulations. 129
130
Model III and Model IV have advantages to be used as the basic structure to 131
investigate the effects of IGP [30] on the mechanical properties of C-S-H, since the 132
interlayer Calcium atoms have the occupancy lower than 1.0 which can be arranged in 133
MD simulation for a targeting structure. In this paper, Model IV is modified by 134
rearranging the first upper interlayer Calcium atoms in the unit with a number of 135
water molecules to maintain appropriate Ca-O coordination number [22], for a 136
porosity of 10.43%, shown as Model V in Figure 1(e). All simulation boxes, i.e., 137
Models I – V, are relaxed for 50 ps in the isobaric-isothermal ensemble (NPT) and 138
coupled to zero external pressure in the x, y, z dimensions. The Nose-Hoover 139
used to maintain the pressure at p = 0Pa. After it reaches equilibrium, the system is 141
subjected to the tensile load along y- and z-direction with a constant strain rate at 0.08 142
Å/ps. For the strain-stress relation along y direction, the pressures in the x and z 143
directions are kept at zero, and for the strain-stress relation along z direction, the 144
pressures in the x and y directions are kept at zero. 145
146
ReaxFF has been extensively used in simulating the molecular behavior of C-S-H 147
structures, e.g., [34, 35]. In general, ReaxFF can simulate the chemical and physical 148
interactions between Ca, Si, O, H atoms in the C-S-H gel and the interfaces. The 149
potential energy defined by the ReaxFF can be expressed as follows [36]: 150
𝐸𝑠𝑦𝑠𝑡𝑒𝑚= 𝐸𝑏𝑜𝑛𝑑+ 𝐸𝑙𝑝+ 𝐸𝑜𝑣𝑒𝑟+ 𝐸𝑢𝑛𝑑𝑒𝑟+ 𝐸𝑣𝑎𝑙+ 𝐸𝑝𝑒𝑛+ 𝐸𝑐𝑜𝑎+ 𝐸𝐶2+ 𝐸𝑡𝑜𝑟𝑠 + 𝐸𝑐𝑜𝑛𝑗+ 151
𝐸𝐻−𝑏𝑜𝑛𝑑+ 𝐸𝑣𝑑𝑊𝑎𝑎𝑙𝑠+ 𝐸𝐶𝑜𝑢𝑙𝑜𝑚𝑏 (1) 152
where Ebond is bond energy, Elp is long pair energy, Eover is over coordination energy, 153
Eunder is under coordination energy, Eval is valence angle energy, Epen is penalty energy, 154
Ecoa is three-body conjugation energy, EC2 is C=C correction, Etors is torsion rotation 155
energy, Econj is four-body conjugation energy, EH-bond is hydrogen bond interaction 156
energy, EvdWaals is van der Waals interaction energy and ECoulomb is coulomb interaction 157
energy. The energy of per atom is calculated by defined potentials from neighbor 158
atoms. In the present study, not all of terms in Eq.(1) are considered necessary and 159
some of them are set to zero, which reduces terms of the energy expression as 160
follows: 161
𝐸𝑠ystem= 𝐸𝑏𝑜𝑛𝑑+ 𝐸𝑜𝑣𝑒𝑟+ 𝐸𝑣𝑎𝑙+ 𝐸𝑡𝑜𝑟𝑠+ 𝐸𝑣𝑑𝑊𝑎𝑙𝑙𝑠+ 𝐸𝐶𝑜𝑢𝑙𝑜𝑚𝑏 (2) 162
163
Interfaces between the globules 164
Jennings’s Colloidal model (2008) sheds light on simulating the mesoscale 165
mechanical properties of C-S-H by using granular mechanics, i.e., discrete element 166
method is used to simulate the meso system of C-S-H, the interfacial properties 168
between the unit globules should be known as a prior. To investigate the normal and 169
shear strengths at the interfaces in different directions, two supercells of Model IV are 170
connected to each other along (100), (010) and (001) planes. Five different 171
thicknesses of water layers are added in the interface to investigate the effect of water 172
content on the interfacial properties, 0.0, 0.5, 1.0, 1.5, 2.0 Å, respectively. The density 173
for water is 1 g/cm3 and the Water/Si ratio for each model is 0.66, 0.86, 1.04, 1.25 and 174
1.37, respectively. The simulation box is relaxed for 50 ps in the isobaric-isothermal 175
ensemble (NPT) and coupled to zero external pressure in the x, y, z dimensions. After 176
that, the boundaries are changed to non-periodic and shrink-wrapped in three 177
dimensions for the shear test and the microcanonical ensemble (NVE) is employed. 178
During each shear test, the bottom atoms are fixed and the top atoms are loaded to 179
move along the interface with a constant loading rate at 0.08 Å/ps. During each 180
tensile test, the bottom is fixed and the top is moved vertically to the interface with a 181
constant loading rate of 0.08 Å/ps. 182
3. RESULTS AND DISCUSSION
183
3.1 Mechanical properties for C-S-H globules
184
The complete tensile test simulations for the C-S-H globules along y- and z- 185
directions (along silicate chains and normal to silicate chains respectively) are shown 186
in Figure 2. In addition, the direct tensile stress-strain relationships obtained are 187
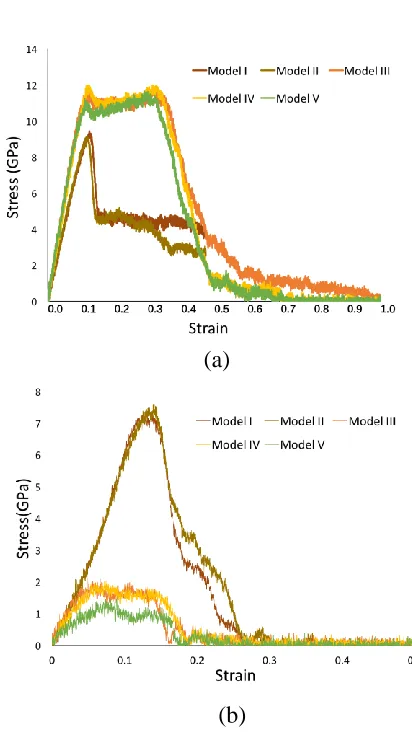
shown in Figure 3. In y-direction, all the five structures present linear increases in the 188
initial elastic stage while Model I and II have slightly lower elastic modulus than the 189
other three structures. Model I and II have very close tensile stress-strain relationship 190
which has the maximum stress about 9 GPa at the strain of 0.11. These two structures 191
are very brittle, since following the maximum value, the stress suddenly reduces to 192
4.5 GPa and keeps constant for the next 0.2 straining. It then gradually decreases until 193
trend and increase up to about 11 GPa. Different from Model I and II, these three 195
structures undergo a clear ductile development before they gradually decrease. Such a 196
ductile stage in the mechanical behavior is caused by the longer mean length of the 197
silica chains, which provide higher force carrying capability during tensile test along 198
the y-direction. Moreover, it is interesting to find that the Model V (i.e., IGP structure) 199
has some minor strength decrease at y-direction, compared with Models 3 and 4. This 200
means the intralayer pores can slightly affect the mechanical properties in the silicate 201
chain length direction. It makes sense as the y-direction mechanism is mainly 202
provided by the silicate chains which are not significantly affected by these pores. In 203
z-direction which is the direction vertical to the silica chain, Models I and II have 204
much higher strengths compared with Models III, IV and V. The stress-strain curves 205
for Models I and II in z-direction are close to those in y-direction except for the 206
softening pattern. However, the C-S-H structures of Models III – V have much lower 207
strengths in z-direction in comparison with those in y-direction. This is because the 208
interlayer Calcium and water interface in Models III – V provide a weaker connection 209
compared to Model I and II, where the Calcium atom is in octahedral coordination 210
with oxygen atoms resulting in much stronger interactions. Compared to Models III 211
and IV, Model V (IGP structure) has much lower strength, i.e, 1.15GPa, while the 212
Model III and IV go up to 1.9 GPa. It demonstrates that the existence of IGP can 213
significantly reduce the strength of the C-S-H globules in the z-direction (i.e., the 214
normal direction to the silicate chains). 215
216
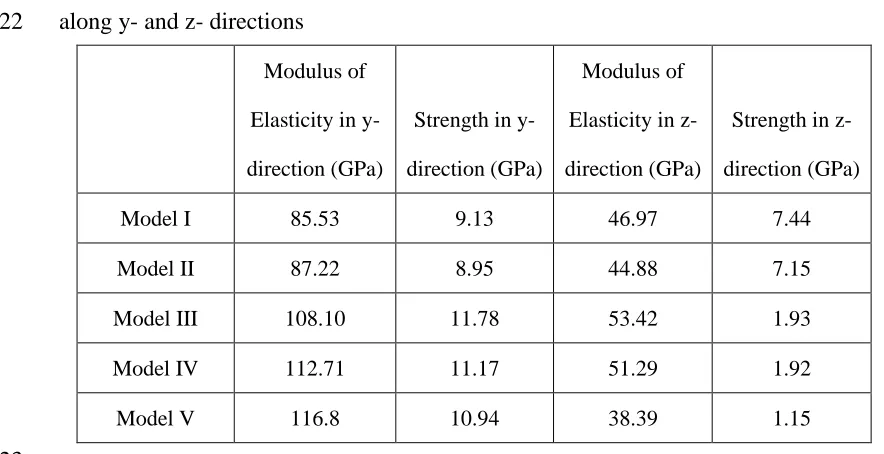
The modulus of Elasticity calculated from the stress-strain curves and the maximum 217
stress of each structure of C-S-H are shown in Table 2. The Young’s modulus of the 218
five structures along z-direction is in the range of 39 GPa to 54 GPa, which is 219
reasonable compared to the experimental data of cements in range of 38 GPa to 56 GPa
220
for wetted cement with low porosity and simulation data of tobermorite-like and 221
jennite-like structures in range of 35 GPa to 56 GPa [37, 38]. The strength of each
structure is also in the reasonable range compared to tobermorite-like structure at about 1.4 GPa
223
along z-direction and 9 GPa along y-direction [28, 39]. The Young’s modulus in y direction 224
increases when the C-S-H gel changes to orthorhombic from monoclinic. By contrast, 225
the strengths in y and z directions and the Young’s modulus in z direction reduce for 226
the orthorhombic structure. The change of crystal system has an impact on the 227
mechanical properties; although the difference is not significantly large, it needs to be 228
rigorous in establishing C-S-H structures. On the other hand, for some large scale 229
molecular system modelling or interfacial properties study, the structure will need to 230
be changed slightly under duplication or packing or fitting in simulation box. 231
Interestingly, Model V shows lower mechanical capacity, especially in z-direction, 232
with 28% and 40% reduction for modulus of Elasticity and strength compared to 233
Model III, respectively. Under loading the existence of IGP will cause rearrangement 234
of Calcium in the interlayer. 235
236
3.2 Mechanical properties for the interfaces between C-S-H globules
237
Figure 4 illustrates Model IV packed with 0 to 2 Å water layer interface on different 238
surfaces of the globules, and the structure with W0, W5, W10, W15, W20 stand for 239
the interface with a water layer of 0.0, 0.5, 1.0, 1.5, 2.0 Å added, respectively. The 240
force exerted on atom i is given by =
𝑟, where 𝐸 is the interaction
241
energy for atom , and is the position of atom i. The total shear force F on the 242
fixed atoms is calculated by = ∑ . The tensile force is considered as being 243
transferred to the interface between two C-S-H globules. The stress at the interface 244
can be calculated as follows: 245
σ = 𝐹𝐴 (3)
246
where F is tensile force at the interface, and A is the force-resisting area. Due to the 247
force-displacement and stress-strain curve is the same and only the stress-strain 249
curves are shown in Figure 5.
250
251
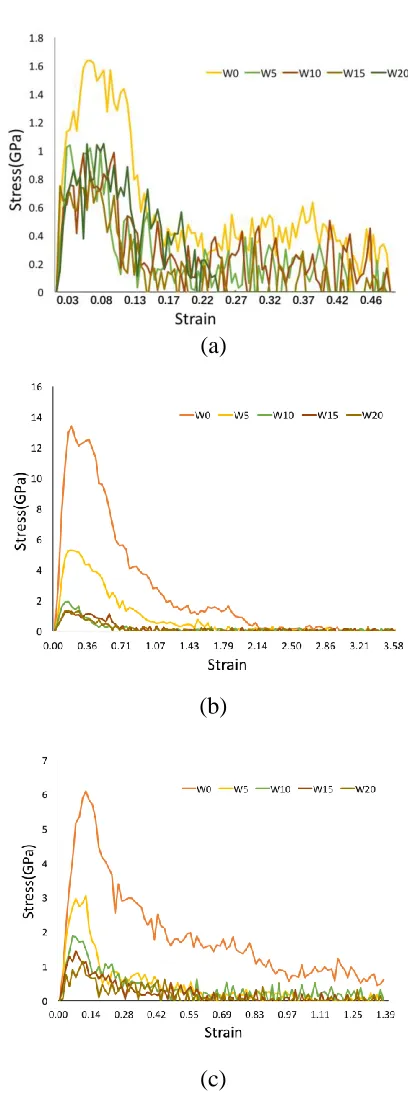
For all three types of interfaces, the interface with no extra water molecules has 252
greatest tensile strength compared to other structures with added water, because of the 253
destructive effect of water on the bond generation between two C-S-H globules. For 254
(001) interface, the stresses of other four structures with different amount of water 255
molecules added present similar properties and there is no significant difference 256
among the maximum value of stress, initial elastic stage and trend of curve. For (010) 257
and (100) interfaces, the slope of initial elastic stage and the maximum value of stress 258
both decrease with the increase of water content. The details of the tensile mechanical 259
properties calculated from Figure 5 are shown in Table 3. 260
261
Young’s modulus is defined by the slope of the initial elastic stage. Compared to the 262
mechanism analysis of C-S-H globules during compressing test, the results in this 263
study cover different Young’s modulus between C-S-H interfaces in range of 10 GPa 264
to 37 GPa in three elastic stage under compression [40]. The fracture energy 𝐹 is 265
determined from the area under the stress-strain curves in Figure 5, multiplied by the 266
initial length of the simulation box. For (001) surface, with water molecules added, 267
the maximum stress, Young’s modulus and fracture energy show no significant 268
difference among different water content. For (010) and (100) surfaces, the maximum 269
stress and Young’s modulus decrease with the increase of water molecules. The 270
minimum values of the fracture energy in three interface types all show in the 271
structure with 2.0 Å and 1.5 Å water layer. It is interesting that the maximum value of 272
stress and Young’s modulus of W0 structure in (010) interface are almost the same as 273
the value of Model III along y-direction in Table 2. This is because Reaxff allows 274
bond breakage and generation so that the interface reconnects as one C-S-H unit 275
and DEM, the results in (001) interface are recommended, because it is the natural 277
cleavage plane which is also the weakest layer in the C-S-H structure [41]. The tensile 278
properties are calculated by the average of four structures with extra water molecules 279
as: σm = ; Young’s modulus = ; 280
Fracture energy = 2. 281
282
The shear properties for the interfaces of C-S-H globules with different water content 283
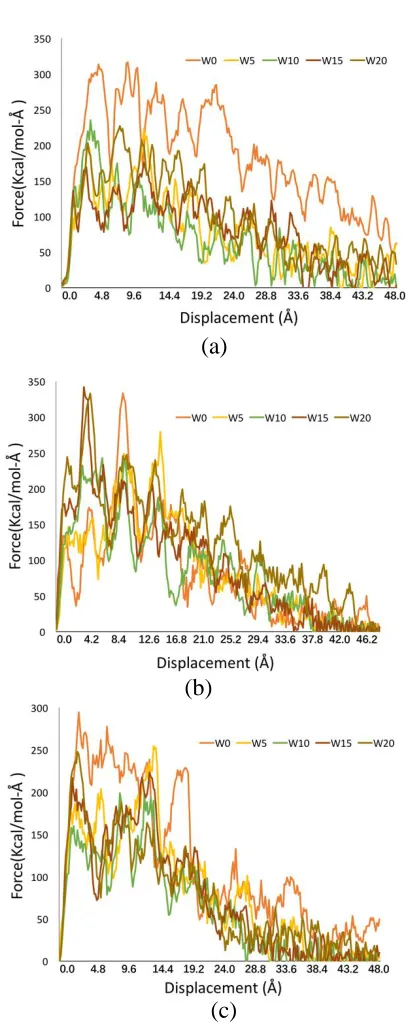
are also simulated and the shear force – displacement curves are shown in Figure 6. 284
The shear force is directly related to the interfacial stress transfer and can be used 285
as the basis to derive the interfacial shear strength of the globule interfaces. Figures 286
6(a)-(c) show the relation between the shear force along moving direction F and the 287
shear displacement for different thickness of water layers for the three types of 288
interfaces. For 001 surface, all the five curves start to increase linearly. The maximum 289
force is achieved for the water layer 0 Å, which is 313.4 kcalmol-1Å-1 at 5.4 Å shear 290
displacement. After the maximum value of each curve, the shear force along x 291
direction gradually decreases with fluctuation. It can be found that the effect of water 292
layer is significant for 001 surface since the overall shear force of 0 Å water layer is 293
much higher than that of the other four interfaces. This indicates that the water 294
molecules interdict the intralayer Calcium-Oxygen bonding between the globules. 295
The shear force fluctuates over the displacement which is normal for molecular 296
dynamics simulation. 297
298
According to Amonton’s law of adhesion [42], the friction force F is divided into two 299
parts: = + , the external normal force L multiplied by the friction 300
coefficient μ and the internal force impacted by the adhesion between the surface. 301
In this study, continuously decreases due to the reduction of the contact surface in 302
the globules interface; the internal force should initially increase because of bond 303
the generation and breakage of bonds in the interface both happen. The shear force– 305
displacement generally follows Amonton’s law for individual curves. The simulation 306
of the interfacial shearing clearly shows both the chemical interaction (i.e. bonding) 307
and the physical interaction occurring at the interface between two globules for three 308
surfaces, as shown in Figure 4. The shear stress τ can be determined as follows: 309
τ = 𝐴 𝐹
𝐶𝑆𝐻−𝐶𝑆𝐻=
𝐹
𝑎0 × (𝑏0 − ∆𝑏) (4)
310
where ACSH-CSH is the contact area between two C-S-H globules in the interface, a0 is
311
the length of C-S-H vertical to the shear direction, b0 is the width of C-S-H along the
312
shear direction and Δb is the shear distance of the moving C-S-H globule. For (001) 313
surface, = , = for (010) surface, = , = 314
, and for (100) surface, = , = , respectively. By 315
using Eq. (4) and the values of a0 and b0 above, the shear stress can be calculated as a 316
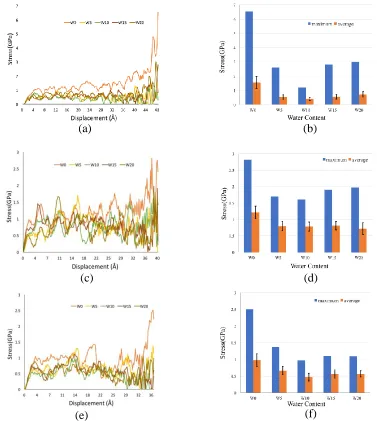
function of the displacement for each surface. Figures 7 (a), (c) and (e) show the 317
relationship between the shear stress and displacement and Figures 7 (b) (d) and (f) 318
present the maximum shear stress, average shear stress and error bars. The average 319
stress is calculated after the first peak stress. In the shear stress-strain curves for all 320
three interfaces, stresses all increase first and then fluctuate over certain values. Such 321
a shearing mechanism of the interfaces can be simplified to a linear increase, followed 322
by a constant development over the strain; or it may be called bi-linear stress-strain 323
curves which can be easily implemented in FEM or DEM modelling. This 324
yielding-like shearing behaviour after its peak stress is not commonly seen in 325
macroscale shear stress development in cementitious materials, where the shear stress 326
usually drops after its strength. It can be found out that the shear strength, i.e., the 327
maximum shear stress, for any type of interfaces of the C-S-H globules, has the 328
highest value when no water layer exists. When water molecules are presented at the 329
interfaces, however, the strength is reduced. Another interesting finding is the content 330
of water molecules is not a very sensitive parameter. For example, the average 331
in Figures 7 (b), (d) and (f). The interfacial shear strength of C-S-H globules interface 333
is then calculated by the average value of the stress for (001) surface with 0.5 Å, 1.0 334
Å, 1.5 Å and 2.0 Å water layer thickness to be about 560.29 ± 135.44 MPa; for (010) 335
surface is about 780.63 ± 39.51 MPa; and for (100) surface, the shear strength is 336
about 564.53 ± 78.33 MPa. 337
338
The shear stress-displacement curves, often known as bond-slip relation, for the 339
C-S-H globule interfaces and the mechanical properties for C-S-H globules are 340
derived for C-S-H. These properties have been hardly seen in existing literature. It has 341
significant impact on multi-scale modeling (either FEM or DEM) in terms of 342
providing necessary inputs for the nanoscale C-S-H structures. These properties are 343
usually not available due to difficulties in conducting experiments. This is why trial 344
and error analysis is always applied for estimating the mechanical properties. The 345
mechanical properties derived in this paper can well be used for defining the 346
bond-slip behavior between the unit C-S-H globules as well as the constitutive 347
relation for the globule itself. 348
4. CONCLUSIONS
349
In this paper, the C-S-H globules and the interfaces between the C-S-H globules have 350
been modeled at the atomic scale and the complete mechanism has been studied 351
through MD simulations. Reaxff was used to provide the interactive potentials for the 352
whole molecular system. Key material parameters, e.g., Young’s modulus, strength 353
and fracture energy, were determined for the globules and interfaces. It has been 354
found that the atomic structure significantly affects the mechanical performance of the 355
C-S-H structures. Longer mean chain lengths (i.e., Models III - V) tend to increase the 356
strength of C-S-H and, more importantly, change the fracture behavior from brittle 357
failure to ductile failure, along the silicate chains direction. In the direction normal to 358
structure matters. Octahedral coordination of Calcium with oxygen atoms will result 360
in stronger interactions and higher mechanical strengths in the normal direction. 361
Moreover, pores (i.e., IGP) in the C-S-H globules can considerably reduce the 362
strength of the globule structures in normal to silicate chain direction but the 363
weakening effect becomes less significant in silicate chain direction. Further, the 364
effects of water content at the interfaces between globules were investigated and the 365
normal strength and the shear strength for the interfaces were determined. It has been 366
found that, for all types of the interfaces, the interface with no extra water molecules 367
has greatest tensile/shear strength, because of the destructive effect of water on the 368
bond generation between two C-S-H globules. However, it is interesting to find the 369
strength is not very sensitive to the amount of water since different water content at 370
the interfaces resulted in roughly similar mechanical performance. It can be 371
concluded that the mechanical properties obtained in this paper for C-S-H 372
nanostructures and interfaces are highly complementary to the meso-scale modelling 373
of C-S-H via granular mechanics, i.e., DEM, or continuum mechanics, i.e., FEM. 374
375 376
ACKNOWLEDGMENTS
377
Partial financial support from the European Commission Horizon 2020 Marie 378
Sklodowska-Curie Research and Innovation Staff Exchange scheme through the grant 379
REFERENCES
381
[1] K. Sobhan and M. Mashnad, "Tensile strength and toughness of soil–cement– 382
fly-ash composite reinforced with recycled high-density polyethylene strips," 383
Journal of Materials in Civil Engineering, vol. 14, no. 2, pp. 177-184, 2002. 384
[2] M. Ali, A. Majumdar, and D. Rayment, "Carbon fibre reinforcement of 385
cement," Cement and Concrete Research, vol. 2, no. 2, pp. 201-212, 1972. 386
[3] W. Sonphuak and N. Rojanarowan, "Strength improvement of fibre cement 387
product," International Journal of Industrial Engineering Computations, vol. 388
4, no. 4, pp. 505-516, 2013. 389
[4] J. Claramunt, M. Ardanuy, J. A. García-Hortal, and R. D. Tolêdo Filho, "The 390
hornification of vegetable fibers to improve the durability of cement mortar 391
composites," Cement and Concrete Composites, vol. 33, no. 5, pp. 586-595, 392
2011. 393
[5] S. Leonard and A. Bentur, "Improvement of the durability of glass fiber 394
reinforced cement using blended cement matrix," Cement and concrete 395
research, vol. 14, no. 5, pp. 717-728, 1984. 396
[6] O. Bernard, F.-J. Ulm, and E. Lemarchand, "A multiscale 397
micromechanics-hydration model for the early-age elastic properties of 398
cement-based materials," Cement and Concrete Research, vol. 33, no. 9, pp. 399
1293-1309, 2003. 400
[7] L. Feng and M. Christian, "Micromechanics model for the effective elastic 401
properties of hardened cement pastes," Acta Materiae Compositae Sinica, vol. 402
24, no. 2, pp. 184-189, 2007. 403
[8] C.-J. Haecker et al., "Modeling the linear elastic properties of Portland cement 404
paste," Cement and Concrete Research, vol. 35, no. 10, pp. 1948-1960, 2005. 405
[9] F.-J. Ulm, G. Constantinides, and F. Heukamp, "Is concrete a poromechanics 406
materials?—A multiscale investigation of poroelastic properties," Materials 407
and structures, vol. 37, no. 1, pp. 43-58, 2004. 408
[10] W. Wu, A. Al-Ostaz, A. H.-D. Cheng, and C. R. Song, "Concrete as a 409
hierarchical structural composite material," International Journal for 410
Multiscale Computational Engineering, vol. 8, no. 6, 2010. 411
[11] H. F. Taylor, "Proposed structure for calcium silicate hydrate gel," Journal of 412
the American Ceramic Society, vol. 69, no. 6, pp. 464-467, 1986. 413
[12] J. M. Makar and G. W. Chan, "Growth of Cement Hydration Products on 414
Single‐Walled Carbon Nanotubes," Journal of the American Ceramic Society, 415
vol. 92, no. 6, pp. 1303-1310, 2009. 416
[13] I. Richardson and G. Groves, "Models for the composition and structure of 417
calcium silicate hydrate (C S H) gel in hardened tricalcium silicate 418
[14] I. Richardson, "Tobermorite/jennite-and tobermorite/calcium hydroxide-based 420
models for the structure of CSH: applicability to hardened pastes of tricalcium 421
silicate, β-dicalcium silicate, Portland cement, and blends of Portland cement 422
with blast-furnace slag, metakaolin, or silica fume," Cement and Concrete 423
Research, vol. 34, no. 9, pp. 1733-1777, 2004. 424
[15] J. Moon, S. Yoon, and P. J. Monteiro, "Mechanical properties of jennite: A 425
theoretical and experimental study," Cement and Concrete Research, vol. 71, 426
pp. 106-114, 2015. 427
[16] S. Hamid, "The crystal structure of the 11 Ä natural tobermorite Ca2. 25 428
[Si3O7. 5 (OH) 1.5]· 1H2O," Zeitschrift für Kristallographie-Crystalline 429
Materials, vol. 154, no. 1-4, pp. 189-198, 1981. 430
[17] P. Rejmak, J. S. Dolado, M. J. Stott, and A. s. Ayuela, "29Si NMR in cement: 431
a theoretical study on calcium silicate hydrates," The Journal of Physical 432
Chemistry C, vol. 116, no. 17, pp. 9755-9761, 2012. 433
[18] R. P. Selvam, V. J. Subramani, S. Murray, and K. D. Hall, "Potential 434
application of nanotechnology on cement based materials," 2009. 435
[19] H. F. Taylor, Cement chemistry. Thomas Telford, 1997. 436
[20] R. J.-M. Pellenq et al., "A realistic molecular model of cement hydrates," 437
Proceedings of the National Academy of Sciences, vol. 106, no. 38, pp. 438
16102-16107, 2009. 439
[21] A. J. Allen, J. J. Thomas, and H. M. Jennings, "Composition and density of 440
nanoscale calcium–silicate–hydrate in cement," Nature materials, vol. 6, no. 4, 441
pp. 311-316, 2007. 442
[22] I. G. Richardson, "Model structures for C-(A)-SH (I)," Acta Crystallographica 443
Section B: Structural Science, Crystal Engineering and Materials, vol. 70, no. 444
6, pp. 903-923, 2014. 445
[23] A. Al-Ostaz, W. Wu, A.-D. Cheng, and C. Song, "A molecular dynamics and 446
microporomechanics study on the mechanical properties of major constituents 447
of hydrated cement," Composites Part B: Engineering, vol. 41, no. 7, pp. 448
543-549, 2010. 449
[24] D. Hou, Y. Zhu, Y. Lu, and Z. Li, "Mechanical properties of calcium silicate 450
hydrate (C–S–H) at nano-scale: a molecular dynamics study," Materials 451
Chemistry and Physics, vol. 146, no. 3, pp. 503-511, 2014. 452
[25] Y. Janik, W. Kurdowski, R. Podsiadly, and J. Samseth, "Fractal structure of 453
CSH and tobermorite phases," ACTA PHYSICA POLONICA SERIES A, vol. 454
100, no. 4, pp. 529-538, 2001. 455
[26] R. T. Cygan, J.-J. Liang, and A. G. Kalinichev, "Molecular models of 456
hydroxide, oxyhydroxide, and clay phases and the development of a general 457
force field," The Journal of Physical Chemistry B, vol. 108, no. 4, pp. 458
[27] D. Hou, T. Zhao, P. Wang, Z. Li, and J. Zhang, "Molecular dynamics study on 460
the mode I fracture of calcium silicate hydrate under tensile loading," 461
Engineering Fracture Mechanics, vol. 131, pp. 557-569, 2014. 462
[28] M. Bauchy, H. Laubie, M. A. Qomi, C. Hoover, F.-J. Ulm, and R.-M. Pellenq, 463
"Fracture toughness of calcium–silicate–hydrate from molecular dynamics 464
simulations," Journal of Non-Crystalline Solids, vol. 419, pp. 58-64, 2015. 465
[29] H. M. Jennings, "A model for the microstructure of calcium silicate hydrate in 466
cement paste," Cement and concrete research, vol. 30, no. 1, pp. 101-116, 467
2000. 468
[30] H. M. Jennings, "Refinements to colloid model of CSH in cement: CM-II," 469
Cement and Concrete Research, vol. 38, no. 3, pp. 275-289, 2008. 470
[31] R. Feldman and P. Sereda, "A new model for hydrated Portland cement and its 471
practical implications," Engineering Journal, vol. 53, no. 8-9, pp. 53-59, 1970. 472
[32] S. Merlino, E. Bonaccorsi, and T. Armbruster, "The real structures of 473
clinotobermorite and tobermorite 9 Å: OD character, polytypes, and structural 474
relationships," European Journal of Mineralogy, pp. 411-429, 2000. 475
[33] S. Plimpton, "Fast parallel algorithms for short-range molecular dynamics," 476
Journal of computational physics, vol. 117, no. 1, pp. 1-19, 1995. 477
[34] H. Manzano, S. Moeini, F. Marinelli, A. C. Van Duin, F.-J. Ulm, and R. J.-M. 478
Pellenq, "Confined water dissociation in microporous defective silicates: 479
mechanism, dipole distribution, and impact on substrate properties," Journal 480
of the American Chemical Society, vol. 134, no. 4, pp. 2208-2215, 2012. 481
[35] D. Hou, Z. Li, and T. Zhao, "Reactive force field simulation on 482
polymerization and hydrolytic reactions in calcium aluminate silicate hydrate 483
(C–A–S–H) gel: structure, dynamics and mechanical properties," RSC 484
Advances, vol. 5, no. 1, pp. 448-461, 2015. 485
[36] K. D. Nielson, A. C. van Duin, J. Oxgaard, W.-Q. Deng, and W. A. Goddard, 486
"Development of the ReaxFF reactive force field for describing transition 487
metal catalyzed reactions, with application to the initial stages of the catalytic 488
formation of carbon nanotubes," The Journal of Physical Chemistry A, vol. 489
109, no. 3, pp. 493-499, 2005. 490
[37] R. F. Feldman, "Factors affecting Young's modulus—porosity relation of 491
hydrated Portland cement compacts," Cement and Concrete Research, vol. 2, 492
no. 4, pp. 375-386, 1972. 493
[38] H. Manzano, J. Dolado, and A. Ayuela, "Elastic properties of the main species 494
present in Portland cement pastes," Acta Materialia, vol. 57, no. 5, pp. 495
1666-1674, 2009. 496
[39] D. Hou, H. Ma, Y. Zhu, and Z. Li, "Calcium silicate hydrate from dry to 497
saturated state: structure, dynamics and mechanical properties," Acta 498
[40] H. Suzuki, S. Bae, and M. Kanematsu, "Nanostructural deformation analysis 500
of calcium silicate hydrate in portland cement paste by atomic pair distribution 501
function," Advances in Materials Science and Engineering, vol. 2016, 2016. 502
[41] H. Manzano, A. K. Mohamed, R. K. Mishra, and P. Bowen, "A discussion on 503
the paper ―Role of porosity on the stiffness and stability of (001) surface of the 504
nanogranular C–S–H gel‖," Cement and Concrete Research, vol. 102, pp. 505
227-230, 2017. 506
[42] J. Gao, W. Luedtke, D. Gourdon, M. Ruths, J. Israelachvili, and U. Landman, 507
"Frictional forces and Amontons' law: from the molecular to the macroscopic 508
scale," ed: ACS Publications, 2004. 509
510
List of Tables
512 513
1. The characteristics of five models used for simulation 514
2. Simulated results for the mechanical properties of C-S-H nanostructures along y- 515
and z- directions 516
3. Simulated results for the mechanical properties of the C-S-H interfaces along x-, 517
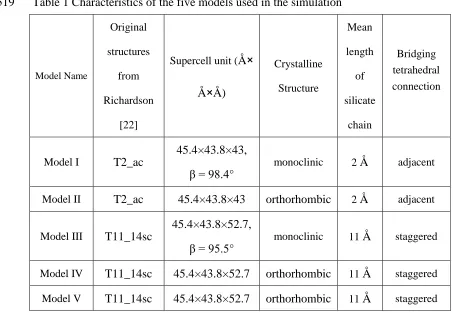
Table 1 Characteristics of the five models used in the simulation 519
Model Name
Original
structures
from
Richardson
[22]
Supercell unit (Å×
Å×Å)
Crystalline
Structure
Mean
length
of
silicate
chain
Bridging
tetrahedral connection
Model I T2_ac
45.4×43.8×43,
β = 98.4° monoclinic 2 Å adjacent
Model II T2_ac 45.4×43.8×43 orthorhombic 2 Å adjacent
Model III T11_14sc
45.4×43.8×52.7,
β = 95.5° monoclinic 11 Å staggered
Model IV T11_14sc 45.4×43.8×52.7 orthorhombic 11 Å staggered
Model V T11_14sc 45.4×43.8×52.7 orthorhombic 11 Å staggered
Table 2 Simulated results for the mechanical properties of C-S-H nanostructures 521
along y- and z- directions 522
Modulus of
Elasticity in y-
direction (GPa)
Strength in y-
direction (GPa)
Modulus of
Elasticity in z-
direction (GPa)
Strength in z-
direction (GPa)
Model I 85.53 9.13 46.97 7.44
Model II 87.22 8.95 44.88 7.15
Model III 108.10 11.78 53.42 1.93
Model IV 112.71 11.17 51.29 1.92
Model V 116.8 10.94 38.39 1.15
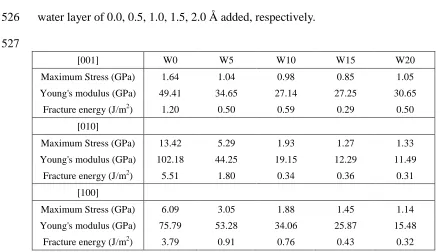
[image:21.595.61.503.99.326.2]Table 3 Simulated results for the mechanical properties of the C-S-H interfaces along 524
x-, y- and z- directions, and W0, W5, W10, W15, W20 stand for the interface with a 525
water layer of 0.0, 0.5, 1.0, 1.5, 2.0 Å added, respectively. 526
527
[001] W0 W5 W10 W15 W20
Maximum Stress (GPa) 1.64 1.04 0.98 0.85 1.05
Young's modulus (GPa) 49.41 34.65 27.14 27.25 30.65
Fracture energy (J/m2) 1.20 0.50 0.59 0.29 0.50
[010]
Maximum Stress (GPa) 13.42 5.29 1.93 1.27 1.33
Young's modulus (GPa) 102.18 44.25 19.15 12.29 11.49
Fracture energy (J/m2) 5.51 1.80 0.34 0.36 0.31
[100]
Maximum Stress (GPa) 6.09 3.05 1.88 1.45 1.14
Young's modulus (GPa) 75.79 53.28 34.06 25.87 15.48
Fracture energy (J/m2) 3.79 0.91 0.76 0.43 0.32
List of Figures
529 530
1. Molecular structures of C-S-H globules 531
2. Tensile test simulation of Model I and Model III along z- and y- Directions 532
3. Stress-strain curves for five different C-S-H structrues along (a) y-direction (b) 533
z-direction 534
4. Molecular strctures of C-S-H interface 535
5. Tensile stress-strain curve for different water content in different interfaces 536
6. Shear force-displacement curve for different water content in different interfaces 537
7. Stress-displacement curve for different water content in the interface and 538
maximum value and average value of stress for each curve in the interface. 539
540
541
543
544 545
(d)
(c)
(a) (b)
[image:24.595.139.472.101.356.2](e)
Figure 1 Molecular structures of (a) Model I, (010) surface of T2_ac in monoclinic structure (b)
Model II, (010) surface of T2_ac in orthorhombic structure (c) Model II, (010) surface of
T11_14sc in monoclinic structure (d) Model IV, (010) surface of T11_14sc in orthorhombic
structure (e) Model V, (010) surface of T11_14sc with IGP in orthorhombic structure. Green
atoms are Calcium, cantaloupe atoms are Silicon, red atoms are Oxygen and white atoms are
546 547
(d)
(c)
(a)
(b)
(e)
(i)
(h)
(f)
(g)
(j)
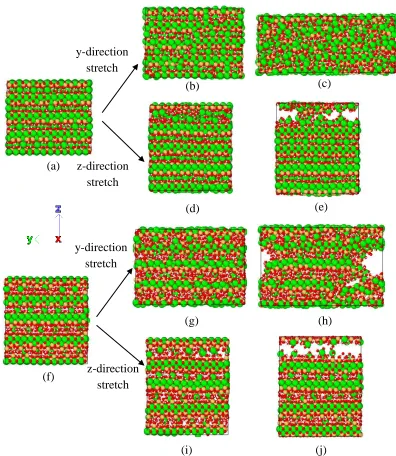
Figure 2 Tensile test simulation of Model I and Model III along z- and y- Directions. (a)
Model I after equilibrium. (b) After the maximum value of the stress for Model I along
y-direction. (c) The failure happens in Model I along y-direction. (d) After the maximum
value of the stress for Model I along z-direction. (e) The failure happens in Model I along
z-direction. (f) Model III after equilibrium. (g) Model III after the maximum value of the
stress along y-direction. (h) The failure happens in Model I along y-direction, (i) After the
maximum value of the stress for Model I in z-direction. (j) The failure happens in Model I
along z-direction.
y-direction stretch
y-direction stretch z-direction
stretch
[image:25.595.102.498.97.553.2]548
[image:26.595.99.305.72.439.2]549
Figure 3 Stress-strain curves for five different C-S-H structrues along (a) y-direction (b)
z-direction
(a)
550
551
(a) (b)
(c) (d)
(e) (f)
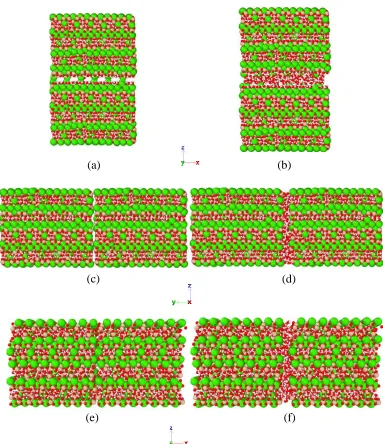
Figure 4 Molecular structure of (a) (001) surface with 0 Å water layer (b) (001) surface
[image:27.595.115.498.86.530.2]552
[image:28.595.90.294.77.631.2]553
Figure 5 Tensile stress-strain curve for different water content in (a) (001) interface (b) (010) interface (c) (100) interface. W0, W5, W10, W15, W20 stand for the interface with a water layer of 0.0, 0.5, 1.0, 1.5, 2.0 Å added, respectively.
(a)
(b)
554
555
(a)
(b)
[image:29.595.90.295.79.594.2](c)
556 557
Figure 7 Stress-displacement curve for different water content in (a) (001) interface (c) (010) interface (e) (100) interface. Maximum value and average value of stress for each curve in (b) (001) interface (d) (010) interface (f) (100) interface.
(c) (d)
(e) (f)