https://doi.org/10.1007/s40735-018-0165-9
Some Thoughts on Mapping Tribological Issues of Wind Turbine Blades
Due to Effects of Onshore and Offshore Raindrop Erosion
Kieran Pugh1 · Ghulam Rasool1 · Margaret M. Stack1
Received: 25 April 2018 / Revised: 19 June 2018 / Accepted: 10 July 2018 © The Author(s) 2018
Abstract
This paper represents the investigation of liquid impacts on wind turbine blade materials in the simulation of onshore and offshore environmental conditions. G 10 epoxy glass laminate was used as a specimen material. The experimental work was carried out on a raindrop erosion test rig at the varying angles of attack for a range tip speed. Two solutions, i.e. pure and salt water, were used to highlight the effects of offshore environment on this material when it is being used as wind turbine blades. Test results show that the erosive wear increased with an increase in droplet impact velocity. Erosion mapping tech-niques were used to compare the erosive wear behaviour of this material for application to onshore and offshore applications as candidate wind turbine materials.
Keywords Wind energy · Erosion · Droplet impact · Wear map
1 Introduction
The technology behind wind power is not a new concept; people have been capturing and taking advantage of wind power over the centuries. Nowadays the need for renewable energy such as wind power is crucial. The main challenge is to increase the reliability and availability of wind turbine to get maximum energy from this resource at a comparatively reduced cost. The unpredictable extreme weather conditions and location effects have increased the failure rate of the onshore and offshore wind turbines. As a result, components repair cost and reliability of wind turbines are increasingly of research interest.
After the European Union agreed on a framework for the climate and energy production, the cost of energy from the wind turbine has gained much importance [1]. The wind turbine location environments and weather conditions have a significant impact on the operation and maintenance pro-cess, which are directly linked to energy production cost, performance, efficiency and life of the device. With the pro-gress of onshore and offshore wind energy industry, different
approaches have been being exercised to control the energy cost and increase the reliability of the wind turbines. Current wind turbines are very expensive to instal and to keep them running especially in the offshore locations. By appropri-ate research on mappropri-aterials, location, environment, etc., of the wind turbine the reliability, availability and energy produc-tion cost can be reduced.
The wind turbine rotor blade is an important compo-nent of this device. It converts wind energy into mechani-cal energy to rotate the electric generator. There are several material-related problems with the wind turbine blades including an important one, i.e. leading edge erosion. Ero-sion is a wear phenomenon of a wind turbine blade which results in mass loss and surface damages exposed to rain-drops in this case. The increasing advances in wind energy technology, associated with the changeable operational envi-ronment, significantly increase erosion effects on the leading edge of the turbine blades. Researchers have investigated the different environmental degradation effects, with spe-cial emphasis on raindrop and the hailstone impact of the wind turbine blade leading edge. The leading edge erosion of the rotor blade is a major issue of the wind turbine and it can be a very serious issue even after 2 years of turbine operation, which is much earlier than the expected time [2]. Leading edge erosion leads to an increase in drag on the blades. The literature shows that for mild erosion, there is around 6% increase in drag, while for the severe there could
* Ghulam Rasool
be an increase up to 500% drag. This is equal to 25% loss in energy annually [3]. It is concluded by Gaudern et al. that the lift reduces and the drag increases at the high level of leading edge erosion, which is common for the wind turbine rotor blades [4].
Moreover, in the offshore environment, wind turbines run in the most critical operating conditions. There are many environment-related factors, such as rain impingement, the high velocity of wind and sea spray, which influence the performance of the rotor blade’s leading edge in respect of erosion and impact [5]. The high saline offshore atmosphere leads to corrosion issues as well. The repair of a damaged wind turbine rotor blade is the most expensive and time-consuming task. Three rotor blades share 20–30% of the total investment of a wind turbine depending upon the instal-lation of the wind turbine, i.e. onshore or offshore [6, 7]. The literature also shows that the blade and tower damages are the most common structural source damage in the offshore environment, which is found on wind turbines [8].
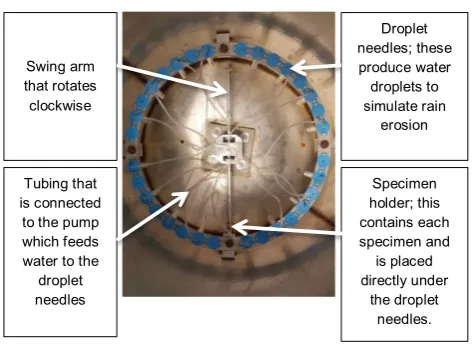
Despite wind being an advanced renewable technology, there are still rotor blade material-related issues with the wind turbine. Due to its good mechanical strength and eco-nomics of materials selection and reasonable price, poly-meric matrix fibre-reinforced composites are being used as rotor blade materials still facing tribological challenges such as leading edge erosion. Leading edge erosion of wind turbine blades is an important issue as it can have effects on power output due to increased drag [9]. This research work involves the testing and researching of different advanced materials suitable for the use in onshore and offshore renew-able energy devices. Experimental work was carried on G10 epoxy glass laminate in onshore and offshore simulated laboratory conditions of the wind turbine blade application. Pure water was used to replicate the onshore rain, while salt water was used to replicate the rain in the offshore environ-ment. A swing arm rig was used for this experimental work (Fig. 1). Different tip speeds and impact angles were used as variables in this research work to investigate the effects of rain at different speeds on the blades. Test results show an overall increase in specimen mass in both solutions for the range of testing tip speed, while more exposed surface damage occurred in the salt solution. Both, the mass gain and surface damages adversely affect the performance of the wind turbine.
2 Experimental
2.1 Test Conditions
The variables for this investigation are impact velocity and impact angle for the investigation erosion behaviour of the wind turbine blades in onshore and offshore environments
by simulating simple and salt water. The tests were car-ried out for a range of tip speed, i.e. 20–60 m s−1 in an increment 10 m s−1 and impact angle from 15° to 90° in an increment of 15°. This selection was made to research different parameters subject to a wind turbine in operation. The impact velocity was chosen as it will give an indica-tion on where along the wind turbine the most erosion occurs and also shows a comparison on various types of wind turbines that rotate at different speeds. The impact angle was chosen to determine where on the blades profile that the most erosion occurs [10, 11]. The salinity of salt solution was kept constant at 3.5% in water. The droplet size was kept constant by having a consistent droplet nee-dle throughout the experiment (23 G) and a constant flow rate from the peristaltic pump of 0.377 mL s−1. The tests were carried out at room temperature under ambient con-ditions. The test material was G10 epoxy glass laminate, which is widely being used in wind turbine manufacturing. The total circumferential distance was kept constant, i.e. 108 km for all tests in order to accommodate the limita-tion of the test rig maximum possible tip speed, which is 60 m s−1 for 30 min run, duration of a test.
2.2 Materials
G10 epoxy glass laminate composite, manufactured by National Electrical Manufacture Association (NEMA) was used as a specimen. This is thermosetting industrial composite consists of continuous filament glass cloth as reinforcement and epoxy as the resin binder. Generally, G10 has high strength, low water absorption and good corrosion resistance in onshore and offshore environments. The mechanical and physical properties are as mentioned in Table 1.
Droplet needles; these produce water droplets to simulate rain erosion Specimen holder; this contains each specimen and is placed directly under the droplet needles. Swing arm that rotates clockwise Tubing that is connected
to the pump which feeds water to the
droplet needles
[image:2.595.307.544.52.224.2]2.3 Test Apparatus
A raindrop erosion test rig was used for this experimental work (Fig. 1). This rig was constructed at the University of Strathclyde to simulate in the working conditions of a wind turbine in a rainy weather. It consists of swing arms having a sample holder at the end. Arms rote rotates clockwise in this configuration. An impact angle alteration mechanism has been developed to adjust the arm at the required posi-tion. A metallic ring with needle holders is fitted exactly above sample’s rotation path. Sixteen droplet needles (23 G) and plastic tubing are fixed to the rig to simulate raindrops. The droplet needles can be changed to get different drops of different diameters. Specimen holders locate the samples directly under the droplet needles. A peristaltic pump is fit-ted to provide a constant flow of solution to all needles to maintain droplet size. An electric motor rotates the swing arms. The output of the motor is controlled through a fre-quency metre to get the variable tip speeds.
2.4 Test Procedure
The test procedure is summarised as follows:
The GFRP samples cut into size 30 × 32 mm. The sam-ples were labelled then weighed at ambient temperature and humidity before testing. The samples were held in holders and secured properly by tightening two bolts. A separate impact angle was adjusted for each arm. The adequate nee-dle size (23 G) must be installed into the rig. The peristaltic pump supply reservoir was filled and observed continuously. The run time was at least 10 min to ensure pressure equilib-rium in all tubes. A visual inspection is required to check water flow through all the tubes and needles. For safety rea-sons, a visual check must be conducted for any obstructions in the way of the rotating arm. The linear velocity of the arm was selected by adjusting the dial on the motor controller at the required frequency. On completion of each test, samples were weighed again least 24 h after the experiment finishing to correlate with the initial weighing conditions to minimise moisture absorption effects. The post-test SEM and EDX analyses were carried out on the exposed surfaces to inves-tigate the erosion wear behaviour.
3 Test Results
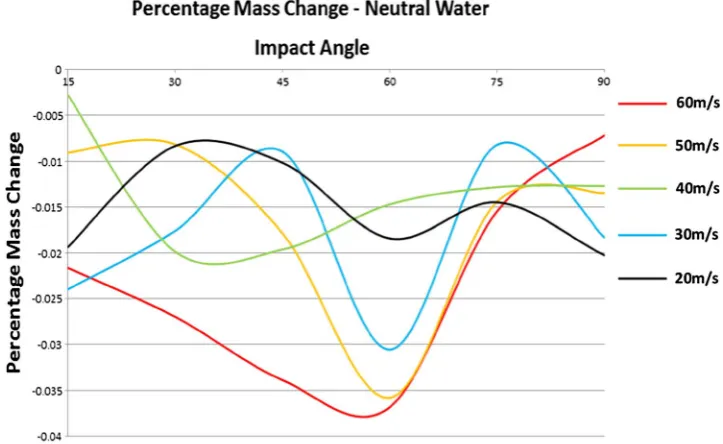
Figures 2 and 3 show the mass change of the specimens in pure water and salt water, respectively. The tests car-ried out in pure water show that the specimen has gained mass for each combination of tip speed and impact angle (Fig. 2). On the other hand, there is different behaviour of mass change in salt water (Fig. 3). For slower tip speeds,
Table 1 Mechanical and physical properties of G10 epoxy glass lami-nate
Flexural strength (MPa) 482
Tensile strength (MPa) 320
Shear strength (MPa) 131
Chary impact strength (kJ m−2) 65
Density (g cm−3) 2
Specific gravity 1.82
Water absorption (mg m−2) 8
Hardness, Rockwell (m-scale) 110
Body colour Green
Standard finish Stin/glossy
[image:3.595.51.290.81.211.2] [image:3.595.183.545.494.716.2]there is a mass loss, while at higher tip speeds there is more mass gain as compared to that observed in pure water.
Figure 4 shows the SEM of the exposed surface of a spec-imen in salt water at 60 m s−1 tip speed and 75° impact angle showing significant degradation. Table 2 shows the results of an EDX analysis on the exposed surface of a specimen in salt
water at 60 m s−1 tip speed and 75° impact angle, indicating the deposits of salt on the surface.
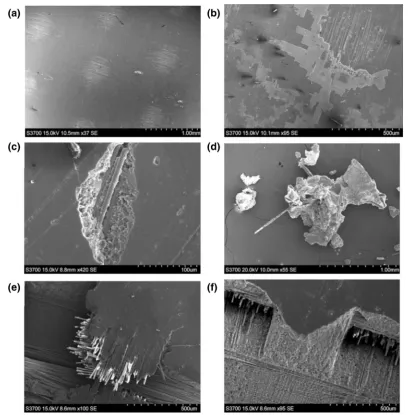
Fig. 5 shows SEM images of the exposed surfaces in sim-ple water and salt water at different tip speeds and impact angles of a: (a) control specimen that did not undergo any testing, (b) specimen that was subjected to exposure to 3.5% salt water at a tip speed 40 m s−1 and impact 75°, (c)
Fig. 3 Percentage mass change results from the salt water testing
Fig. 4 SEM of eroded specimen subject to 3.5% salt water at 60 m s−1 and 75°
Table 2 An EDX analysis on an eroded specimen subject to 3.5% salt water at 60 m s−1 and 75°
Spectrum In stats. C O Na Mg Al Si Cl Ca Total
Spectrum 1 Yes 27.30 37.13 4.32 17.57 13.69 100.00
Spectrum 2 Yes 64.23 19.38 0.66 0.77 1.31 6.79 1.09 5.77 100.00
Spectrum 3 Yes 55.20 28.55 2.32 4.58 9.36 100.00
Max. 64.23 37.19 0.66 2.32 4.32 17.57 1.09 13.69
[image:4.595.174.546.154.727.2] [image:4.595.182.547.160.390.2]specimen that was subject to neutral water at 40 m s−1 and 60°, (d) piece of debris that was collected from the bottom of the tank after a test was carried out in salt water and (e) specimen that was subject to 3.5% salt water at 60 m s−1 at 30°. There were very marked differences in the morpho-logical features at the various velocities and impact angles. These are discussed further below.
4 Discussion
Fibre-reinforced polymer matrix composites are favoured for the manufacturing of wind turbine blades because of their good mechanical- and corrosion-resistant properties. Despite
this, these composites have poor tribological resistance due to the material class, i.e. anisotropic material, i.e. modulus of elasticity changes in different directions. Raindrop erosion tests on G10 epoxy glass laminate in onshore and offshore laboratory-simulated conditions of wind turbine blades have highlighted erosion issues with this composite material. Test results show that raindrop impact has affected this material under both environments, i.e. in onshore as well as in off-shore conditions (Figs. 2 and 3).
In pure water, the specimens have gained mass for each combination of raindrop impact velocity and angle of attack. However, the composite is showing different erosion behav-iours at various impact velocities for the range of impact angles (Fig. 2). The maximum mass loss was at 60 m s−1
Fig. 5 SEM images of the surfaces of a: a control specimen that did not undergo any testing, b specimen that was subject to 3.5% salt water at 40 m s−1 and 75°, c specimen that was subject to neutral water at 40 m s−1 and 60°, d piece of debris that was collected from
[image:5.595.92.506.54.470.2]at 60° angle of attack with a mass loss of 0.041 g that is equivalent to a 0.04% decrease in mass. The minimum mass loss was at 30 m s−1 at 15° angle of attack with a mass loss of 0.0003 g that is equivalent to a 0.0028% decrease in mass for half an hour of a test run. As shown in Fig. 5c, the trend was somewhat similar, but no surface damage was found in our earlier studies of the tidal turbine blade on this material in pure water [11, 12]. This can be attributed to the higher impact and velocity of the droplets. This partially different erosive behaviour of the fibre-reinforced composite for wind and tidal turbine blade laboratory simulated conditions lead to assume that the devices, test parameters and environments play an important role in the performance of materials as well.
On the other hand, in salt water, specimens have shown different mechanisms of erosion than those exposed to pure water (Fig. 3). For the lower impact velocities, there is a mass loss from all angles of attack, while at higher velocities, specimens gained mass for the range of impact angles. The maximum mass loss was at 30 m s−1 at 15° angle of attack with a mass loss of 0.008 g that is equivalent to a 0.007% decrease in mass. Maximum mass
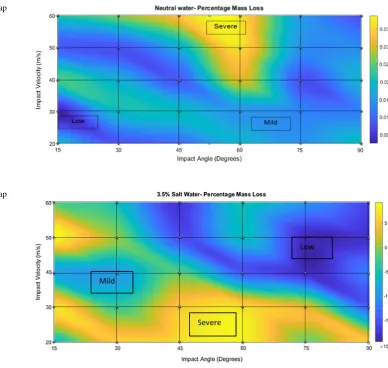
gain was at 50 m s−1 at 75° angle of attack with a mass gain of 0.019 g that is equivalent to a 0.019% increase in mass. On both maps, shown in Figs. 6 and 7, the green to blue areas show an increase in overall mass and the yel-low areas show a decrease in mass. Moreover, the droplet erosion behaviour varies for each combination of impact velocity and angle of attack. SEM images of the exposed surfaces in salt water have shown severe erosion effects on this material (Fig. 4, 5b, e, f). As far as mass gain and surfaces damage are concerned, similar results were found in our earlier studies on this material in salt water for tidal turbine blade application [11–13].
It is clear from Figs. 2 and 3 that the effects of change in droplet impact velocity are more prominent. With an increase in impact velocity of the droplet, the erosion interaction with specimen increases. The effect of change in tip velocity can be seen in different shapes such as mass gain, increase in mass loss and increased surface dam-age (Fig. 5e, f). The literature shows that researchers have attempted to establish the dependency of impacting veloc-ity, raindrop size and erosion rate, but in vain. However, it
Fig. 6 Erosive wear-mode map in simple water
[image:6.595.150.539.352.720.2] [image:6.595.187.545.359.520.2]has been concluded that as the impact velocity increases, the rate of erosive wear increases [14, 15].
In order to understand how the material was being ejected from the specimen, an SEM analysis was carried out on the debris that was left at the bottom of the tank after a test in a salt solution. It was observed that the material segments that had broken off were larger than expected. As shown in Fig. 5d, there is a large block of epoxy with various glass fibres still woven into the resin. This would suggest that once the top layer of epoxy on the specimen is infiltrated, the glass fibre matrix under the surface becomes very vulnerable and is likely to break off in relatively large segments.
4.1 Erosion Mode Maps
There are several tools by which the overall behaviour of tribological degradation of materials could be investigated. One of these techniques is an erosive wear-mode map. The wear-mode map focuses on the description of the modes of wear encountered in a tribo-system. The wear modes can be termed as low wear, mild wear and severe wear. These maps indicate the transitions in the degradation level of the speci-men with the changes in operating conditions. Approximated wear-modes transition boundaries are highlighted on these maps, which identify the mode of degradation, establish the level of wastage rate and potential ‘‘safe’’ and “unsafe” operation conditions of a tribosystem [16–21].
The erosive wear map illustrates the mass loss of a specimen due to the impact of simple water droplets on the exposed surfaces of the specimen (Fig. 6). On this map, the yellow areas indicate the most erosion and the darker blue is the least erosion for the various combinations of impact velocities and angles of attack.
The wear map generated for the simple water erosion coincided with the erosion observed in Figs. 2 and 3. The most predominant patterns exist between 45° and 75° and the impact velocity exaggerated this, as more mass was lost at higher speeds. The mass loss mechanisms were observed using the SEM techniques. As shown in Fig. 5c, the top layer of the material has been removed by erosion and the glass fibres have been exposed. The pre-existing pin holes in the epoxy have expanded when exposed to liquid droplet impact. In areas where the epoxy is thinnest above the weave, an oval erosion pattern developed by exposing the fibres. Similar erosion behaviour of the fibre-reinforced polymer compos-ites can be seen in the literature [22].
The erosive wear map for 3.5% salt water, to simulate the offshore rain conditions of the wind turbine, illustrates the different erosion regimes for the range of tip speeds and angles of attack (Fig. 7). The wear map suggests that there was no mass loss of the specimen due to erosion at higher impact velocities and higher impact angles. According to Bitter’s theory of erosion, based on the assumption that up
to < 10° impact angles, the erosion is controlled by the cut-ting process of the erodent. At 90°, erosion is controlled by deformation. For the other impact angles, i.e. 10°–90° erosive wear is progressed by the combined, cutting and deformation action of the erodent [23, 24]. The results from the SEM images show that for saltwater droplets seem to follow this theory and erosion occurred due to the impact of the droplet, which results in more damages of the exposed surface instead of the mass loss. As shown in Fig. 5f it is clear that erosion has occurred due to the smooth curves of the top surface and the material removed; the same is shown in Fig. 5e as the liquid impacts have completely broken apart the internal glass fibre weave and removed material. This can be explained due to the crystallisation of saltwater on the surface, leaving salt deposits all across the specimen. The salt crystals can be determined very easily using the SEM as they form quadrilateral shapes [21] as shown in Fig. 5b. This was confirmed using the EDX analysis shown in Fig. 4, and the results of the analysis tabulated in Table 2, to identify the sodium and chlorine elements present on the surface. When this image is compared to the control sample shown in Fig. 5a, it is very clear that the magnitude of salt that crystallised on the surface was fated to skew the results.
The experimental results have revealed that G10 epoxy glass laminate without a surface coating has very poor resist-ant to raindrop erosion in laboratory-simulated onshore and offshore conditions of a wind turbine blade. Generally, fibre-reinforced polymer composites are good choice to be used as wind turbine materials due to their good mechanical proper-ties. These composites are lightweight and are suitable for manufacturing bigger wind turbine blades. The leading edge erosion resistance of these composites can be enhanced. Some type of surface treatment techniques such as by the application of tape, gel coat, erosion-resistant polymer com-posite coatings, on the exposed surfaces of the rotor blades could make this a successful option as a rotor blade material. Further work will be to investigate the effects of such surface treatments on the erosion resistance of such materials for leading edges of wind turbines, onshore and offshore.
5 Conclusions
1. This investigation can conclude that there is a clear rela-tionship between the impact velocity and impact angle of a liquid droplet onto a wind turbine blade. The higher impact velocities yielded greater erosion; at the lower angle of attack, due to shear effects of the droplet, ero-sion was higher; at the higher angle of attack, due to the deformation impact of the droplet, more surface dam-ages was observed but less mass loss.
3. The erosion resistance of such composites for wind tur-bines can be increased by the application of a protective layer on the exposed surfaces such as polymer tape, gel coat and erosion-resistant polymer composite coatings.
Acknowledgements The authors would like to acknowledge the sup-port of the Interreg (Northern Ireland – Ireland – Scotland) Special EU Programmes Grant No SPIRE2_INT – VA – 049 ‘‘Storage Platform for the Integration of Renewable Energy (SPIRE 2)’’.
Open Access This article is distributed under the terms of the Crea-tive Commons Attribution 4.0 International License (http://creat iveco mmons .org/licen ses/by/4.0/), which permits unrestricted use, distribu-tion, and reproduction in any medium, provided you give appropriate credit to the original author(s) and the source, provide a link to the Creative Commons license, and indicate if changes were made.
References
1. https ://ec.europ a.eu/energ y/en/topic s/energ y-strat egy-and-energ y-union /2030-energ y-strat egy. Accessed Oct 2014
2. Keegan MH, Nash DH, Stack MM (2013) Topical review: On erosion issues associated with the leading edge of wind turbine blades. J Phys D 46(38):383001. https ://doi.org/10.1088/0022-3727/46/38/38300 1
3. Sareen A, Sapre C, Selig M (2013) Effects of leading edge ero-sion on wind turbine blade performance. Wind Energy. https ://doi. org/10.1002/we.1649
4. Gaudern N (2014) A practical study of the aerodynamic impact of wind turbine blade leading edge erosion. J Phys 524 012031 5. Keegan MH, Nash DH, Stack MM (2012) Modelling rain drop
impact on offshore wind turbine blades, In: ASME Turbo Expo, 11–15 June 2012
6. Larsen FM, Sorensen T (2003) New lightning qualification test procedure for large wind turbine blades. In: Proceeding of the international conference on lightning and static electricity, Black-pool, 16–19 Sept 2003
7. http://envir onmen talre searc hweb.org/cws/artic le/opini on/37719 . Accessed 4 Oct 2012
8. Ciang CC, Lee JR, Bang HJ (2008) Structural health monitoring for a wind turbine system: a review of damage detection methods. Meas Sci Technol 19:122001
9. Agrim Sareen A, Spare, Chinmay, Selig Michael S (2014) Effects of leading edge erosion on wind turbine blade performance. Wind Energy 17:1531–1542. https ://doi.org/10.1002/we.164.
10. Rafee AR, Ahamed, Stack MM (2016) Impact angle effects on erosion maps of GFRP: applications to tidal turbines. J Bio- Tribo-Corros 2:14
11. Rasool G, Johnstone C, Stack MM (2016) Tribology of tidal tur-bine blades: impact angle effects on erosion of polymeric coatings in sea water conditions. In the Proceedings of 3rd Asian wave and tidal energy conference (AWTEC 2016), vol. 2, Singapore, pp 1016–1033
12. Rasool G, Sharifi S, Johnstone C, Stack MM (2016) Mapping synergy of erosion mechanisms of tidal turbine composite materi-als in sea water conditions. J Bio- Tribo-Corros 2:13 https ://doi. org/10.1007/s4073 5-016-0040-5
13. Sharifi S, Johnstone C, Stack MM (2015) Tribological challenges of scaling up tidal turbine blades. In: Proceedings of EWTEC, Nantes
14. Engel OG (1953) Mechanism of rain erosion. Wright Air Develop-ment Centre, USA. Report No 53 192:1–54
15. Adler WF (1995) Particulate impact damage predictions. Wear 186–187: 35–44
16. Rasool G, Stack MM (2014) Mapping the role of Cr content in dry sliding of steels: comparison between maps for material and counterface. Tribol Int 80:49–57
17. Rasool G, Mridha S, Stack MM (2015) Mapping wear mecha-nisms for TiC/Ti composite coatings. J Wear 328–329:498–508 18. Rasool G, Stack MM (2015) Tribo-oxidation maps for Ti against
steel. J Tribol Int 9:258–266
19. Rasool G, Stack MM (2014) Wear maps for TiC composite based coatings deposited on 303stainless steel. Tribol Int 74:93–102 20. Lim CYH, Lim SC, Lee KS (1999) Wear of TiC-coated carbide
tools in dry turning. Wear 225–229:354–367
21. Stack MM, Huang W, Wang G, Hodge C (2011) Some views on the construction of bio tribo-corrosion maps for titanium alloys in Hank’s solution: particle concentration and applied loads effects. Tribol Int 44:1827–1837
22. Tanuwidjaja D (2002) Experimental Investigation on rejection of sodium sulphate by reverse osmosis membranes. University of California, Los Angeles, pp 31–35
23. Amarendra HJ, Chaudhari GP, Nath SK (2012) Synergy of cavitation and slurry erosion in the slurry pot tester. Wear 290–291:25–31