City, University of London Institutional Repository
Citation
:
Bianconi, F., Kather, J. and Reyes-Aldasoro, C. C. ORCID:
0000-0002-9466-2018 (2019). Evaluation of Colour Pre-processing on Patch-Based Classification of
H&E-Stained Images. In: Digital Pathology. ECDP 2019. Lecture Notes in Computer Science,
11435. (pp. 56-64). Cham: Springer. ISBN 978-3-030-23936-7
This is the accepted version of the paper.
This version of the publication may differ from the final published
version.
Permanent repository link:
http://openaccess.city.ac.uk/id/eprint/22489/
Link to published version
:
http://dx.doi.org/10.1007/978-3-030-23937-4_7
Copyright and reuse:
City Research Online aims to make research
outputs of City, University of London available to a wider audience.
Copyright and Moral Rights remain with the author(s) and/or copyright
holders. URLs from City Research Online may be freely distributed and
linked to.
patch-based classification of H&E-stained images
Francesco Bianconi1,3?, Jakob N. Kather2, and Constantino C. Reyes-Aldasoro3
1
Department of Engineering, Universit`a degli Studi di Perugia Via Goffredo Duranti 93, 06135 Perugia, [email protected]
2
Department of Medicine III, University Hospital RWTH Aachen 52074 Aachen, [email protected]
3
School of Engineering and Mathematical Sciences, City, University of London London EC1V OHB, United [email protected]
Abstract. This paper compares the effects of colour pre-processing on the classification performance of H&E-stained images. Variations in the tissue preparation procedures, acquisition systems, stain conditions and reagents are all source of artifacts that can affect negatively computer-based classification. Pre-processing methods such as colour constancy, transfer and deconvolution have been proposed to compensate the arti-facts. In this paper we compare quantitatively the combined effect of six colour pre-processing procedures and 12 colour texture descriptors on patch-based classification of H&E-stained images. We found that colour pre-processing had negative effects on accuracy in most cases – partic-ularly when used with colour descriptors. However, some pre-processing procedures proved beneficial when employed in conjunction with clas-sic texture descriptors such as co-occurrence matrices, Gabor filters and Local Binary Patterns.
Keywords: Colour·Histology·Hematoxylin·Eosin·Texture.
1
Introduction
Digital Pathology has grown considerably in recent years encompassing computer-based activities that allow for improvements and innovations in the workflow of pathology [1]. In this domain the automated processing of tissue samples has received increasing attention due to the potential applications in diagnosis [2], grading [3], identification of tissue substructures [4], prognostication and mu-tation prediction [5]. A number of problems, however, still limit the adoption of digital pathology on a large scale: the relatively scarce availability of large la-belled datasets of histological images, the differences in the acquisition systems and/or protocol used as well as the variability in tissue preparation and/or stain reactivity [6]. The latter, in particular, can generate colour variations and arti-facts that can reduce significantly the accuracy of computer-based methods. This
?
2 F. Bianconi, J.N. Kather and C.C. Reyes-Aldasoro
Abbrv. Sample images Tissue type Classes / Patch size
AP Breast cancer (in-vasive ductal carci-noma)
Grade I (n= 107), II (n= 102) and III (n= 91) / 1280px×960px
BH Breast cancer (eighthistological types) Benign (1370) / 700pxn= 625) and malignant (n=
×460px
KM Low and high grade
colorectal cancer
Epithelium, stroma, complex stroma, debris, adipose, necrosis and back-ground (n= 625 each) / 150px×150px
LM Lymphoma
Chronic lymphocytic leukemia (n = 113), follicular lymph. (n= 139) and mantle cell lymph. (n= 122) / 1388px
×1040px
NKI Breast cancer (gradesI, II and III) Epithelium (189) / 100pxn×= 1106) and stroma (100px n=
VGH Breast cancer (gradesI, II and III) Epithelium (47) / 100pxn= 226) and stroma (n=
×100px
[image:3.612.138.468.94.337.2]WR Colorectal cancer Benign (/ Variablen= 74) and malignant (n= 91)
Fig. 1: Datasets used in the experiments: round-up table and sample images.
problem has attracted much attention lately and different colour pre-processing methods have been proposed as possible solutions [7]. Still, their beneficial ef-fects on patch-based classification of H&E-stained images are not clear, since only few studies have addressed the subject in a quantitative way [8,9,10]. Also, apart from [10], little has been investigated as concerns the coupled effects of colour pre-processing and the specific image descriptor used.
In this paper we present a quantitative evaluation of the effects of colour pre-processing on patch-based classification of H&E-stained images. The study is based on seven datasets of histological images from different sources, six colour pre-processing procedures and 12 colour texture descriptors.
2
Materials and methods
2.1 Image datasets (Fig. 1)
Agios Pavlos (AP). Breast carcinoma histological images from the Depart-ment of Pathology, ‘Agios Pavlos’, General Hospital of Thessaloniki, Greece [11] (https://zenodo.org/record/834910) representing tissue samples from 21 pa-tients with invasive ductal carcinoma of grade I, II and III.
Kather Multiclass (KM). Histological images of colorectal cancer from the University Medical Center Mannheim, Heidelberg University, Germany [4] (https://zenodo.org/record/53169) representing eight tissue subtypes.
Lymphoma (LM). Multi-center collection of histological images from ma-lignant lymphoma [13] (https://ome.grc.nia.nih.gov/iicbu2008/lymphoma/ index.html) organised in three classes: chronic lymphocytic leukemia, follicular lymphoma and mantle cell lymphoma.
Netherlands Cancer Institute (NKI). Tissue micro-arrays (TMAs) from a cohort of patients with breast cancer enrolled at the Netherlands Cancer In-stitute, Amsterdam, Netherlands [14] (https://tma.im/tma_portal/C-Path/ supp.html). The dataset includes with segmentation masks from which we ex-tracted tiles of well defined areas of epithelium and stroma.
Vancouver General Hospital (VGH). Same structure as (NKI), but here the images come from a cohort of 328 patients enrolled at Vancouver General Hospital in Canada [14] (https://tma.im/tma_portal/C-Path/supp.html).
Warwick-QU (WR). Histological images of colorectal cancer from the Uni-versity Hospitals Coventry and Warwickshire, United Kingdom [15] (https:// warwick.ac.uk/fac/sci/dcs/research/tia/glascontest/download/) organ-ised in two classes (benign and malignant).
2.2 Colour normalisation
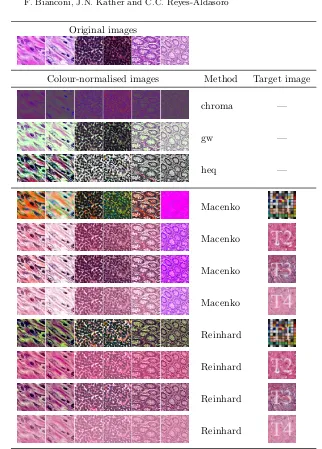
We evaluated three colour constancy, two colour transfer and one colour decon-volution method as detailed below. The effects of each method on a set of sample images are shown in Figs. 2–3.
Colour constancy. We considered chromaticity representation (‘chroma’ in the remainder), grey-world normalisation (‘gw’) and histogram equalisation (‘heq’) [16]. In the experiments we used Jost van de Weijer’s Color Constancy Tool-box (http://lear.inrialpes.fr/people/vandeweijer/research.html) and Matlab’shisteq()function respectively for ‘gw’ and ‘heq’.
Colour transfer. We employed Macenko’s [17] and Reinhard’s [18] methods using the implementation provided with Warwick’s Stain Normalization Toolbox (https://warwick.ac.uk/fac/sci/dcs/research/tia/software/sntoolbox/, SNT henceforth). For each of the two approaches we used four target images, denoted in the remainder as T1, T2, T3 and T4 (Fig. 2). These are all histology images except T1, which is a colour calibration checker. As for the others, T2 is part of SNT demo, whereas T3 and T4 come from The Cancer Genome At-las (https://cancergenome.nih.gov/). The target images were chosen by the authors based on their subjective judgement.
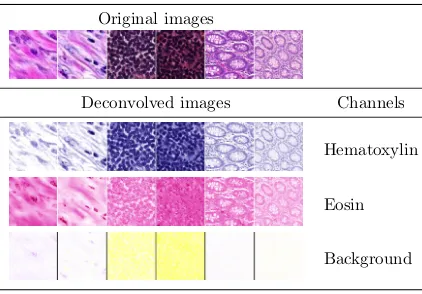
Colour deconvolution. Colour deconvolution was based on Ruifrok and John-ston’s method [19], again via SNT. In the remainder this is denoted as ‘decoRJ’.
2.3 Image descriptors
4 F. Bianconi, J.N. Kather and C.C. Reyes-Aldasoro
Original images
Colour-normalised images Method Target image
chroma —
gw —
heq —
Macenko
Macenko
Macenko
Macenko
Reinhard
Reinhard
Reinhard
[image:5.612.144.466.95.544.2]Reinhard
Fig. 2: Illustration of the effects of normalisation. Notice the influence of target images.
Marginal colour histograms(MargHists). Concatenation of the three 1D in-tensity histograms [21] of each colour channel (256×3 = 768 features).
Original images
Deconvolved images Channels
Hematoxylin
Eosin
[image:6.612.201.412.114.261.2]Background
Fig. 3: Colour deconvolution via Ruifrok and Johnston’s method: samples of original (RGB) and deconvolved images. Deconvolved channels are in pseudo-colours..
orientation 0◦, 45◦, 90◦and 135◦(5
×3×4 = 60 features). Discrete Fourier trans-form (DFT) normalisation was applied for rotation invariance [22].
Gabor filters (Gabor). Mean and standard deviation of the magnitude of transformed images from a bank with four frequencies and six orientations (2× 4×6 = 48 features). Rotation invariance was obtained via DFT normalisation. Local Binary Patterns(LBP). Concatenation of rotation-invariant (‘ri’) LBP histograms computed at resolution 1px, 2px and 3px using non-interpolated eight-pixel neighbourhoods as detailed in [23].
Hybrid methods. Marginal colour versions of Gabor, GLCM and LBP were also obtained by applying the corresponding grey-scale descriptor to each colour channel separately and concatenating the resulting features. These are indicated as ‘MargGabor’, ‘MargGLCM’ and ‘MargLBP’ tn the remainder.
Pre-trained convolutional networks. L2-normalised output of the last fully-connected layer from the following pre-trained networks: 50 and ResNet-101 [24], VGG very deep 16 and VGG very deep 19 [25].
3
Results and discussion
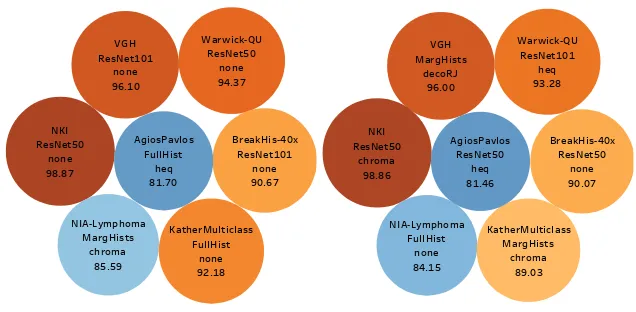
Each dataset was analysed for a combination of pre-processing and image de-scriptor, the accuracy being estimated via split-sample validation with stratified sampling at the image level4. The random subdivision into train and test set was repeated a hundred times and the results averaged. Classification was based on the 1-NN rule withL1 distance. We used a train ratio (i.e. fraction of images used for training) f = 1/4 andf = 1/8, and the results did not show signifi-cant deviation in the overall trend. The best and second-best combinations are shown in Fig. 4. Pre-trained ResNet50/ResNet101 performed best or second-best in eight cases out of 14 (accuracy range of second-best configurations 71.56% –
4
6 F. Bianconi, J.N. Kather and C.C. Reyes-Aldasoro
Warwick-QU ResNet50
none 94.37 VGH
ResNet101 none 96.10
NKI ResNet50
none 98.87
NIA-Lymphoma MargHists
chroma 85.59
KatherMulticlass FullHist
none 92.18
BreakHis-40x ResNet101
none 90.67 AgiosPavlos
FullHist heq 81.70
Warwick-QU ResNet101
heq 93.28 VGH
MargHists decoRJ
96.00
NKI ResNet50
chroma 98.86
NIA-Lymphoma FullHist
none 84.15
KatherMulticlass MargHists
chroma 89.03
BreakHis-40x ResNet50
none 90.07 AgiosPavlos
[image:7.612.148.466.114.270.2]ResNet50 heq 81.46
Fig. 4: Best (left) and second-best combinations (right) for each dataset. Each circle corresponds to a dataset, with its descriptor, pre-processing and accuracy. Colours reflect accuracy (brown = best, blue = worst). Results obtained forf= 1/4.
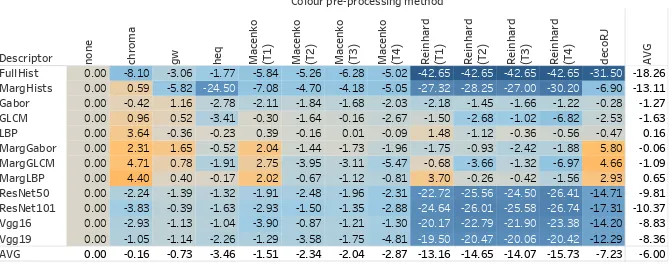
98.81%), followed by joint and marginal colour histograms (six cases, accuracy range 80.09% – 98.16%). As for colour pre-processing, doing nothing was the best or second-best option in seven cases out of 14, followed by heq and chroma. Table 1 shows the difference to the baseline (colour pre-processing vs. no colour processing) by descriptor and processing method. Colour pre-processing resulted in a loss of accuracy in most cases – in particular, methods that rely on colour responded negatively to colour pre-processing. Colour transfer via Macenko’s and Reinhard’s methods did not show a clear trend as for the effects of the target image used. Note that the non-histological target image (T1) gave better results than the histological ones (T2–T4) in some cases.
By contrast, the texture-based methods proved more resilient to colour pre-processing. In this case there was even a noticeable gain in accuracy in some com-binations descriptor/pre-processing method: marginal colour texture descrip-tors (i.e. MargGabor, MargGLCM and MargLBP) responded positively both to ‘chroma’ normalisation and colour deconvolution. This suggests that texture fea-tures provide complementary information when extracted separately from each of the hematoxylin, eosin and background channels.
4
Conclusions
Table 1: Effect of colour pre-processing: difference to the baseline broken down by image descriptor and colour pre-processing method. Colour reflects accuracy (brown = best, blue = worst). Values are averaged over the seven datasets;f= 1/4.
Descriptor
Colour pre-processing method
no ne ch ro m a
gw heq Mac
en ko (T 1) M ac en ko (T 2) M ac en ko (T 3) M ac en ko (T 4) R ei nh ar d (T 1) R ei nh ar d (T 2) R ei nh ar d (T 3) R ei nh ar d (T 4) de co R J A V G
FullHist MargHists Gabor GLCM LBP MargGabor MargGLCM MargLBP ResNet50 ResNet101 Vgg16 Vgg19
AVG -6.00
-8.36 -8.83 -10.37 -9.81 0.65 -1.09 -0.06 0.16 -1.63 -1.27 -13.11 -18.26
-7.23
-12.29 -14.20 -17.31 -14.71 2.93 4.66 5.80 -0.47 -2.53 -0.28 -6.90 -31.50
-15.73
-20.42 -23.38 -26.74 -26.41 -1.56 -6.97 -1.88 -0.56 -6.82 -1.22 -30.20 -42.65
-14.07
-20.06 -21.90 -25.58 -24.50 -0.42 -1.32 -2.42 -0.36 -1.02 -1.66 -27.00 -42.65
-14.65
-20.47 -22.79 -26.01 -25.56 -0.26 -3.66 -0.93 -1.12 -2.68 -1.45 -28.25 -42.65
-13.16
-19.50 -20.17 -24.64 -22.72 3.70 -0.68 -1.75 1.48 -1.50 -2.18 -27.32 -42.65
-2.87
-4.81 -1.30 -2.88 -2.31 -0.81 -5.47 -1.96 -0.09 -2.67 -2.03 -5.05 -5.02
-2.04
-1.75 -1.21 -1.35 -1.96 -1.12 -3.11 -1.73 0.01 -0.16 -1.68 -4.18 -6.28
-2.34
-3.58 -0.87 -1.50 -2.48 -0.67 -3.95 -1.44 -0.16 -1.64 -1.84 -4.70 -5.26
-1.51
-1.29 -3.90 -2.93 -1.91 2.02 2.75 2.04 0.39 -0.30 -2.11 -7.08 -5.84
-3.46
-2.26 -1.04 -1.63 -1.32 -0.17 -1.91 -0.52 -0.23 -3.41 -2.78 -24.50 -1.77
-0.73
-1.14 -1.13 -0.39 -1.39 0.40 0.78 1.65 -0.36 0.52 1.16 -5.82 -3.06
-0.16
-1.05 -2.93 -3.83 -2.24 4.40 4.71 2.31 3.64 0.96 -0.42 0.59 -8.10
0.00 0.00 0.00 0.00 0.00 0.00 0.00 0.00 0.00 0.00 0.00 0.00 0.00
In conclusion, our results suggest that the use of colour pre-processing for patch-based classification of H&E images should be considered with care. In particular: 1) no pre-processing may provide better results than pre-processing in most cases; 2) the selection of the pre-processing procedure should always be evaluated in conjunction with the image descriptor(s) used.
Acknowledgements This work was partially supported by the Italian Ministry of Education, University and Research (MIUR) under the Individual Funding Scheme for Fundamental Research (‘FFABR 2017’) and by the Department of Engineering at the University of Perugia, Italy, under the Fundamental Research programme 2018.
References
1. J. Griffin and D. Treanor. Digital pathology in clinical use: where are we now and what is holding us back? Histopathology, 70(1):134–145, 2017.
2. P. Sudharshan, C. Petitjean, F. Spanhol, et al. Multiple instance learning for histopathological breast cancer image classification. Expert Sys App, 117:103–111, 2019.
3. A. Jørgensen, J. Emborg, R. Røge, et al. Exploiting multiple color representations to improve colon cancer detection in whole slide H&E stains. In Proc. of the 1st Intern. Workshop on Computational Pathology (COMPAY), volume 11039 of LNCS, pages 61–68. Springer, Granada, Spain, September 2018.
4. J. Kather, C.-A. Weis, F. Bianconi, et al. Multi-class texture analysis in colorectal cancer histology. Sci Rep, 6, 2016.
5. N. Coudray, P. Ocampo, T. Sakellaropoulos, et al. Classification and mutation pre-diction from non–small cell lung cancer histopathology images using deep learning. Nat Med, 24:1559–1567, 2018.
[image:8.612.142.478.172.304.2]8 F. Bianconi, J.N. Kather and C.C. Reyes-Aldasoro
7. D. Komura and S. Ishikawa. Machine learning methods for histopathological image analysis. Comput Struc Biotec, 16:34–42, 2018.
8. A. Sethi, L. Sha, A. Vahadane, et al. Empirical comparison of color normalization methods for epithelial-stromal classification in H and E images. J Pathol Inform, 7(1), 2016.
9. F. Ciompi, O. Geessink, B. E. Bejnordi, et al. The importance of stain normaliza-tion in colorectal tissue classificanormaliza-tion with convolunormaliza-tional networks. InProc. of the IEEE Intern. Symp. on Biomed Imaging. Melbourne, Australia, April 2017. 10. M. Gadermayr, S. Cooper, B. Klinkhammer, et al. A quantitative assessment of
image normalization for classifying histopathological tissue of the kidney. InProc. of the 39th German Conference on Pattern Recognition (GCPR), volume 10496 of LNCS, pages 3–13. Springer, Basel, Switzerland, September 2017.
11. K. Dimitropoulos, P. Barmpoutis, C. Zioga, et al. Grading of invasive breast carcinoma through Grassmannian VLAD encoding. PLoS ONE, 12(9), 2017. 12. F. Spanhol, L. Oliveira, C. Petitjean, et al. A dataset for breast cancer
histopatho-logical image classification. IEEE Trans Biomed Eng, 63(7), 2016.
13. L. Shamir, N. Orlov, D. Mark Eckley, et al. IICBU 2008: A proposed benchmark suite for biological image analysis. Med Biol Eng Comput, 46(9):943–947, 2008. 14. A. Beck, A. Sangoi, S. Leung, et al. Imaging: Systematic analysis of breast cancer
morphology uncovers stromal features associated with survival. Sci Transl Med, 3(108), 2011.
15. K. Sirinukunwattana, D. R. J. Snead, and N. M. Rajpoot. A stochastic polygons model for glandular structures in colon histology images.IEEE Trans Med Imaging, 34(11):2366–2378, 2015.
16. E. Cernadas, M. Fern´andez-Delgado, G.-R. E., et al. Influence of normalization and color space to color texture classification. Pattern Recognit, 61:120–138, 2017. 17. M. Macenko, M. Niethammer, J. Marron, et al. A method for normalizing histology slides for quantitative analysis. In Proc of the IEEE Intern Symp on Biomed Imaging (ISBI), pages 1107–1110. Boston, USA, June 2009.
18. E. Reinhard, M. Ashikhmin, B. Gooch, et al. Color transfer between images.IEEE Comput Grap Appl, 21(5):34–41, 2001.
19. A. Ruifrok and D. Johnston. Quantification of histochemical staining by color deconvolution. Anal Quant Cytol Histol, 23(4):291–299, 2001.
20. M. Swain and D. Ballard. Color indexing. Int J Comp Vis, 7(1):11–32, 1991. 21. M. Pietikainen, S. Nieminen, E. Marszalec, et al. Accurate color discrimination
with classification based on feature distributions. InProc of the Intern. Conf. on Pattern Rec. (ICPR), volume 3, pages 833–838. Vienna, Austria, August 1996. 22. F. Bianconi and A. Fern´andez. Rotation invariant co-occurrence features based on
digital circles and discrete Fourier transform. Pattern Recognition Lett, 48:34–41, 2014.
23. F. Bianconi, R. Bello-Cerezo, and P. Napoletano. Improved opponent color local binary patterns: an effective local image descriptor for color texture classification. J Electron Imaging, 27(1), 2018.
24. K. He, X. Zhang, S. Ren, et al. Deep residual learning for image recognition. In Proc of Comp Vision and Pattern Recognition, pages 770–778. Las Vegas, United States, January 2016.